Abstract: Artificial intelligence is reshaping building design processes to be smarter and automated. Considering the increasingly wide application of shear wall systems in high-rise buildings and envisioning the massive benefit of automated structural design, this paper proposes a generative adversarial network (GAN)-based shear wall design method, which learns from existing shear wall design documents and then performs structural design intelligently and swiftly. To this end, structural design datasets were prepared via abstraction, semanticization, classification, and parameterization in terms of building height and seismic design category. The GAN model improved its shear wall design proficiency through adversarial training supported by data and hyper-parametric analytics. The performance of the trained GAN model was appraised against the metrics based on the confusion matrix and the intersection-over-union approach. Finally, case studies were conducted to evaluate the applicability, effectiveness, and appropriateness of the innovative GAN-based structural design method, indicating significant speed-up and comparable quality.
Keyword: intelligent structural design, shear wall system, generative adversarial network, computer vision, data and hyper-parametric analytics
1 INTRODUCTION
Intelligent design offers advantages in its ability to minimize manual design work, promote diversity in the design space, and ultimately provide optimal design performance [1-5]. As a result of rapid global urbanization, the demand for high-rise residential buildings is continuously increasing [6,7]. Reinforced concrete shear wall systems have been widely used in high-rise designs. The transfer of architectural proposals to construction documents involves arranging structural layouts, defining the position and orientation of structural systems, and controlling the dimensions of structural components [8]. These steps are fundamental to the design process. However, because of their iterative nature, they are also very time consuming, even when conducted by competent engineers. An innovative design approach with greater efficiency is needed, and the intelligent structural design is an emerging approach.
Existing approaches are primarily based on generative design. The commonly used options are as follows: (1) design exploration using topology optimization, genetic algorithms, and cellular automata; (2) design synthesis using generative grammars; and (3) design by analogy [1-5]. These approaches are particularly favorable for geometric modeling and are less suitable for engineering calculations. Hence, they are mainly applied to architecture and have found very few applications in structural design. In addition, the considerable computational expense of the underlying algorithms forfeits their use in the scheme design stage.
Deep learning methods offer a new option to overcome these challenges. They have been used efficiently for various purposes via pre-training [9-12]. The generative adversarial network (GAN) is one of the most widely used frameworks [13] for automated architectural design [14-16]. In a GAN framework, the generative network learns to generate candidates of interest, while the discriminative network distinguishes the generated candidates from the ground truth [13]. The generator synthesizes images using the initial input noises and enhances the generation quality based on the feedback from the discriminator until the discriminator fails to judge. Simultaneously, the discriminator consistently elevates the skill at detecting synthetic outputs by the generator. Finally, GAN converges to a Nash equilibrium between the discriminator and generator. Adversarial training is applied to both networks so that the generator and discriminator can master the generation and discrimination, respectively [13,17,18]. Additionally, compared with the convolutional neural network (CNN)-generated images, GAN-synthesized images are more refined and precise [17,18]. GAN has been successfully adopted in innovative architectural home design [14-16], and barely used in structural design. Hence, this study extends the application of GAN to shear wall structural design. The GAN model improves the design proficiency by learning from existing design documents, thus offering a significant improvement in design efficiency and performance.
This paper presents the development and optimization of a GAN-based structural design framework, StructGAN, in Section 2. Then Section 3 elaborates the implementation of StructGAN, including dataset establishment, the associated engineer-perception-based and computer-vision-based performance metrics, and design process. Next, Section 4 introduces detailed discussions on GAN networks and datasets. Moreover, in Section 5, by comparing designs by StructGAN and competent engineers, case studies of the GAN-based framework suggest that it is a promising and versatile design approach for the future. Finally, Section 6 presents the conclusions of the study.
2 STRUCTGAN METHOD
StructGAN was developed to address the growing concerns in the construction industry. Some of the negative impacts experienced include (1) the lack of an efficient communication link between architects and engineers, (2) the low cost-effectiveness in the design iterations, and (3) the quality uncertainties associated with experiential knowledge [19,20]. Therefore, process optimization and automation are necessary to minimize the total project time and cost. As such, StructGAN attempts to achieve the highest efficiency via artificial intelligence. It resolves the highly involving correlation between the architectural and structural fields through sophisticated maps established by deep learning, which converts the iterations to one-step solutions, reduces variations in design quality, and strengthens the control of design processes.
The strategic innovations adopted by StructGAN involve a semantic engagement of prior knowledge and high-level performance metrics. By activating experiential knowledge in structural engineering, StructGAN recognizes the crucial structural concepts, such as the locations of openings and the connectivity of structural components [8]. It abstracts the architectural schemes, extracts and color-codes the layout patterns, and make them structurally meaningful. The semanticization process reduces enormously the data dimension while keeping all the core information that can adequately inform the structural design, and ultimately boosts the design performance. To expedite the learning cycles, StructGAN not only adopts the traditional pixel-by-pixel evaluation, which fails to comprehend the overall structural layout. It also adopts intersection over union (IoU) [21] as the core metric. The IoU metric can properly gauge the overall similarity of the design under evaluation against the reference design and provide valuable guidance and feedback to the training direction. These innovations provide a solid foundation for the design performance that StructGAN delivers consistently to all types of building structures.
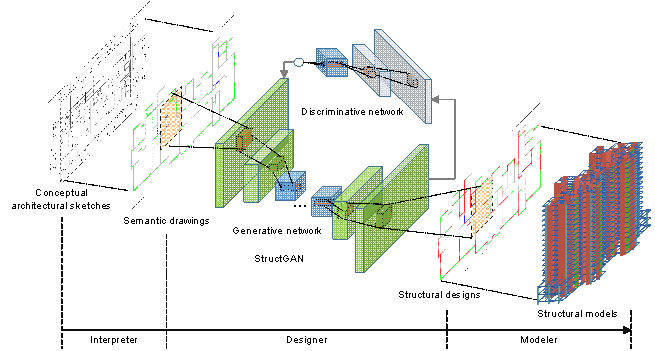
Figure 1 StructGAN. The StructGAN automated structural design framework. Interpreter: digesting and semanticizing the architectural sketches. Designer: analyzing the semantic drawings and devising the structural design. Modeler: proposing the design and the corresponding structural model.
Table 1 The excellent performance of StructGAN with high efficiency and superior quality
|
StructGAN performance |
High efficiency |
Superior quality |
|||
|
20 times faster |
10 times faster |
Comparable potential seismic loss (only 6% larger) |
Excellent stability |
||
|
Competent engineers |
3.5 h / |
300 h / |
$9,846,000 USD |
Economic and mechanical performance of designs by inexperienced engineers are inferior to those by senior engineers |
|
|
StructGAN |
10 min / |
30 h / |
$10,454,500 USD |
Consistent design quality for structural designs with various heights and seismic design intensities |
|
The estimation of design efficiency, safety, and economic performance are elaborated in Section 3.3 StructGAN design. The time consumption of competent engineers is derived from the study of Chakrabarti [22]. The potential seismic losses are analyzed by the widely adopted FEMA P58 method [23], and the values are the mean losses of two typical high-rise shear wall residential buildings.
The components of StructGAN are summarized in Figure 1: interpreter, designer, and modeler. The interpreter digests and semanticizes the architectural sketches. Then, the designer analyzes the semantic drawings, performs the inference, and devises the structural design. Finally, the modeler proposes the design and presents the structural model. Table 1 compares the performances of StructGAN and the conventional design process. StructGAN offers a promising increase in speed by a factor of 10, which is equivalent to saving billions of US dollars per annum in the industry. As it learns and evolves continuously, StructGAN will undoubtedly obtain much higher savings.
3 IMPLEMENTATION OF STRUCTGAN
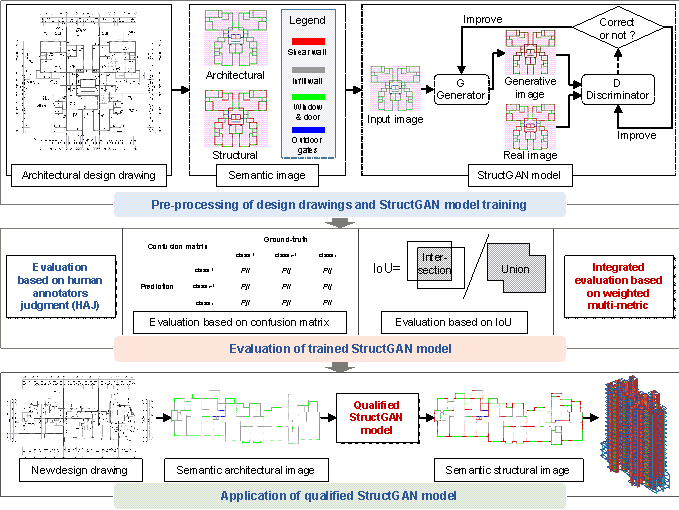
Figure 2 The framework of StructGAN, including training, evaluation, and application
The StructGAN implementation is illustrated in Figure 2, including three dominating steps: (1) datasets and StructGAN training, (2) StructGAN performance evaluation, and (3) StructGAN application.
3.1 Datasets and StructGAN training
GAN learns from previous designs based on maximum likelihood estimation, making the probability distributions and qualities of the StructGAN design directly associated with the training datasets. Thus, to ensure the quality of the source design, this study applied approximately 250 pairs of architectural�Cstructural designs from more than ten famous architectural design and research institutes in China. Moreover, these designs satisfied all relevant design specifications, were optimized and evaluated by experienced engineers, and were adopted in real-world construction applications with excellent quality. Subsequently, based on raw design datasets, semanticization and classification were conducted for the designs.
This study adopted the semantic process by extracting essential architectural and structural elements in design images and coding them by color patterns, so that critical design elements and the corresponding structural layout information are maintained. Semantic designs can effectively reduce the dimension of probability distributions and enhance training performance. In this study, the red (RGB = (255, 0, 0)), gray (RGB = (132, 132, 132)), green (RGB = (0, 255, 0)), and blue (RGB = (0, 0, 255)) colors denote the structural shear wall, nonstructural infill wall, indoor window, and outdoor gate, respectively. The reader may note that this study adopted the semi-automated interpreter module to extract the critical elements of images to ensure that the interpreter-processed semantic images for GAN training and testing are clear and accurate. Furthermore, the StructGAN interpreter module is ready to be further enhanced by adopting the existing proposals of CAD extraction [24].
In addition, the structural design for shear wall residential buildings is directly related to the design conditions of structural heights and seismic design intensities, and design conditions-based dataset classification can efficiently narrow the learning restriction of StructGAN to promote design precision. According to the Chinese Code for Seismic Design of Buildings [25], the datasets were classified into 7-degree and 8-degree seismic intensities. Notably, the corresponding peak ground acceleration (PGA) values of the design basis earthquake (i.e., 10% probability of exceedance in 50 years) are 100 cm/s2 and 200 cm/s2 in the 7-degree and 8-degree seismic intensity zones, respectively. Subsequently, based on the structural height regulations in the Chinese Technical Specification for Concrete Structures of Tall Buildings [26], the datasets are classified into H1 (i.e., height �� 50 m) and H2 (i.e., height > 50 m). In addition, the maximal building height is 141 m. The high seismic design intensity dominates the demands for structural seismic resistance in the 8-degree seismic intensity zones with slight influence of structural heights; thus, the designs in the 8-degree seismic intensity zones were not divided by heights. Consequently, the datasets were classified and named Group7-H1, Group7-H2, and Group8, respectively. GroupMix was built by randomly selecting designs from each group and mixed for contrast, including 26 data from each training dataset and 3 data from each test dataset. Thus, 63, 80, 81, and 78 training sets and 8, 8, 8, and 9 testing sets in Group7-H1, Group7-H2, Group8, and GroupMix, respectively. Typical datasets are shown in Figure 3.
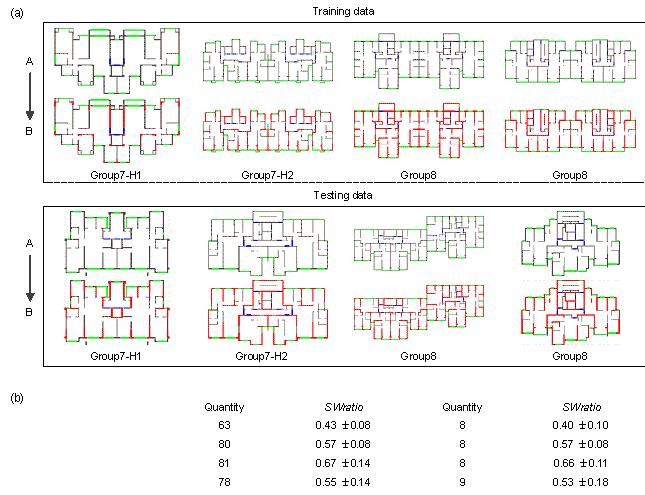
Figure 3 Datasets for GAN training. (a) Typical training-testing sets. (The top row A shows the input architectural design images, and the bottom row B is the corresponding target structural design images). (b) Different datasets classified by structural height and seismic design intensity. (SWratio (Equation (6)) denotes the ratio of shear walls to total walls, reflecting the area proportion of the shear walls to the total walls).
Based on the pre-processed datasets, the StructGAN could be trained effectively. In addition to the regular training recommended by pix2pixHD [18], in terms of the determined StructGAN system, this study also proposed performance enhancement approaches by (1) data augmentation and (2) parametric adjustment for the generative network architecture of pix2pixHD. The datasets were augmented by flipping the images vertically and horizontally and rotating the images 180��. This was done because the flip and rotation operations do not change the spatial layout of the structural shear walls in the image, and the number of Group7-H2 training data reasonably increased from 80 to 320. Furthermore, the complexity of local features is significantly reduced owing to the semantic architectural�Cstructural designs; hence, the generator architecture can be simplified to generate more confined and precise image elements. The numbers of global down-sample layers (n_downsample_global) and residual blocks in the global generator network (n_blocks_global) were reduced from 4 to 2 (or 1) and from 9 to 6, respectively.
3.2 Evaluation and metrics
Table 2 Review of quality evaluation methods
|
References |
Pascal tests |
Perceptual tests (qualitative evaluation) |
|
|
Method |
Metric |
||
|
Springenberg (2015)[27] |
/ |
Log-likelihood estimate |
/ |
|
Classification |
Classification error |
||
|
Salimans et al. (2016)[28] |
/ |
exp(ExKL(p(y|x)��p(y))) |
AMT |
|
Wang & Gupta (2016)[29] |
Classification |
Maximum norm ��∙���� |
AMT |
|
Detection |
Number of objects |
||
|
Zhang et al. (2016)[30] |
Classification |
mAP |
AMT |
|
Detection |
|||
|
Segmentation |
IoU |
||
|
Zhu et al. (2017)[31] |
Segmentation |
Per-pixel acc., IoU |
AMT |
|
Isola et al. (2017)[17] |
Segmentation |
Per-class acc., IoU |
AMT |
|
Wang et al. (2018)[18] |
Segmentation |
Pixel acc., IoU |
AMT |
Segmentation is derived from the studies of semantic segmentation [32,33]; Detection is derived from the studies of object detection [34-36]. ��mAP�� denotes mean average precision; ��acc.�� denotes accuracy; ��IoU�� denotes intersection over union; ��AMT�� denotes Amazon mechanical turk.
Accurate quality evaluation of GAN-synthetic images is vital and challenging for GAN-related studies [30,37]. The critical content of evaluation is the difference quantification of generations and targets. For images with high-dimensional probability distributions, the detailed evaluations are listed in Table 2, including (1) Amazon Mechanical Turk (AMT) perceptual studies, and (2) a computer vision-based assessment of synthetic images. However, compared with the image assessments, the evaluations for structural design are more complicated to reasonably consider the structural layouts and their correlations. Hence, based on the widely adopted AMT perceptual evaluation and image pixel-based evaluation, this study developed an engineer perception-based and computer vision-based evaluation method, assessing the rationality of the structural layout.
Table 3 Evaluation based on engineer perception
|
1. Please distinguish
the following images: AI-generated or Engineer-designed? |
|||||
|
|
|||||
|
[Choice] * |
|||||
|
�� AI-generated |
�� Engineer-designed |
||||
|
2. Reasonability score of the shear wall design (1 - Unreasonable, 5 - Reasonable) |
|||||
|
[Choice] * |
|||||
|
�� 1 |
�� 2 |
�� 3 |
�� 4 |
�� 5 |
|
Engineer perception-based evaluation: the evaluation based on engineer perception is the most straightforward method to identify the acceptance by engineers of the StructGAN design capabilities. It includes (1) ��AI�� or ��Engineer�� judgment, which involves inviting engineers to distinguish designs produced by StructGAN or competent engineers, and (2) rationality score for designs, which comprises asking for scores given by engineers based on their experience and perception. Similar to the AMT method, the engineer perception-based evaluation was conducted on the Questionnaire Star (https://www.wjx.cn/) platform for blind tests, and typical parts of the questionnaire are illustrated in Table 3. This study invited 11 senior experts (work experience > 15 years), 12 practicing engineers, and graduate students to participate in the judgment and assessment tasks, and the corresponding metrics were proposed based on the evaluation results. SEP-1 is the metric for the ��AI�� or ��Engineer�� judgment, expressed in Equation (1), and which equally counts the judgment of experts and ordinary engineers. SEP-2 is the metric for rationality evaluation, expressed in Equation (2), and which adopts the coefficient of the variation to weight the scores by experts and ordinary engineers (Equation (3)).
|
|
(1) |
|
|
(2) |
|
|
(3) |
where Nex and Nnonex denote the number of experts and non-experts, respectively, and NF and NT indicate the number of misjudgments and correct judgments of StructGAN designs, respectively. Nimg is the number of assessed images, Sj is the score of image j, and ��ex and ��nonex are the weight coefficients of the scores of experts and non-experts, respectively. ��ex and ��nonex are the standard deviations of the scores of experts and non-experts, respectively, and ��ex and ��nonex are their mean values, respectively. The determination of the weight coefficients in Equation (3) refers to the coefficient of the variation-based method proposed by Diakoulaki et al. [38], where a smaller coefficient of variation corresponds to a higher weight.
Computer vision-based evaluation: the integrated consideration of the generated image quality and rationality of the structural design by StructGAN is a significant advantage of the proposed computer vision-based evaluation method. In general, the simultaneous quality evaluation of synthetic images and structural designs is challenging. This study adopted a confusion matrix [39] to assess the generation quality of critical elements in images and IoU of structural layouts to assess the rationality of the structural design. Subsequently, two methods are weighted to evaluate the comprehensive performance of StructGAN.
In the confusion-matrix-based assessment (Figure 4), adopting the classification of each pixel and the correctness judgment of the pixel type to evaluate the generative quality is the core superiority. First, structural shear walls, nonstructural infill walls, indoor windows, and outdoor gates are directly distinguished and separated according to the hue saturation value (HSV) of each pixel, utilizing the Open Source Computer Vision (OpenCV) library for image processing to convert the colors into the HSV mode [40] (Figure 4a). The extracted elements of the StructGAN design are compared with those of engineers pixel-by-pixel, and then the comparison results are used to create a confusion matrix (Figures 4b and 4c). Subsequently, based on the confusion matrix, Pixel accuracy (PA), weighted IoU (WIoU), and shear wall ratio (SWratio) are proposed and used, where PA (Equation (4)) measures the image clarity, WIoU (Equation (5)) estimates the generative quality of critical elements, and SWratio (Equation (6)) reflects the total amount of structural shear walls. Owing to the above-proposed metrics derived from image pixel classification, the use of the confusion-matrix-based evaluation could measure the comprehensive quality of the generated image.
|
|
(4) |
|
|
(5) |
|
|
(6) |
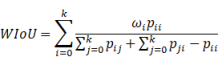
where (k+1) is the total class (class 0 is background, class 1 is shear wall, class 2 is infill wall, class 3 is window, class 4 is outdoor gate), pij is the number of pixels of class i inferred to belong to class j. In other words, pii represents the number of true generated pixels, whereas pij and pji are usually interpreted as false generated pixels, respectively (Figure 2). ��0 = 0, ��1 = 0.4, ��2 = 0.4, ��3 = 0.1, and ��4 = 0.1; the synthetic results of the shear wall and infill wall are the most essential, and hence, their weights are the largest. Aswall and Ainwall are the total areas of the shear wall and infill wall, respectively.
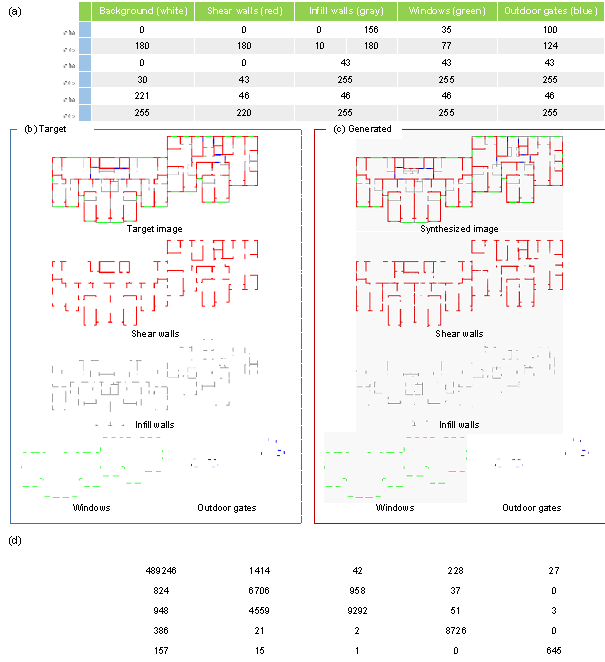
Figure 4 Information on confusion-matrix-based assessment. (a) The value range of 5 colors in the HSV color mode. (b) The critical extracted elements of the target image. (c) The critical extracted elements of the generated image. (d) Confusion matrix used to obtain PA, WIoU, and SWratio.
In the structural IoU-based evaluation (Figure 5), the core superiority is the consistency measurement of the structural layouts designed by StructGAN and experienced engineers. Detailed steps for the structural IoU-based evaluation are illustrated in Figure 5a, and the corresponding metric is named structural intersection over union (SIoU). First, the images are subdivided into multiple sub-images to reduce the number of structural shear walls in each image and elevate the edge capture precision of the contour detection algorithm. Subsequently, the shear wall elements of each sub-image are extracted based on the HSV color mode, and their contour coordinates are identified by the contour detection API ��OpenCV.findContours (image).�� Then, the total intersection area of the shear walls in the StructGAN design and design by engineers are obtained using the Shapely API ��shapely.geometry.Polygon (coordinates)�� and SIoU is calculated using Equation (7).
|
|
(7) |
where Ainter is the intersection area of the walls in the GAN-synthetic and target designs, Aunion is the union area of the walls in the GAN-synthetic and target designs, Aunion = Atarget + AGAN − Ainter, and Atarget, and AGAN denote the shear wall area of the target design and the GAN design, respectively.
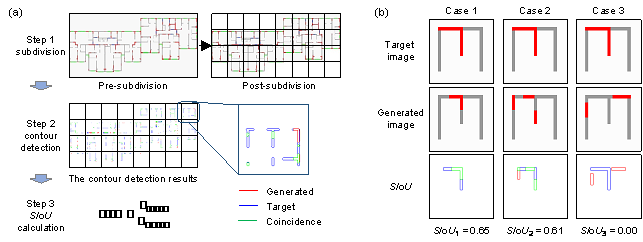
Figure 5 Information on IoU-based evaluation. (a) Detailed steps to get SIoU. (b) Typical cases of SIoU.
The proposed GAN-based structural design methods are yet to be mature, and so are the relevant metrics. Therefore, this study attempts to make some progress by proposing holistic metrics to conduct a more objective and integrated performance evaluation. Inferring from the above studies of single metrics, PA is the traditional pixel-by-pixel evaluation to assess the image quality, which is abandoned because of the failure to comprehend the overall structural layout. Moreover, SIoU, WIoU, and SWratio can only evaluate the confined properties of structural layouts of StructGAN. Hence, by combining the qualities of the generated critical elements in images and structural designs, this study proposed the weighted multi-metric ScoreIoU (Equation (8)) to assess the design performance comprehensively.
|
|
(8) |
where ��SWratio = 1 − |SWratioGAN − SWratiotarget| / SWratioGAN. SWratioGAN, and SWratiotarget are the shear wall ratios of the GAN designs and target designs, respectively. ��SIoU and ��WIoU are the weighted coefficients of SIoU and WIoU, respectively, both equal to 0.5.
For the evaluation of the StructGAN-designed shear wall layouts, WIoU, which reflects the generation quality of the overall walls in images, and SIoU, which reflects the quality of the auto-designed structural shear wall layouts, are equally important. Thus, the weights ��SIoU and ��WIoU are set to 0.5. Moreover, the ��SWratio denotes the correction coefficient for the overall quantity of shear walls. The values of WIoU and SIoU increase with the increment in shear walls, which is unfavorable for the evaluation. Hence, the difference in the total shear wall area between the synthetic image and target image is adopted as the correction coefficient, and a smaller diversity corresponds to a larger ��SWratio.
3.3 StructGAN design
StructGAN is primarily developed for the preliminary schematic design, and partly for structural design development, following the guide in Figure 2. Before StructGAN-based structural design starts, the architectural drawing, seismic design intensity, and structural height should be obtained. The structural design result can be obtained by inputting the semantic architectural drawing into StructGAN. Presently, due to the end-to-end deep learning feature, StructGAN has not yet provided interaction with users, which is different from the conventional generative design tools proposed by Shea et al. [41]. Furthermore, the detailed process of converting the structural plan design into an overall structural analysis model is as follows:
Ÿ Quantitative evaluation of the design images based on ScoreIoU: The structural plan design is first obtained by StructGAN and evaluated by comparison with designs by engineers.
Ÿ Establishment of the corresponding structural analysis models based on the StructGAN designs: The detailed process of converting the bitmap of the shear wall design into a structural analysis model is shown in Appendix A. Based on the structural design model, PKPM can automatically conduct steel reinforcement design according to Chinese design codes [42]. Additionally, related studies on optimization design methods for steel reinforcement [43] can also be integrated into StructGAN in the future to improve StructGAN design capability.
Ÿ Performance analysis of structures: This study used the PKPM software to conduct overall structural design and time-history analyses [42], and then yielded the direct economic loss under the maximum considered earthquake using the FEMA P58 method [23].
Note that, it is also easy and friendly to add new data for training, by adopting the pre-processing method for semantic architectural and structural CAD drawings to create new training data (approximately cost 5-10 min) and then adding them into datasets and training. For further application, corresponding GUI and datasets will be developed.
The StructGAN application results will be elaborated in Section 5 (StructGAN Performance), including 16 structural plan designs and two overall structural designs for shear wall residential buildings. This study ensured no data crossover between the training sets and 16 testing cases for testing reliability. To further evaluate the generalization performance of StructGAN, two overall structural design cases supplied by an architectural design firm were used. These designs were excluded from the training and test sets. Furthermore, these application results will show the StructGAN with a powerful generalization ability for different design conditions.
4 DISCUSSIONS OF NETWORKS AND DATASETS
Based on the proposed StructGAN and its implementation methods, detailed discussions and analyses on the StructGAN were conducted to obtain a high-performance system, whose most critical parts are the GAN algorithm and dataset. Hence, the Discussion section presents the analysis for the selection of GAN algorithm and the corresponding parametric adjustment along with the pre-processing of the datasets, based on the developed performance evaluation methods and metrics.
4.1 GAN algorithm and parametric adjustment
The pix2pix [17] and pix2pixHD [18] algorithms are typical high-performance GAN algorithms. Compared with pix2pix, pix2pixHD is an improved algorithm that can generate high-resolution photo-realistic images with significantly higher computational demands [18]. In the above two algorithms, the characteristic ��structures loss�� can effectively reflect the physical position relationship of pixels in an image [17]. Thus, deduced from the ��structures loss,�� pix2pix and pix2pixHD can capture the potential spatial position distribution of structural layouts. The structural distribution correlation can contribute to establishing a direct map relationship for StructGAN to convert the crucial architectural elements into the corresponding structural layouts. Furthermore, their significant performance in generative architectural design has proved the applicability of pix2pix and pix2pixHD [14,15].
This study compared pix2pix and pix2pixHD with one of the most famous CNN-based image synthesis methods (i.e., UNet), to validate the advantage of pix2pix and pix2pixHD in generative structural design. See the study of Ronneberger et al. [44] for more details of UNet. UNet, pix2pix, and pix2pixHD are all trained to the best state using the same training datasets, and the design results are shown in Figure 6. From the perspectives of objective scoring and subjective judgment, pix2pix and pix2pixHD both perform better than UNet. Moreover, as the UNet design demonstrates, all positions are assigned with shear wall components, which means UNet has not learned the principle of where to assign shear wall and how many shear walls to set. The primary reason is that UNet lacks an adversarial training mechanism, inducing the high-dimensional probability distribution of UNet-synthesized images different from those of target images, and the corresponding structural components design is not consistent. Consequently, this work adopted pix2pix and pix2pixHD as core algorithms for StructGAN.
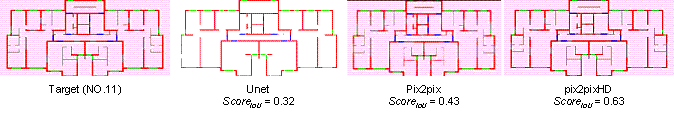
Figure 6 Comparison on structural designs using UNet, pix2pix, and pix2pixHD
As recommended by Isola et al. [17] and Wang et al. [18], the performances of pix2pix and pix2pixHD are influenced by critical parameters; therefore, parametric studies should be conducted. In the pix2pix algorithm, the local features and global clarity of image qualities are primarily determined by the relative values of ��GAN and ��L1 (i.e., ��GAN / ��L1) [17]. In the pix2pixHD algorithm, the vital hyperparameter ��FM affects the overall quality of the generated image by adjusting the proportion of the feature matching loss to the total loss [18]. Furthermore, this work proposed a computer vision-based evaluation method and several metrics such as PA, WIoU, SIoU, and SWratio to pad the blank of the quantitative evaluation method and associated metrics for the structural design quality (Section 3.2). Pixel accuracy (PA) evaluates the overall clarity of the generated image, weighted IoU (WIoU) focuses on assessing the generative qualities of critical elements in images, structural IoU (SIoU) explicitly measures the structural layout consistency between the designs by StructGAN and engineers, and the difference in SWratio estimates the discrepancy of the total structural layout area between two designs. As these metrics show, a high PA, WIoU, and SIoU and low difference in SWratio indicate that the designs by StructGAN and engineers are highly consistent. Subsequently, this study discussed the influence of (��GAN / ��L1) and ��FM based on the proposed evaluations, where ��GAN was fixed as 1, and the Group7-H2 dataset of shear wall residential buildings was adopted.
Figures 7a and 7b show the typical design performance of pix2pix and pix2pixHD with various hyperparameters. When ��L1 = 0, pix2pix loses its control on the global quality of image clarity, causing enormous noise in the generated image. As ��L1 increases, the automated design quality is improved until it becomes stable, with the clarity of image and the structural design rationality improving significantly. In comparison, ��FM only slightly influenced the automated design quality because it mainly affects feature mapping and this study involved the input of architectural semantic images containing few local features. Moreover, quantitative evaluations were conducted to quantify the design qualities of StructGAN with different hyperparameters. As Figures 7c�C7f illustrate, PA, WIoU, and SIoU grow, and the difference in SWratio degrades with increasing ��L1 and ��FM. The evaluation results were consistent with the perceptual results in Figures 7a and 7b, revealing that these methods and metrics are reasonable and applicable. Furthermore, both the image generation and structural design qualities of pix2pixHD are significantly better than those of pix2pix, with small design dispersion and high stability. The WIoU and SIoU of the pix2pixHD design with the optimal parameters both exceed 0.5, indicating that the structural layout is very reasonable. The total amount of structural shear walls designed by StructGAN is comparable to those designed by competent engineers, with a difference in SWratio smaller than 15%. Consequently, the evaluation results show that the designs by StructGAN equipped with pix2pixHD coincide well with designs by engineers, with high stability. Meanwhile, the performance of pix2pix still needs to be enhanced in future studies. Based on the discussions and recommendations by Wang et al. [18], StructGAN adopts pix2pixHD, with ��FM = 10.
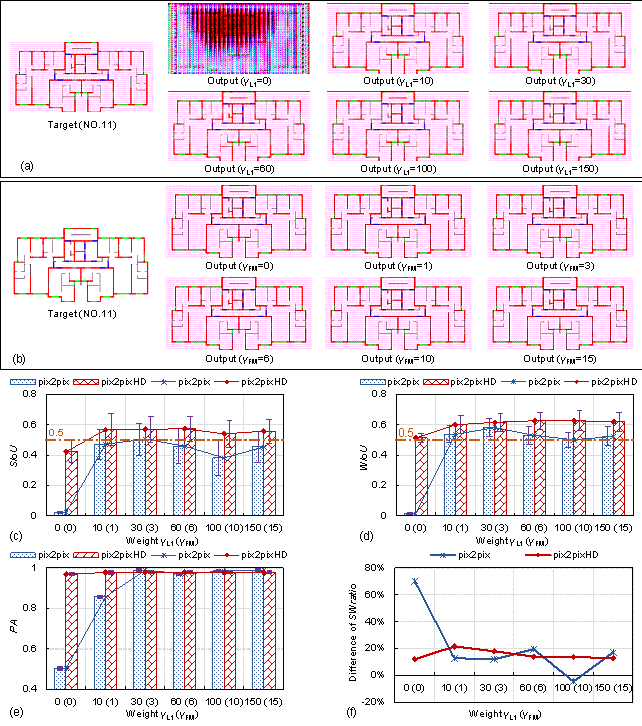
Figure 7 Analyses of the hyperparameters and quantification of testing results for different GAN algorithms with various parameters. (a) Comparison of the pix2pix-generated images with different parameters. (b) Comparison of the pix2pixHD-generated images with different parameters. (c)�C(f), Comparisons of SIoU, WIoU, PA, and the difference in SWratio between pix2pix and pix2pixHD with various parameters. The evaluation results show that the designs by StructGAN equipped with pix2pixHD coincide well with those by engineers, with high stability. However, the performance of pix2pix needs further enhancement in future studies.
4.2 Datasets analysis
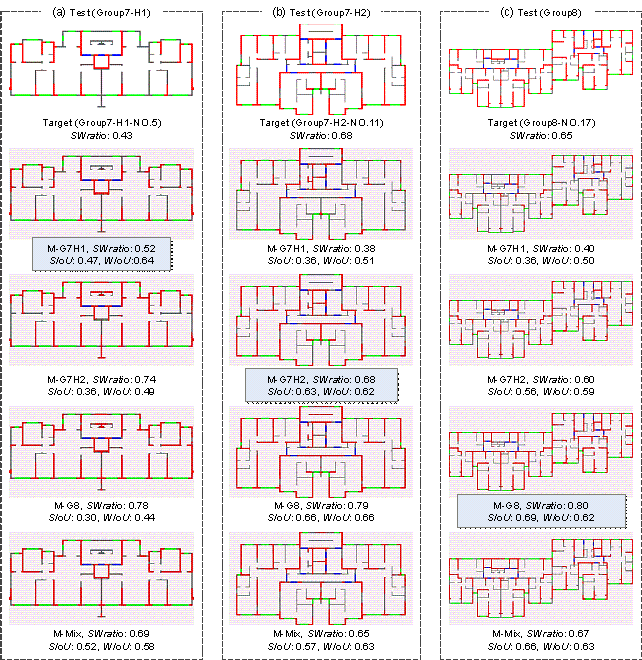
Figure 8 Typical automated designs by different trained StructGAN models. (a) Testing groups of Group7-H1 (b) Testing groups of Group7-H2 (c) Testing groups of Group8.
The maximum likelihood estimation is the basis of GAN algorithms [13], making the probability distribution of designs and design quality closely related to the datasets; hence, this study discussed the influence induced by datasets under different design conditions. Building heights and seismic design intensities were adopted as the classification criteria of the datasets because they are the critical factors that determine the mechanical performance of building structures. Higher heights and seismic design intensities correspond to increased requirements for structural components [8]. Notably, utilizing mixed design datasets with different heights and seismic design intensities for training, the final probability distributions of the automated designs were consistent with the average probability distribution of the mixed data, which cannot satisfy the demand for different design conditions. Therefore, datasets were divided into Group7-H1 (seismic design intensity = 7-degree, and height �� 50 m), Group7-H2 (seismic design intensity = 7-degree, and height > 50 m), and Group8 (seismic design intensity = 8-degree). In addition, for contrast, Group Mix (mixed dataset) was composed of various data.
Based on different training sets, this work obtained the GAN models called M-G7H1, M-G7H2, M-G8, and M-Mix. Subsequently, the testing sets of Group7-H1, Group7-H2, and Group8 were adopted to evaluate the design quality of the trained models. The testing results in Figure 8 indicate that the best designs for the testing sets of Group7-H1, Group7-H2, and Group8 were produced by M-G7H1, M-G7H2, and M-G8, respectively, and the corresponding quantitative evaluation results are shown with blue backgrounds. Specifically, in the designs of Figure 8, the best designs by StructGAN are highly consistent with the designs by experienced engineers, with the positions and lengths of structural shear walls highly comparable. SIoU and WIoU are higher than 0.5, and the SWratios of StrutGAN designs are close to those of designs by engineers, indicating that the qualities of structural layouts are excellent. Overall, when the test design conditions match the training structural design conditions, both the layouts and total numbers of the structural shear walls designed by StructGAN are comparable to those in the designs by competent engineers.
Table 4 Quantitative evaluation results for all automated designs by different trained StructGAN models for testing groups of Group7-H1, Group7-H2, and Group8.
|
Testing sets |
SIoU |
WIoU |
||||||||||||||
|
M-G7H1 |
M-G7H2 |
M-G8 |
M-Mix |
M-G7H1 |
M-G7H2 |
M-G8 |
M-Mix |
|||||||||
|
T-G7H1 |
0.41 |
0.46 |
0.44 |
0.52 |
0.59 |
0.55 |
0.47 |
0.57 |
||||||||
|
T-G7H2 |
0.38 |
0.58 |
0.62 |
0.57 |
0.53 |
0.63 |
0.61 |
0.63 |
||||||||
|
T-G8 |
0.37 |
0.60 |
0.74 |
0.67 |
0.51 |
0.62 |
0.72 |
0.64 |
||||||||
|
Testing sets |
SWratiotarget |
M-G7H1 |
M-G7H2 |
M-G8 |
M-Mix |
|||||||||||
|
SWratioGAN |
1 − hSWratio |
SWratioGAN |
1 − hSWratio |
SWratioGAN |
1 − hSWratio |
SWratioGAN |
1 − hSWratio |
|||||||||
|
T-G7H1 |
0.41 |
0.50 |
20% |
0.69 |
41% |
0.80 |
49% |
0.65 |
37% |
|||||||
|
T-G7H2 |
0.58 |
0.44 |
35% |
0.66 |
14% |
0.74 |
23% |
0.64 |
12% |
|||||||
|
T-G8 |
0.66 |
0.43 |
59% |
0.67 |
14% |
0.76 |
13% |
0.71 |
9% |
|||||||
|
Testing sets |
ScoreIoU |
|||||||||||||||
|
M-G7H1 |
M-G7H2 |
M-G8 |
M-Mix |
|||||||||||||
|
T-G7H1 |
0.40 |
0.31 |
0.24 |
0.35 |
||||||||||||
|
T-G7H2 |
0.30 |
0.52 |
0.48 |
0.53 |
||||||||||||
|
T-G8 |
0.18 |
0.53 |
0.65 |
0.61 |
||||||||||||
The most critical metric is ScoreIoU, with value > 0.5 denoting excellent quality. ScoreIoU = hSWratio �� (hSIoU �� SIoU + hWIoU �� WIoU); hSWratio = 1 − |SWratioGAN − SWratiotarget| / SWratioGAN; hSIoU = hWIoU = 0.5.
Additionally, the quantitative evaluation results for all structural designs are shown in Table 4, indicating that the best designs were devised by the StructGAN trained under the consistent design conditions, with the largest corresponding ScoreIoU. In addition, the design qualities of the adequately trained StructGAN under different design conditions are relatively stable, with their ScoreIoU > 0.5. Hence, the training datasets for StructGAN should be classified based on design conditions, and the design conditions of the adopted StructGAN should be matched with those of architectural sketches in a structural design application. In contrast, the designs by StructGAN with unmatched design conditions are irrational. The layouts and length of the structural shear walls in the designs by StructGAN are inconsistent with those in the designs by competent engineers, as shown in Figure 8. Furthermore, the designs developed by M-Mix are close to the average of mixed designs, not precisely satisfying the demands of different design conditions. Consequently, refined design conditions-based data classification narrows the restriction of the maximum likelihood estimation and further improves the precision performance of StructGAN. Meanwhile, the design quality evaluation results confirmed the precise and stable design performance of StructGAN.
5 STRUCTGAN PERFORMANCE
This study validated the efficiency and accuracy of the proposed StructGAN framework via discussions and analyses. The excellent design performance was obtained through the optimal algorithm, the most applicable hyperparameters, the proposed dataset split method, and rational evaluation methods. This section further demonstrates the superior performance of StructGAN by comparing it against the structural designs of competent engineers.
Specifically, in the StructGAN application, the semanticization of architectural drawings requires approximately 9 min, and then the semantic drawings are input into StructGAN to generate the corresponding structural layout design, which takes approximately 30 s. Compared with the design of experienced engineers, adopting StructGAN for preliminary structural design can reduce the time consumption from 3.5 h to 10 min. Additionally, StructGAN can also improve the efficiency of the overall structural design. As an estimation of this study, time consumption can be reduced from 300 h to 30 h with ten times efficiency enhancement. Furthermore, standardizing the semanticization process of architectural drawings can shorten the time of preliminary structural design to 3 min, with higher overall design efficiency. StructGAN accelerates the entire structural design process by a factor of 10, which is equivalent to a saving of approximately 100 million USD per annum in the industry, according to the statistical estimation of this work. See Appendix B. [23] for additional estimation information.
In addition to design efficiency and economics, design quality is equally critical. The comparison is performed on the drawings first, followed by an evaluation of the structural behavior. Two approaches based on computer vision and engineer perception were developed to support a comprehensive assessment. Subsequently, two overall structural designs by StructGAN and engineers are compared to show that the StructGAN designs are not only safe but also economical. The observations of similar material takeoffs and seismic resilience suggest that the structural design by StructGAN is as great as those optimized by competent engineers.
5.1 Plan drawing design performance
In total, 16 structural design drawings by StructGAN and engineers were compared. Figure 9a illustrates four typical structural plan designs for shear wall residential buildings, depicting the high consistency between the designs by StructGAN and experienced engineers.
The computer-vision-based evaluation was performed first. The quality evaluation results of structural designs by StructGAN are shown in Figure 9b. The metric ScoreIoU considers the comprehensive performance of structural design and image generation. The consistency measurement basis for ScoreIoU is the IoU, which denotes the ratio of the intersection area to the union area of structural designs by StructGAN and engineers. Previous studies indicated that an IoU > 0.5 corresponds to a high consistency [45-47]. Moreover, in the comparative study of structural plan layouts, 16 buildings were adopted as cases and divided into two groups according to their different design conditions. Thus, the ScoreIoU in Figure 9b is the average of each group, and it is higher than 0.5, indicating that the structural designs by StructGAN are comparable to those by experienced engineers and are outstanding.
Furthermore, engineers were also invited to judge the ��AI�� or ��Engineer�� of designs and assess the rationality of StructGAN designs based on their straightforward perception. In the ��AI�� or ��Engineer�� judgment, engineers need to figure out the ones designed by StructGAN, and the judgment score is SEP-1. Simultaneously, in the design rationality assessment, the rationality score is SEP-2. This study invited 11 senior experts (work experience > 15 years), 12 practicing engineers, and graduate students to participate in the judgment and evaluation work. Two important conclusions can be drawn from the results shown in Figure 9c. (1) Approximately 30% of the StructGAN designs were appraised as designs by engineers, with the corresponding SEP-1 equal to 30%, which is notably better than the highest Amazon Mechanical Turk (AMT) test result of 22.5% in the pix2pix study [17]. The above result indicates that it was challenging for humans to distinguish the designs by engineers and StructGAN accurately. (2) The difference in rationality quantification for structural shear wall design between the StructGAN and engineers was approximately 12%, confirming that the StructGAN structural designs were excellent and highly accepted by engineers.
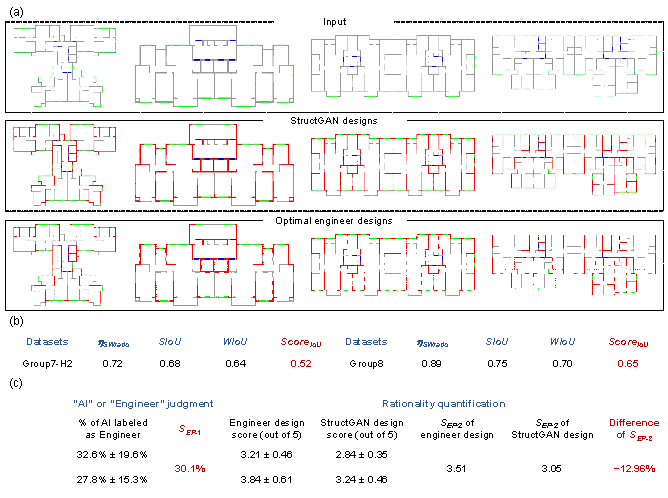
Figure 9 Evaluation results of the optimal StructGAN. (a) Typical structural designs by StructGAN (red, gray, blue, and green denote structural shear wall, nonstructural infill wall, indoor windows, and outdoor gates, respectively). (b) Computer vision-based evaluation results (ScoreIoU = ��SWratio �� (��SIoU �� SIoU + ��WIoU �� WIoU); ��SWratio = 1 − |SWratioGAN − SWratiotarget| / SWratioGAN; ��SIoU = ��WIoU = 0.5). (c) Engineer perception-based evaluation results, including ��AI�� or ��Engineer�� judgment and rationality quantification.
Additionally, the architectural layouts of the 16 buildings are completely different, with seismic design intensities of 7-degree and 8-degree, and heights of 28�C140 m. The 16 cases were subdivided into groups of Group7-H2 and Group8, where Group7-H2 denotes buildings designed under 7-degree seismic intensity and heights over 50 m, and Group8 denotes buildings designed under 8-degree seismic intensity. Notably, the corresponding peak ground acceleration (PGA) values of the design basis earthquake (i.e., 10% probability of exceedance in 50 years) are 100 cm/s2 and 200 cm/s2 in the 7-degree and 8-degree seismic intensity zones, respectively.
5.2 Overall structural design performance
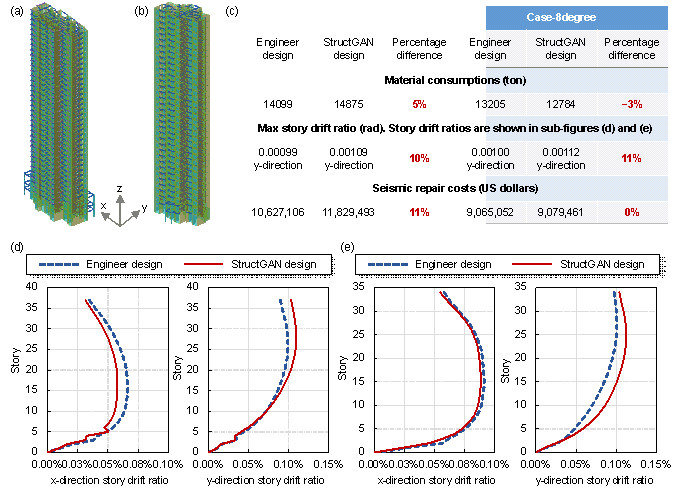
Figure 10 Comparisons between the StructGAN designs and designs by engineers. The two cases are named Case-7degree and Case-8degree, with heights of approximately 100 m and seismic design intensities of 7-degree and 8-degree, respectively. (a) 3D view of Case-7degree. (b) 3D view of Case-8degree. (c) Comparisons of overall performance in Case-7degree and Case-8degree. (d) Comparisons of story drift ratios in Case-7degree. (e) Comparisons of story drift ratios in Case-8degree.
Subsequently, two overall structural designs by StructGAN and engineers were compared. The safety and economic properties are directly associated with seismic deformation and material consumption, respectively. Adopting StructGAN, this study developed two structural designs following the guide in Figure 1, and then compared their safety and economic properties with those of the designs by competent engineers. The two buildings are shown in Figures 10a and 10b.
First, structural safety is primarily evaluated by the seismic story drift ratio because excessive story deformation under an earthquake can induce damage to structural components and facilities and even cause a large number of casualties. Hence, ensuring that the seismic deformation of buildings satisfies the specifications is essential in the overall structural design. The comparisons of seismic story drift ratios for two buildings are shown in Figures 10d and 10e. As depicted in the figures, the maximum seismic deformation of the StructGAN design is only 11% larger than that of the design by engineers, which is perfectly acceptable in the preliminary design and meets the safety requirements. Subsequently, this work compared the StructGAN designs and designs by engineers with respect to material consumption, and the results are shown in Figure 10c. The maximum percentage difference is within 5% in the two cases, indicating that the automated designs consume almost the same amount of materials as manual designs and fully meet the economic requirements. Additionally, the seismic repair costs of the StructGAN designs and designs by engineers are comparable, as illustrated in Figure 10c. It is worth noting that, the seismic repair cost is calculated based on the FEMA P-58 method [23], where it is determined by the story drift ratio, the story floor acceleration response, and the fragility of the structural components. Hence, in Case-8degree, the phenomenon that the percentage difference of story drift ratio is 10% while that of seismic repair cost is 0% is rational [48].
Consequently, the economic and safety differences in the structural designs by StructGAN and experienced engineers are relatively slight, and the StructGAN design meets the requirements of high efficiency and high quality in the preliminary structural design. Presently, the structural mechanics performance of StructGAN-generated preliminary design is not as excellent as that of engineers-optimized design. However, it is believed that the preliminary design by StructGAN would be a great starting point for the follow-up optimization. Moreover, the efficiency of the StructGAN design is nearly 10 to 20 times higher than that of qualified engineers. Hence, it is promising that the combination of StructGAN and automated optimization methods [49-51] can both improve the design efficiency and quality in the future.
6 CONCLUSIONS
A GAN-based method for the structural design of high-rise shear wall residential buildings (i.e., StructGAN) was proposed in this study, mastering the direct map relationship for converting critical architectural elements into the corresponding structural designs. Moreover, a reasonable evaluation system and the corresponding metrics were developed and adopted in the discussions and analyses of GAN algorithms and datasets, enhancing the learning and design performance of StructGAN. The outstanding StructGAN provides preliminary structural design schemes for architects and structural engineers, improving the design efficiency and quality of building structures. The conclusions drawn are as follows:
1. Semantic designs can reduce the probability distribution dimension of the StructGAN training dataset and enhance its study performance. Dataset classification by building heights and seismic design intensities can narrow the restriction of the maximum likelihood estimation, improving the precision of generative designs by StructGAN.
2. pix2pixHD (��FM = 10) is recommended for StructGAN owing to its high-quality design capability with high efficiency and stability. An appropriate simplification of the generative network architecture of pix2pixHD is beneficial for further enhancing the design precision of StructGAN.
3. Computer vision-based and engineering-perception-based evaluation methods were developed and adopted in this study. The computer vision-based evaluation quantifies and confirms the design quality of StructGAN, and the engineer perception-based evaluation indicates that engineers highly accept the StructGAN designs.
Notably, this study is the first to propose a GAN-aided structural design method by establishing the complicated fuzzy map relationship for converting semantic architectural sketches into structural layouts, which can also be an automated design basis for other structural systems, bridges, and tunnels. Moreover, as the design data and GAN capability increase, the design performance of StructGAN is continuously enhanced.
ACKNOWLEDGMENTS
REFERENCES
[1] A. Chakrabarti, K. Shea, R.B. Stone, J. Cagan, M.I. Campbell, N.V. Hernandez, et al., Computer-based design synthesis research: An overview. J. Comput. Inf. Sci. Eng., 11 (2011) 021003. https://doi.org/10.1115/1.3593409
[2] S. Ahmed, M. Weber, M. Liwicki, C. Langenhan, A. Dengel, F. Petzold, Automatic analysis and sketch-based retrieval of architectural floor plans, Pattern Recognit. Lett., 35 (2014) 91-100. https://doi.org/10.1016/j.patrec.2013.04.005
[3] N.C. Brown, C. Mueller, Design for structural and energy performance of long span buildings using geometric multi-objective optimization, Energy Build., 127 (2016) 748-761. https://doi.org/10.1016/j.enbuild.2016.05.090
[4] C.M. Herr, R.C. Ford, Cellular automata in architectural design: From generic systems to specific design tools. Autom. Constr., 72 (2016) 39-45. https://doi.org/10.1016/j.autcon.2016.07.005
[5] S. Tafraout, N. Bourahla, Y. Bourahla, A. Mebarki, Automatic structural design of RC wall-slab buildings using a genetic algorithm with application in BIM environment. Autom. Constr., 106 (2019) 102901. https://doi.org/10.1016/j.autcon.2019.102901
[6] CTBUH, Tall buildings in 2019: Another record year for supertall completions, CTBUH Research, (2019). https://www.skyscrapercenter.com/research/CTBUH_ResearchReport_2019YearInReview.pdf
[7] R. Perez, A. Carballal, J.R. Rabuñal, M.D. Garc��a-Vidaurr��zaga, O.A. Mures, Using AI to simulate urban vertical growth, CTBUH Journal, Issue III (2019). https://global.ctbuh.org/resources/papers/download/4212-using-ai-to-simulate-urban-vertical-growth.pdf
[8] Q.X. Shi, X.W. Liang, Design of tall building structures (second Edition), Science Press, (2012). (in Chinese)
[9] H. Zhang, T. Xu, H. Li, S. Zhang, X. Wang, X. Huang, et al., Stackgan++: Realistic image synthesis with stacked generative adversarial networks, IEEE Trans. Pattern Anal. Mach. Intell., 41 (2018), 1947-1962. https://ieeexplore.ieee.org/abstract/document/8411144
[10] X.Z. Lu, W.J. Liao, W. Huang, Y. Xu, X.Y. Chen, An improved linear quadratic regulator control method through convolutional neural network-based vibration identification, J. Vib. Control, (2020) 1077546320933756. https://doi.org/10.1177/1077546320933756
[11] C. Xiong, Q.S. Li, X.Z. Lu, Automated regional seismic damage assessment of buildings using an unmanned aerial vehicle and a convolutional neural network. Autom. Constr., 109 (2020) 102994. https://doi.org/10.1016/j.autcon.2019.102994
[12] Y.J. Xu, X.Z. Lu, B. Cetiner, E. Taciroglu, Real�\time regional seismic damage assessment framework based on long short�\term memory neural network, Comput.-Aided Civil Infrastruct. Eng., (2020). https://doi.org/10.1111/mice.12628
[13] I.J. Goodfellow, J. Pouget-Abadie, M. Mirza, B. Xu, D. Warde-Farley, S. Ozair, et al. Generative adversarial networks, (2014). arXiv preprint arXiv:1406.2661. https://arxiv.org/abs/1406.2661
[14] H. Zheng, W.X. Huang, Architectural drawings recognition and generation through machine learning, In Association for Computer Aided Design in Architecture 2018, (2018). http://papers.cumincad.org/data/works/att/acadia18_156.pdf
[15] S. Chaillou, ArchiGAN: a generative stack for apartment building design, (2019). https://devblogs.nvidia.com/archigan-generative-stack-apartment-building-design/?linkId=70968833
[16] N. Nauata, K. Chang, C. Cheng, G. Mori, Y. Furukawa, House-GAN: relational generative adversarial networks for graph-constrained house layout generation, European Conference on Computer Vision, (2020) 162-177. https://doi.org/10.1007/978-3-030-58452-8_10
[17] P. Isola, J.Y. Zhu, T. Zhou, A.A. Efros, Image-to-image translation with conditional adversarial networks, IEEE Conference on Computer Vision and Pattern Recognition, (2017) 1125-1134. https://openaccess.thecvf.com/content_cvpr_2017/papers/Isola_Image-To-Image_Translation_With_CVPR_2017_paper.pdf
[18] T.C. Wang, M.Y. Liu, J.Y. Zhu, A. Tao, J. Kautz, B. Catanzaro, High-resolution image synthesis and semantic manipulation with conditional GANs, IEEE Conference on Computer Vision and Pattern Recognition, (2018) 8798-8807. https://openaccess.thecvf.com/content_cvpr_2018/papers/Wang_High-Resolution_Image_Synthesis_CVPR_2018_paper.pdf
[19] M. M. Ivashkov, ACCEL: a tool for supporting concept generation in the early design phase, [Doctoral dissertation, Technische Universiteit Eindhoven], 2004. http://citeseerx.ist.psu.edu/viewdoc/download?doi=10.1.1.122.8104&rep=rep1&type=pdf
[20] McKinsey & Company, The next normal in construction, 2020. https://www.mckinsey.com/business-functions/operations/our-insights/the-next-normal-in-construction-how-disruption-is-reshaping-the-worlds-largest-ecosystem#
[21] H. Rezatofighi, N. Tsoi, J. Gwak, A. Sadeghian, I. Reid, S. Savarese, Generalized intersection over union: A metric and a loss for bounding box regression, Computer Vision and Pattern Recognition, (2019) 658-666. https://openaccess.thecvf.com/content_CVPR_2019/papers/Rezatofighi_Generalized_Intersection_Over_Union_A_Metric_and_a_Loss_for_CVPR_2019_paper.pdf
[22] A. Chakrabarti, S. Morgenstern, H. Knaab, Identification and application of requirements and their impact on the design process: a protocol study, Research in Engineering Design, 15 (2004) 22-39. https://link.springer.com/article/10.1007%2Fs00163-003-0033-5
[23] FEMA, FEMA P-58-1, Seismic Performance Assessment of Buildings, Volume 1 �C Methodology, Second Edition, California, 2018.
[24] M. Oh, J. Lee, S. W. Hong, Y. Jeong. Integrated system for BIM-based collaborative design. Autom. Constr., 58 (2015), 196-206. https://doi.org/10.1016/j.autcon.2015.07.015
[25] GB50011-2010, Code for seismic design of buildings, China Architecture & Building Press, Beijing, 2010. (in Chinese)
[26] JGJ3-2010, Technical specification for concrete structures of tall building, China Architecture & Building Press, Beijing, 2010. (in Chinese)
[27] J.T. Springenberg, Unsupervised and semi-supervised learning with categorical generative adversarial networks, (2015). https://arxiv.org/abs/1511.06390
[28] T. Salimans, I. Goodfellow, W. Zaremba, V. Cheung, A. Radford, X. Chen, Improved techniques for training GANs, Advances in Neural Information Processing Systems, (2016) 2234-2242. https://arxiv.org/abs/1606.03498
[29] X. Wang, A. Gupta, Generative image modeling using style and structure adversarial networks, European Conference on Computer Vision, (2016) 318-335. https://link.springer.com/chapter/10.1007/978-3-319-46493-0_20
[30] R. Zhang, P. Isola, A.A. Efros, Colorful image colorization. European Conference on Computer Vision, (2016) 649-666. https://link.springer.com/chapter/10.1007/978-3-319-46487-9_40
[31] J.Y. Zhu, T. Park, P. Isola, A.A. Efros, Unpaired image-to-image translation using cycle-consistent adversarial networks, IEEE International Conference on Computer Vision, (2017) 2223-2232. https://openaccess.thecvf.com/content_ICCV_2017/papers/Zhu_Unpaired_Image-To-Image_Translation_ICCV_2017_paper.pdf
[32] J. Long, E. Shelhamer, T. Darrell, Fully convolutional networks for semantic segmentation, IEEE Conference on Computer Vision and Pattern Recognition, (2015) 3431-3440. https://openaccess.thecvf.com/content_cvpr_2015/papers/Long_Fully_Convolutional_Networks_2015_CVPR_paper.pdf
[33] A. Garcia-Garcia, S. Orts-Escolano, S. Oprea, V. Villena-Martinez, J. Garcia-Rodriguez, A review on deep learning techniques applied to semantic segmentation, (2017). https://arxiv.org/abs/1704.06857
[34] W. Liu, D. Anguelov, D. Erhan, C. Szegedy, S. Reed, C.Y. Fu, A.C. Berg, SSD: Single shot multibox detector, European Conference on Computer Vision, (2016) 21-37. https://link.springer.com/chapter/10.1007/978-3-319-46448-0_2
[35] R. Girshick, Fast R-CNN. IEEE International Conference on Computer Vision, (2015) 1440-1448. https://openaccess.thecvf.com/content_iccv_2015/papers/Girshick_Fast_R-CNN_ICCV_2015_paper.pdf
[36] J. Redmon, S. Divvala, R. Girshick, A. Farhadi, You only look once: Unified, real-time object detection, IEEE Conference on Computer Vision and Pattern Recognition, (2016) 779-788. https://www.cv-foundation.org/openaccess/content_cvpr_2016/papers/Redmon_You_Only_Look_CVPR_2016_paper.pdf
[37] J. Gui, Z. Sun, Y. Wen, D. Tao, J. Ye, A review on generative adversarial networks: Algorithms, theory, and applications, (2020). https://arxiv.org/abs/2001.06937
[38] D. Diakoulaki, G. Mavrotas, L. Papayannakis, Determining objective weights in multiple criteria problems: the critic method, Comput. Oper. Res., 22 (1995) 763-770. https://doi.org/10.1016/0305-0548(94)00059-H
[39] G.M. Foody, Status of land cover classification accuracy assessment, Remote Sens. Environ., 80 (2002) 185-201. https://doi.org/10.1016/S0034-4257(01)00295-4
[40] A. Rosebrock, Practical python and openCV: An introductory, example driven guide to image processing and computer vision (3rd Edition), Pyimagesearch, 2016. https://www.pyimagesearch.com/practicalpython-opencv/.
[41] K. Shea, R. Aish, M. Gourtovaia, Towards integrated performance-driven generative design tools. Autom. Constr., 14(2005), 253-264. https://doi.org/10.1016/j.autcon.2004.07.002
[42] PKPM, Software manual-structural analysis and design software for multistory and high-rise buildings SATWE, Beijing Glory PKPM Technology Co., Ltd, 2020. (in Chinese)
[43] M. Mangal, J. C. Cheng, Automated optimization of steel reinforcement in RC building frames using building information modeling and hybrid genetic algorithm. Autom. Constr., 90(2018), 39-57. https://doi.org/10.1016/j.autcon.2018.01.013
[44] O. Ronneberger, P. Fischer, T. Brox, U-net: Convolutional networks for biomedical image segmentation. In International Conference on Medical image computing and computer-assisted intervention, Springer, Cham, (2015) 234-241. https://link.springer.com/chapter/10.1007/978-3-319-24574-4_28
[45] M. Everingham, L. Van Gool, C.K. Williams, J. Winn, A. Zisserman, The pascal visual object classes (VOC) challenge, Int. J. Comput. Vis., 88 (2010) 303-338. https://link.springer.com/article/10.1007%252Fs11263-009-0275-4
[46] M. Everingham, S. A. Eslami, L. Van Gool, C. K. Williams, J. Winn, A. Zisserman, The pascal visual object classes challenge: A retrospective. International journal of computer vision, 111(2015), 98-136. https://link.springer.com/article/10.1007%252Fs11263-014-0733-5
[47] H. Rezatofighi, N. Tsoi, J. Gwak, A. Sadeghian, I. Reid, S. Savarese, Generalized intersection over union: A metric and a loss for bounding box regression. In Proceedings of the IEEE/CVF Conference on Computer Vision and Pattern Recognition, (2019), 658-666. https://openaccess.thecvf.com/content_CVPR_2019/papers/Rezatofighi_Generalized_Intersection_Over_Union_A_Metric_and_a_Loss_for_CVPR_2019_paper.pdf
[48] X. Lu, H. Guan, Comparison of seismic design and resilience of tall buildings based on Chinese and US design codes. In Earthquake Disaster Simulation of Civil Infrastructures, Springer, Singapore, (2021) 171-222. https://link.springer.com/chapter/10.1007/978-981-15-9532-5_4
[49] M. Fragiadakis, N. D. Lagaros, An overview to structural seismic design optimisation frameworks. Computers & Structures, 89(2011), 1155-1165. https://doi.org/10.1016/j.compstruc.2010.10.021
[50] G. S. Papavasileiou, D. C. Charmpis, Seismic design optimization of multi�Cstorey steel�Cconcrete composite buildings. Computers & Structures, 170(2016), 49-61. https://doi.org/10.1016/j.compstruc.2016.03.010
[51] S. A. Mirfarhadi, H. E. Estekanchi, M. Sarcheshmehpour, On optimal proportions of structural member cross-sections to achieve best seismic performance using value based seismic design approach. Engineering Structures, 231(2021), 111751. https://doi.org/10.1016/j.engstruct.2020.111751
[52] J. Lim, P. Janssen, R. Stouffs, Automated generation of BIM models from 2D CAD drawings. Proceedings of the 23rd CAADRIA Conference, Beijing, China, (2018) 61-70.
APPENDIX A. Extension of the structural plane design to the overall structural design
Step1: The bitmap of the shear wall design was attached to the AutoCAD drawing of the original architectural design using the attach function in AutoCAD.
Step2: The coordinates and length of the StructGAN-designed shear walls are obtained using the dimension function in AutoCAD.
Step3: The structural analysis model is established based on the original structural model and the shear wall coordinates obtained in Step 2 using the PKPM software.
Step4: The following principles are adopted for establishing the structural analysis model. In the event that certain pixels of the auto-designed shear wall are missing, the shear wall is considered continuous if pixels of the shear wall exist within that length. Shear walls with a length shorter than the wall thickness (i.e., 200 mm) are excluded. Only the shear wall length of the structural design of the StructGAN is adjusted without altering any other properties, such as the section thickness and material properties, to maintain a better comparison of the designs of the StructGAN and engineered design. After the shortening (or extension) of the shear wall length, the connected beams are extended (or shortened) to maintain the completeness of the structural analysis model.
Note that, this study adopted the semi-automated modeler module to guarantee the generated structural analysis model reliable. Moreover, the StructGAN modeler module is ready to be improved by adopting the existing method of 3D model generation from 2D drawings [52].
APPENDIX B. Potential profit from StructGAN
Approximately $265 billion annual profit pool awaits disrupters in the construction industry, according to McKinsey [20]. The total cost of architectural design accounts for approximately 2.5% of the entire construction cost, and the preliminary design accounts for approximately 5% of the architectural design cost. StructGAN accelerates the design process and reduces the time consumption by approximately 1/3. Hence, the potential profit created by StructGAN equals 110 million USD (= 265 billion �� 2.5% �� 5% �� 33.3%).
APPENDIX C. Data availability statement
The structural design datasets are collected from architectural design and research institutes in China. The dataset and all codes for this study are available on the authors�� GitHub page (https://github.com/wenjie-liao/StructGAN_v1). The adopted computer hardware information: 6-core Intel Xeon CPU E5-2620, 32 GB memory, NVIDIA GeForce GTX TITAN X (12 GB memory). The main software information: Windows 10, Python 3.6 with Pytorch 1.5, pix2pixHD algorithm[18]. All inquiries regarding this content should be directed to the corresponding author.