1. Introduction
Intelligent construction promotes the transformation of engineering construction, in which intelligent generative design is a critical component. Presently, intelligent design methods have made some progress in solving the problems as 1) inefficient communication between architects and structural engineers, 2) slow iterative structural design, and 3) high dependence on engineers�� experience (Liao et al., 2021; Ivashkov, 2004; McKinsey & Company, 2021). However, existing generative design methods can only learn from design drawings and cannot meet both code requirements and architectural image guidance (Liao et al., 2021). It is challenging to prescribe programmable design criteria and let computers understand the literal information in the drawings and the underlying structural principles, let alone learning from the more abstract engineering experience. Hence, the future development focus on implicit rules learning ability from multimodal text and image data and the corresponding design generation capability.
Currently, automated building design methods mainly include evolutionary algorithms, topology optimization, swarm intelligence, etc. (Huang & Xie, 2010; Lagaros & Papadrakakis, 2012; Mangal & Cheng, 2018; Tafraout et al., 2019; Zhang & Mueller, 2017). The aforementioned methods promote automatic building designs; however, they cannot learn the potential design rules from existing building designs. In recent years, fast-growing deep learning and reinforcement learning methods have performed well in experiential learning, knowledge fusion, and generation, such as convolutional neural networks (CNNs) and generative adversarial networks (GANs) (Pan & Yang, 2020; Sun et al., 2021; Lu et al., 2021; Chen et al., 2021). Generative adversarial networks (GANs) are the most popular methods for image synthesis and intelligent design (Isola et al., 2017; Zhu et al., 2017; Zhang et al., 2017; Wang et al., 2018; Zhang et al., 2019; Karras et al., 2019; Babu & Dubey, 2021; Li et al., 2020; Liu et al., 2020). Based on the adversarial training mechanism of neural networks and the principle of the generation following a uniform probability distribution, GAN generates excellent and reliable outcomes (Goodfellow et al., 2014). For instance, Liao et al. (2021) proposed StructGAN to conduct an automated generative design for shear wall building structures. Oh et al. (2019), Shu et al. (2019), and Sim et al. (2021) performed GAN-based structural topology designs. Moreover, Huang and Zheng (2018), Chaillou (2019), and Nauata et al. (2020) carried out architectural designs using different GAN methods.
However, most GAN-based design methods generate corresponding designs through image input, which is challenging to generate designs that meet the requirements of text-image guidance at the same time. Li et al. (2020) and Liu et al. (2020) proposed text-guided image generation and adjustment methods; however, their training requires approximately hundreds of thousands of data. It is worth noting that building structural design is highly personalized, and no open-source structural design database is available, leading to the dataset of building structural designs relatively limited (e.g., shear wall structural design datasets size is below 500). Therefore, the methods proposed by Li et al. (2020) and Liu et al. (2020) cannot be directly utilized in the design of building structures, due to a limited number of data. It is necessary to propose a building structural design method with few-shot learning, which fuses design text and image features to generate a structural design that meets text-image guidance. In addition to building structural designs, a limited dataset is common in various other problems due to the unique characteristics of the objects. Therefore, this study is potentially applicable to other problems.
Based on pix2pixHD (Wang et al., 2018), this study developed novel neural networks for text encoding and feature extraction and fusion, and then embedded the networks into the pix2pixHD. A new GAN-based fused-image-text-to-image generative design method was developed, called ��TxtImg2Img��, which generates images based on the simultaneous text and image input. Section 2 elaborates the neural network architecture of TxtImg2Img. Section 3 introduces the application process of the TxtImg2Img-based shear wall structural design. Section 4 discusses the network architecture and hyperparameters of TxtImg2Img. Section 5 shows the performance of the shear wall structural design as well as those of the other designs that adopted TxtImg2Img. Finally, Section 6 presents the conclusions of the study.
2. TxtImg2Img-based Generative Design Method
TxtImg2Img is a novel generative design method. It encodes text and images simultaneously, extracts and merges features, and generates corresponding designs (Figure 1). The structural design by TxtImg2Img satisfies the text-image guidance and simultaneously allows the input of property text and semantic drawings. Moreover, this method can generate satisfactory designs after learning from a limited number of design samples.
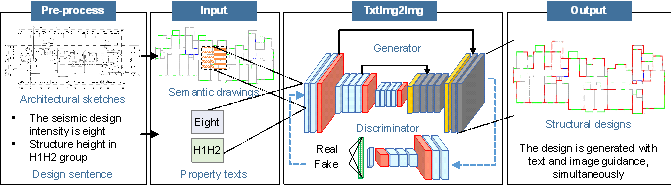
Figure 1. TxtImg2Img. A generative designed method with text and image input simultaneously.
2.1 Related work
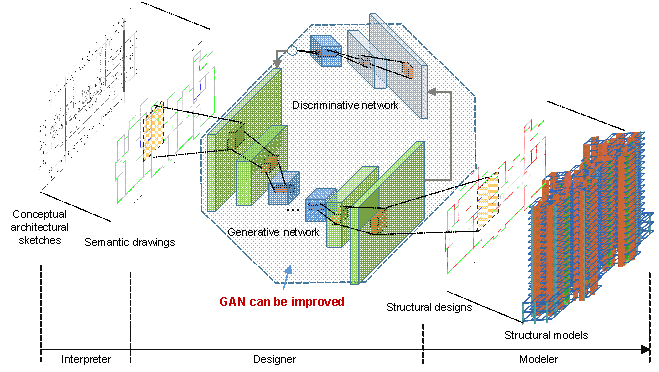
Figure 2. StructGAN. A GAN-based automated shear wall structural design method (Liao et al., 2021). Semantic drawings are obtained by extracting essential elements in design drawings and coding them by color patterns, to maintain critical design elements and enhance GAN performance.
Liao et al. (2021) proposed a GAN-based generative design method for shear wall structural design (i.e., StructGAN in Figure 2). The features of the structural shear walls, non-structural infill walls, doors, and windows in the design drawings were extracted and then transferred into semantic drawings. GAN was utilized for deep design feature extraction; it automatically generated shear wall structural designs according to the inputted architectural design drawings. However, StructGAN cannot consider the guidance of structural design text properties. For example, different text properties of "structural height = 50 m" and "structural height = 150 m" would result in completely different structural designs. However, this difference is yet to be realized by StructGAN.
TxtImg2Img is based on image-to-image and text-to-image methods. The former generates stable and distortionless images based on the conditional GAN architecture (Isola et al., 2017; Zhu et al., 2017; Wang et al., 2018), while the latter encodes the text sequence as a vector and applies an affine transform to convert the vector to the corresponding image (Zhang et al., 2017; Zhang et al., 2019). Moreover, Li et al. (2020) and Liu et al. (2020) proposed a text-guided image synthesis method that extracts high-dimensional features of text and images into vectors and fuses them in latent space. The target image is generated from the combined vector using an affine transformation. However, when the training dataset size is small (text sentences and image data are less than hundreds of thousands), the vector-to-image affine transformation in Li et al. (2020) and Liu et al. (2020) may generate distorted images.
GAN-based building design studies indicated that pix2pix (Isola et al., 2017) and pix2pixHD (Wang et al., 2018) methods could generate architectural and structural designs that better meet the requirements of stability and authenticity (Liao et al., 2021; Huang & Zheng, 2018, Chaillou, 2019). Therefore, this study further improved the pix2pixHD method (Wang et al., 2018) by considering the text property guidance on the image to generate the target image under simultaneous text-image guidance. The proposed method can be adopted for building structural design.
2.2 TxtImg2Img networks
This study developed a method for generating designs through image and text fusion, named TxtImg2Img. The network architecture of the TxtImg2Img is shown in Figure 3a. In the generator, the image and text are simultaneously inputted. After encoding the image and text, the convolutional neural network (CNN) and transpose CNN are used for high-dimensional feature extraction; the Hadamard product is used to fuse the image and text features in a high-dimensional space. Based on the fusion of high-dimensional features, the design is generated using the transpose CNN. Moreover, a discriminator is used to distinguish whether the synthetic images and text features are real or fake.
The core innovations of this study include text encoding, feature extraction, and the fusion of text and image features in the TxtImg2Img generator. Figure 3b shows the network architecture of text encoding and feature extraction. The corresponding specific processes are as follows:
Ÿ Pre-extract: The keywords in the text property description are extracted based on domain prior knowledge. For example, in the sentence ��the seismic design intensity is eight��, the corresponding keyword in the text property is ��eight��.
Ÿ
Encode, duplicate, and augment: Each text
line denotes a type of property description. Thus, each text line is converted
into a corresponding 1D digital vector (i.e., ![]() in decimal floating-point number), and multiplied by the property weight
coefficient (wi). Each vector is self-duplicated along the
three directions of column, row, and channel, thereby augmenting the 1D vector
into a 3D matrix as an initial mask matrix
(i.e.,
in decimal floating-point number), and multiplied by the property weight
coefficient (wi). Each vector is self-duplicated along the
three directions of column, row, and channel, thereby augmenting the 1D vector
into a 3D matrix as an initial mask matrix
(i.e., ![]() in Equation (1)).
in Equation (1)).
Ÿ
Extract feature and up-sample: The deep features
of each initial mask matrix are extracted using the residual network block,
and the features are up-sampled by transpose CNN to gain an extended mask
matrix (i.e., ![]() in Equation (2)).
in Equation (2)).
Ÿ
Fuse text features: The extended mask matrix
of each property is fused using the Hadamard product, merging different property
text guidance matrices and outputting one matrix of the same size, namely,
the fused mask matrix (i.e., ![]() in Equation (3)).
in Equation (3)).
Note that the size of the fused mask matrix is consistent with that of the corresponding image feature matrix. nusb (in Figure 3b) is the primary hyperparameter affecting the text guidance performance, that is, the number of up-sampling blocks. Consequently, a hyperparametric analysis should be conducted to determine the optimal nusb before application.
|
|
(1) |
|
|
(2) |
|
|
(3) |
|
|
(4) |
where ![]() is the self-duplicate function,
is the self-duplicate function, ![]() is the vector of the ith property, and wi
is the weight coefficient corresponding to the ith property (in
building structural design, the seismic intensity and structural height are
equally important, i.e., w1 = w2 = 1).
is the vector of the ith property, and wi
is the weight coefficient corresponding to the ith property (in
building structural design, the seismic intensity and structural height are
equally important, i.e., w1 = w2 = 1).
![]() is the up-sampling function,
is the up-sampling function, ![]() is the Hadamard product, and k is the number of
text properties.
is the Hadamard product, and k is the number of
text properties.
Consequently, in the TxtImg2Img generator, the conversion of natural
language text into a text mask with high-dimensional features ( ![]() ) is the primary concept of text feature extraction. The size of the
text mask (
) is the primary concept of text feature extraction. The size of the
text mask ( ![]() ) is consistent with that of the image feature matrix (
) is consistent with that of the image feature matrix ( ![]() ). The text and image features are fused in a high-dimensional space
via element-wise weighting
). The text and image features are fused in a high-dimensional space
via element-wise weighting ![]() by
by ![]() (Equation (4)). Finally, the fused features are converted
to a design under text-image guidance.
(Equation (4)). Finally, the fused features are converted
to a design under text-image guidance.
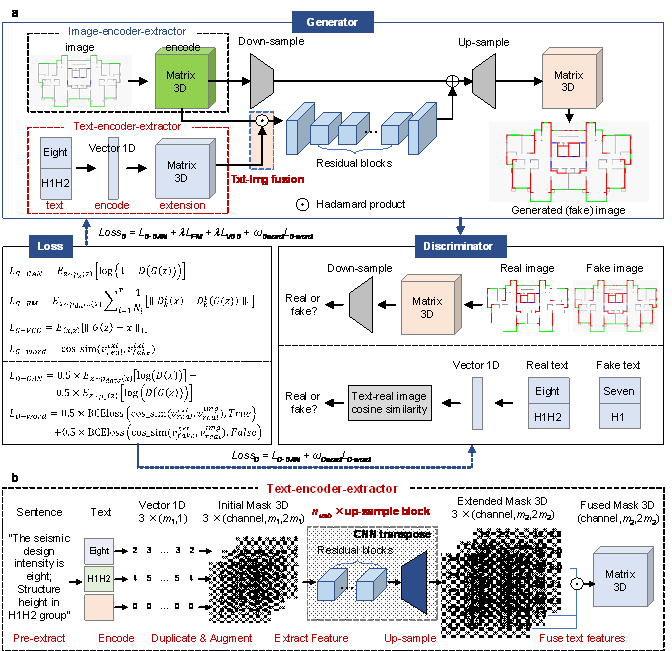
Figure 3. TxtImg2Img networks. a. generator and discriminator of TxtImg2Img: the generator includes image and text encoding, feature extraction, and feature fusion networks; a discriminator was adopted to distinguish real and fake image pairs. b. text�Cencoder�Cextractor network: the text is encoded as a vector, the vector is converted into a matrix by duplication, augment, and feature extraction; different matrixes are fused using Hadamard product and output.
In addition to the image generator, the discriminator and the text loss of generator and discriminator are developed in this study based on Li et al. (2019a & 2020). The discriminator is demonstrated in Figure 3a, where real or fake texts distinguish networks are added. As Equation (5) shows, text loss for the generator is the cosine similarity of real and fake text vectors, outputted by the text-encoder-extractor module. With the difference of real and fake vectors increasing, the text loss of the generator decreases, indicating the real and fake text features can be accurately extracted, respectively. Moreover, Equation (6) shows that the text loss for the discriminator is calculated by the cosine similarity between the feature vectors of text and image. Specifically, real text and real image features should be closer (the corresponding cosine similarity is close to 1), making the binary cross-entropy loss of cosine similarity and true label (= 1) small. On the other hand, the cosine similarity of fake text and real image features should be closer to 0, making the binary cross-entropy loss of cosine similarity and false label (= 0) small. Additionally, more details on LGAN, LFM, and LVGG are discussed in the pix2pixHD study of Wang et al. (2018).
Based on the image and text loss of generator and discriminator, the objective function can be calculated as Equations (7) and (8). The optimization of generative adversarial networks is to minimize the total loss of generator and discriminator.
|
|
(5) |
|
|
(6) |
|
|
(7) |
|
|
(8) |

where, ![]() is the cosine similarity function.
is the cosine similarity function. ![]() and
and ![]() are the feature vectors of real and fake texts, which are
output by the text-encoder-extractor module, respectively.
are the feature vectors of real and fake texts, which are
output by the text-encoder-extractor module, respectively. ![]() is the real image feature, output by the VGG19 pre-trained
network model (Simonyan & Zisserman, 2015).
is the real image feature, output by the VGG19 pre-trained
network model (Simonyan & Zisserman, 2015). ![]() is the binary cross-entropy loss function.
is the binary cross-entropy loss function. ![]() and
and ![]() are the text loss weights of the generator and discriminator,
respectively.
are the text loss weights of the generator and discriminator,
respectively.
Subsequently, the algorithm of TxtImg2Img can be determined based on the aforementioned networks. Moreover, the critical algorithm parts are illustrated by the pseudocode as follows and are also available on GitHub (https://github.com/wenjie-liao/StructGAN-TXT-TxtImg2Img).
Algorithm1 Training
|
Input: architectural image, structural design condition texts, engineer-designed structural image |
|
Output: AI-design structural image |
|
Text encoding (Sub-Algorithm: Text encoding) # encoding all the texts words into floating-point numbers |
|
Load datasets # including images and texts |
|
Crate neural network model and corresponding optimizer (including Sub-Algorithm: Text feature extraction) |
|
Training by epoch: |
|
Training by batch: |
|
Loss, generated image = model (architectural image, structural design condition texts, engineer-designed structural image) |
|
Discriminator loss = image judge loss + text judge loss |
|
Generator loss = GAN loss + GAN feature loss +VGG loss + text generated loss |
|
Loss backward |
|
Save model |
Sub-Algorithm: Text encoding
|
Input: structural design condition texts |
|
Output: floating-point number of structural design condition texts |
|
Read all the original text string data of the training set and test set |
|
Segment captions to get all words, based on nltk library |
|
Create a word dictionary, that is, construct the corresponding float of all words |
|
Output the encoded data |
Sub-Algorithm: Text feature extraction
|
Input: floating-point number of structural design condition texts |
|
Output: feature tensor of structural design condition texts |
|
For caption in captions: |
|
Add dimension of 1D tensor to 3D tensor, by torch.unsqueeze() |
|
Expand and repeat 3D tensor to the same size tensor as that of image feature, by torch.expand() and torch.repeat() |
|
Extract deep feature of text by ResnetBlock() and torch.nn.ConvTranspose2d() |
|
Fuse extracted features of different captions by Hadamard product |
|
Output the fused text features |
3. TxtImg2Img Implementation
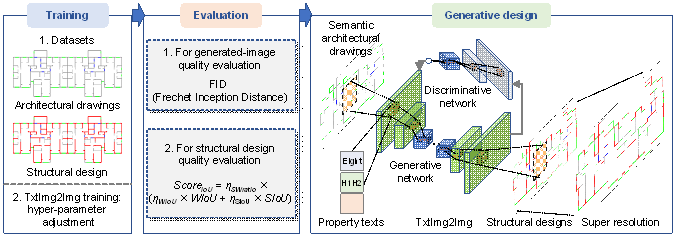
Figure 4. TxtImg2Img application steps: training, evaluation, and generative design.
The TxtImg2Img method can be adopted not only for designing structures of shear walls but also for the appearance of shoes and handbags. It is composed of three main steps (Figure 4): 1) establishment of training and test datasets and training of TxtImg2Img, 2) testing and evaluation of TxtImg2Img, and 3) generative design using the well-trained TxtImg2Img.
3.1 Datasets and TxtImg2Img training
Establishing datasets for TxtImg2Img training and testing is the basic step in the application process. This method is primarily used for structural design. In addition, this study also tested the universal applicability of TxtImg2Img in other engineering and industrial designs. Note that no building-related open-access datasets are available for generative design, so designing appearances of shoes and handbags, and coloring of gray images are selected as the supplementary datasets. Four datasets were established, namely, architectural-to-structural design (original image data from Liao et al. (2021)), shoe edges-to-appearance design (original image data from Isola et al. (2017)), handbag edges-to-appearance design (original image data from Isola et al. (2017)), gray-to-colored bird image conversion (original image data from Wah et al. (2011)). Based on the raw image data (without the corresponding text property), this study created suitable text descriptions for all labeled images. The labeled images were used to generate target images with the corresponding text properties. Typical data for the four different types of datasets are shown in Figure 5.
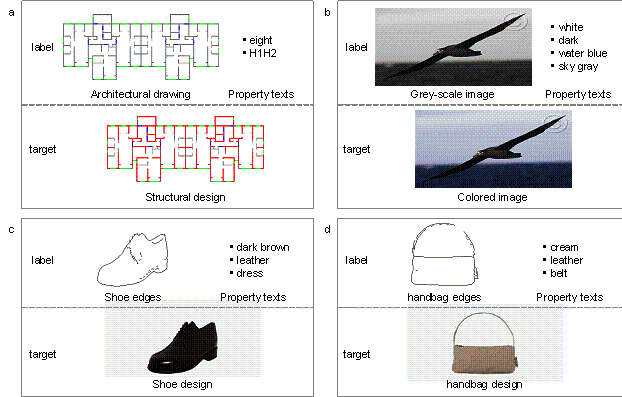
Figure 5. Typical images and the corresponding text properties (image size = 512 �� 256). a. architectural-to-structural design datasets (224 training and 24 test data). b. gray-to-colored bird image conversion datasets (588 training and 141 test data). c. shoe edges-to-appearance design datasets (600 training and 150 test data). d. handbag edges-to-appearance design datasets (600 training and 150 test data).
Figure 5a shows a typical architectural-to-structural design dataset, with 224 training data and 24 test data. In the study of Liao et al. (2021), all raw data (i.e., architectural drawings and the structural design drawings of ground truth) were collected from more than ten famous architectural design and research institutes in China, to ensure the quality of the source design. Moreover, these designs satisfied all relevant design specifications, were optimized and evaluated by experienced engineers, and were adopted in real-world construction applications with excellent quality. Based on the raw drawings, the semantic process was adopted to extract critical elements of raw drawings and enhance training performance, where semanticization is to extract essential architectural and structural elements in design images and code them by color patterns. The images in Figure 5a are typical semantic drawings, and more detailed datasets can be found in the study of Liao et al. (2021).
The seismic design intensity and structural height determine the structural design requirements of a shear wall building (Qian et al., 2018). Liao et al. (2021) further grouped the training and test datasets according to the aforementioned two critical factors. Moreover, the classification metrics of the factors were derived from the Chinese Code for Seismic Design of Buildings (GB50011-2010, 2010). Consequently, three groups of datasets were established: Group7-H1 (63 training data, 8 test data), Group7-H2 (80 training data, 8 test data), and Group8-H1H2 (81 training data, 8 test data). Here, Group7 and Group8 denote seismic design intensities of 7-degree and 8-degree, respectively. The corresponding peak ground accelerations (PGAs) of the design-based earthquake (DBE, the exceedance probability in 50 years of the DBE is 10%) are 100 cm/s2 and 200 cm/s2 in the 7-degree and 8-degree seismic intensity zones, respectively. H1, H2, and H1H2 denote structural heights of < 50 m, 50�C150 m, and 0�C150 m, respectively. In the 8-degree seismic intensity zones, the high seismic design intensity dominates the demands for structural seismic resistance, whereas the structural heights slightly influence those demands; thus, the designs in the 8-degree seismic intensity zones were not grouped by structural heights. Based on the image datasets of Liao et al. (2021), this study merged different grouped datasets and added text properties of images according to the original group names. As shown in Figure 5a, the text property ��eight�� denotes that the seismic design intensity is 8-degree; ��H1H2�� denotes the structural height attribute.
The text properties of the other datasets were similar to those of the architectural-to-structural design datasets shown in Figure 5a. The gray-to-colored bird image conversion datasets included four text properties, as shown in Figure 5b: bird head color (white), body color (dark), 1st background color (water blue), and 2nd background color (sky gray). The shoe edges-to-appearance design datasets included three text properties, as shown in Figure 5c: shoe color (dark brown), material (leather), and style (dress). The handbag edges-to-appearance design datasets included three text properties, as shown in Figure 5d: handbag color (cream), material (leather), and belt or none (belt).
Using the datasets, the training and testing of TxtImg2Img and the critical hyperparametric analysis were carried out. More detailed training and analysis of TxtImg2Img are presented in Section 4.
3.2 Evaluation and metrics
Studies on rational generation evaluation methods are critical and challenging for GANs. At present, Fr��chet inception distance (FID) is a highly accepted evaluation method that is applicable to most image generation quality evaluations (Heusel et al., 2017). In the FID-based evaluation method shown in Figure 6a, a high-dimensional image feature extraction is conducted based on pre-trained networks (such as Inception V3 (Szegedy et al., 2016)), and the features are flattened into vectors. The mean and covariance matrix of the high-dimensional features can be calculated based on the feature vectors of the generated and target images. Subsequently, the Fr��chet distance is used to measure the distance between the high-dimensional probability distribution of the generated image and the target image, based on the mean and covariance matrix. A small Fr��chet distance denotes that the generated images are close to the target images with high quality. Fr��chet distance d(. , .) can be calculated using Equation (9) (Dowson & Landau, 1982):
|
|
(9) |
where (m, C) and (mw, Cw) are the mean and covariance matrices of the generated images and target images, respectively.

Figure 6. Evaluation methods. a. FID metric-based evaluation method. b. WIoU evaluation method. c. SIoU evaluation method.
Consequently, the FID-based evaluation method assesses image authenticity and clarity by measuring the high-dimensional probability distribution distance between the generated and target images. However, the evaluation results cannot clearly illustrate the rationality of the generated shear wall designs. Hence, specific evaluation methods and indicators should be developed for the evaluation of building structural designs. Liao et al. (2021) comprehensively reviewed the existing evaluation methods of GAN-generated images, and developed applicable evaluation methods and corresponding metrics (i.e., ScoreIoU) for StructGAN-generated structural designs. ScoreIoU is calculated using three key indicators: ��SWratio, WIoU, and SIoU in Equation (10). ��SWratio is obtained using Equation (11), and denotes the shear wall quantity (i.e., SWratio, the ratio of shear wall to total walls) difference between the generated and target designs, where SWratioout and SWratiotar are the SWratios of the StructGAN-generated design and target design, respectively (Equation (12)). WIoU is calculated using Equation (13) from the confusion matrix in Figure 6b. It shows the key element difference between the StructGAN-generated design and the target design at the pixel level. SIoU is calculated using Equation (14) based on the contour detection results shown in Figure 6b. It evaluates the shear wall contour coincidence between the StructGAN-generated design and the target design. ��SIoU and ��WIoU are the weighted coefficients of SIoU and WIoU, respectively, which are equal to 0.5. ScoreIoU evaluates the rationality of the quantity and the layout position of shear wall designs; a higher ScoreIoU denotes a better design.
Moreover, in the well-known PASCAL VOC challenge (Everingham et al., 2010), the intersection over union (IoU) threshold was set to 0.5, indicating that the outcome is consistent with the ground truth (Everingham et al., 2010 & 2015; Rezatofighi et al., 2019). Based on IoU, ScoreIoU was developed for structural design evaluation. Structural designs with ScoreIoU > 0.5 have been verified to perform well; thus, a ScoreIoU > 0.5, indicates that the generated designs are good Liao et al. (2021). More details about ScoreIoU can be found in Liao et al. (2021).
|
|
(10) |
|
|
(11) |
|
|
(12) |
|
|
(13) |
|
|
(14) |
where, Aswall and Ainwall are the total areas of the shear and infill walls, respectively. (k+1) is the total class (class 0 is for the background, class 1 is for the shear wall, class 2 is for the infill wall, class 3 is for the window, and class 4 is for the outdoor gate, in Figure 6b). pii represents the number of true positives, whereas pij and pji are usually interpreted as false positives and false negatives, respectively. Ainter and Aunion are the intersection area and union area of the shear walls in the GAN-synthetic and target designs, respectively.
3.3 Generative design
As shown in Figure 4, after performance evaluation, the well-trained TxtImg2Img model can be used in structural design or other engineering designs. With the simultaneous input of primary images and the corresponding design text properties, TxtImg2Img can quickly generate a design that meets the text-image guidance. Additionally, TxtImg2Img normally generates an image with a size of 512 �� 256 pixels, which makes it difficult to meet the high-resolution requirements of engineering design. Therefore, the super-resolution method (Li et al., 2019b; Sharma & Kumar, 2021) is recommended to improve the output image resolution up to 1024 �� 512 pixels.
4. Discussion of Networks and Hyperparameters
This study analyzed the network architecture of image feature extraction and generation and the hyperparameters of the text encoding-feature extraction network to explore the most applicable network architecture and corresponding hyperparameters.
4.1 Network adjustment
The TxtImg2Img generator is mainly composed of text and image feature extraction and fusion modules, and a fused feature-based image generation module. The basic network architecture used in this study for text feature extraction and fusion was relatively simple, and could be easily determined. Based on the confirmed text feature extraction and fusion network, it was necessary to determine the most appropriate network architecture for image feature extraction and new image generation. Hence, this study compared two widely used image-to-image methods, namely pix2pix (Isola et al., 2017) and pix2pixHD (Wang et al., 2018), and a text-guided image synthesis method, ManiGAN (Li et al., 2020). The pix2pix and pix2pixHD networks were combined with the text feature extraction and fusion networks under the architecture shown in Figure 7. The combined networks and ManiGAN networks, as well as the corresponding generated images, are shown in Figure 7.
1) Method A: Using pix2pixHD, the combined network shown in Figure 7a was used to fuse the high-dimensional features of images and texts and generate designs. Figure 7b shows the generated design. The generated image had a high resolution, and the corresponding shear wall structural design was reasonable (i.e., the Equation (10)-based evaluation metric ScoreIoU = 0.5086).
2) Method B: Based on the UNet networks of pix2pix, the combined networks are shown in Figure 7c, and the corresponding generated design is shown in Figure 7d. In contrast to Method A, the generated image had a low resolution, and the quantity of the designed structural shear walls was large, indicating that the text had insufficient control over design generation (ScoreIoU = 0.0644). Moreover, the pix2pix training was unstable, similar to what Wang et al. (2018) observed.
3) Method C: Figure 7e shows a typical image generation method with text guidance, that is, ManiGAN (Li et al., 2020). This method extracts the image and text features separately, flattens the features into 1D vectors, and creates a normally distributed 1D noise vector. Then, the 1D text, image, and noise vectors are stacked in a latent space. Based on the stacked 1D vector, affine transformation networks were adopted to generate the image. However, owing to the quantity limits of structural design drawings and the corresponding text properties, it is easy to generate a distorted image using the 1D vector affine transformation. As shown in Figure 7f, the generated structural design did not meet the design requirements (ScoreIoU = 0.0058).
Through the analysis and application of various typical network architectures, Method A (the combination of pix2pixHD networks and text feature extraction and fusion networks) was found to perform best with image and text features fused by the Hadamard product. The detailed network architecture is illustrated in Figure 3a.
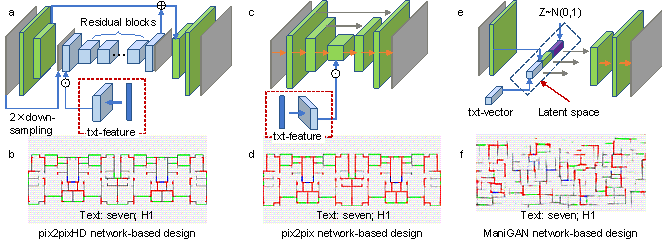
Figure 7. Comparison of different basic networks and text�Cimage fusion methods. a�Cb. Combination of pix2pixHD networks and text feature extraction and fusion networks, and the corresponding generated design (ScoreIoU = 0.5086). c�Cd. Combination of pix2pix networks and text feature extraction and fusion networks, and the corresponding generated design (ScoreIoU = 0.0644). e�Cf. ManiGAN networks and the corresponding structural design (ScoreIoU = 0.0058).
4.2 Hyperparametric adjustment and discussion
After determining the network architecture, it was necessary to further analyze the text encoding-feature extraction networks. First, the text encoding method for mapping simple text into float numbers was adopted. The text properties of this method are pre-extracted vital features based on domain prior knowledge. Hence, text properties used were concise keywords instead of complicated sentences, which were more suitable for simple encoding. Second, a performance analysis of the text feature extraction network was conducted. As shown in Figure 3b, the most critical hyperparameter is the number of up-sampling blocks (i.e., nusb), which corresponds to the depth of the up-sampling networks. In general, deeper networks can extract features more adequately (Krizhevsky et al., 2012). However, limited data for too deep network training can easily cause a dimensionality curse (Wikipedia, 2021), inducing the feature extraction ability to decrease. Therefore, a hyperparametric analysis is required to determine the optimal nusb. In addition, regular hyperparameters, such as learning rate, batch size, ��Gword, and ��Dword, are also analyzed to figure out the influence on TxtImg2Img-based designs.
Using the established architectural-to-structural design datasets, this study analyzed the influence of nusb, and the results are shown in Figure 8. The evaluation method and the corresponding metric ScoreIoU obtained in Section 3.2 were used to quantify the shear wall structural design performance. Section 3.1 presents the structural design properties, namely seismic design intensity and structural height. G7-H1, G7-H2, and G8-H1H2 in Figure 8 denote the structural design results corresponding to the three different structural design text properties. Additionally, as discussed in Section 3.2, ScoreIoU > 0.5 indicates a good design performance. The ScoreIoU of the test results with the text properties of G7-H2 and G8-H1H2 performed well under different nusb, and their design results were very similar. Therefore, the critical results that determined the TxtImg2Img performance were the generative designs with the text properties of G7-H1. When nusb = 3, TxtImg2Img generated the best designs with a corresponding ScoreIoU = 0.48, which was close to 0.5. Thus, nusb = 3 was the most suitable hyperparameter for TxtImg2Img for the shear wall structural design. Furthermore, the hyperparameters were analyzed using a similar method applied to other designs. As the text properties in TxtImg2Img were simple, the networks did not change significantly; thus, the recommended nusb was 3.
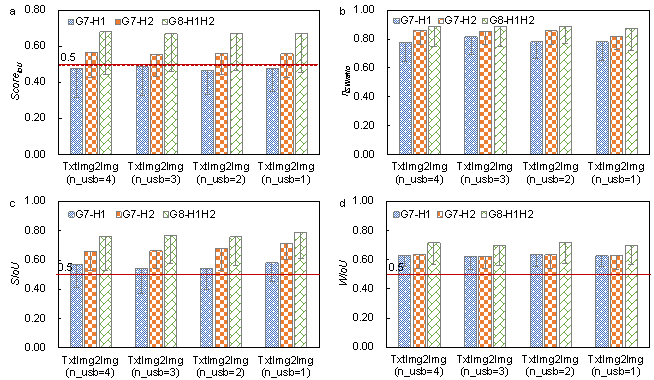
Figure 8. Hyperparametric analysis of nusb (i.e., the number of up-sampling blocks). a. ScoreIoU-based evaluation results. b-d. ��SWratio, WIoU, and SIoU-based evaluation results.
Subsequently, other regular hyperparameters analysis results are shown in Appendix A, indicating that those hyperparameters can differently affect the performance of TxtImg2Img. Consequently, based on the analysis, the hyperparameters are determined and shown in Table 1.
Tabel 1 Details of model hyperparameters
|
Hyperparameter |
Choice |
|
Number of input and output size |
512��256��3 |
|
Batch size |
2 |
|
Number of epoch |
100 |
|
Learning rate |
0.0002 |
|
Decay policy |
Linear (Wang et al., 2018) |
|
Optimizer |
Adam (Kingma & Ba, 2014) |
|
Momentum |
0.5 (Wang et al., 2018) |
|
nusb (number of up-sampling blocks) |
3 |
|
��Gword (text loss weights of the generator) |
1 |
|
��Dword (text loss weights of the discriminator) |
1 |
In addition, based on the hyperparameters, the complexity can be concluded. (1) For the complexity of texts and image of this study: (a) the complex of dealt texts is relatively low: the word type in TxtImg2Img is less than 10, with a total of 2000 corresponding words, which is 1/1200 of the complex model of ManiGAN (the corresponding total number of words is 2,400,000); (b) the image semantization method effectively reduces the complexity of image learning (Liao et al., 2021), and the image size is normal (i.e., 256��512), avoiding the additional computational cost; (c) low model parameters: TxtImg2Img model has 47 million trainable parameters, the ManiGAN model has 78 million parameters (with more parameters for text feature learning than TxtImg2Img), and other well-known text-image transform algorithms, such as DALL-E, with approximately 12000 million parameters (Ramesh et al., 2021). Hence, the TxtImg2Img model is low complexity and suitable for few-shot learning. (2) Moreover, for the complexity of the optimization algorithm: This study uses the widely used Adam optimizer (Kingma & Ba, 2014), which is consistent with the pix2pixHD algorithm (Wang et al., 2018). Because the Adam optimizer has been proven useful in deep learning, no further analysis and discussion of complexity need to be conducted.
5. Design Performance of TxtImg2Img
The analysis and comparison of studies on the network architecture and critical hyperparameters of TxtImg2Img were conducted, and the optimal network and hyperparameters were determined. In addition to the architectural-to-structural design datasets, shoe edges-to-appearance design, handbag edges-to-appearance design, and gray-to-colored bird image conversion datasets were adopted for training, testing, and evaluation to further assess the TxtImg2Img performance.
Liao et al. (2021) proposed a GAN-based structural design method, namely StructGAN. pix2pixHD (Wang et al., 2018) and ManiGAN (Li et al., 2020) are typical image generation methods. In this study, the application performance of TxtImg2Img, StructGAN (Liao et al., 2021), pix2pixHD (Wang et al., 2018), and ManiGAN (Li et al., 2020) in shear wall structural design and other designs were compared.
5.1 Structural designs compared with different methods
The shear wall structural design results are shown in Figure 9. Figure 9a shows the FID-based evaluation results of the structural design images generated using the different methods. As mentioned in Section 3.2, the FID mainly measures the authenticity and clarity of the generated image. A significant FID value indicates a significant difference between the generated and target images. The generated images of TxtImg2Img, StructGAN, and pix2pixHD were similar, and the corresponding FIDs were approximately equal to 25, which were significantly different from the FID of ManiGAN (FID = 350).

Figure 9. Architectural-to-structural design performance of the different methods. a. Comparison of FID. b. Comparison of ScoreIoU. c. Comparison of typical structural designs.
Table 2. Improvement in structural design performance
|
Method |
pix2pixHD |
StructGAN |
TxtImg2Img |
||
|
Perfmance |
ScoreIoU |
ScoreIoU |
Enhancement |
ScoreIoU |
Enhancement |
|
G7-H1 |
0.3225 |
0.4000 |
24.02% |
0.4853 |
21.32% |
|
G7-H2 |
0.5170 |
0.5200 |
0.58% |
0.5527 |
6.28% |
|
G8-H1H2 |
0.5793 |
0.6500 |
12.20% |
0.6696 |
3.01% |
Additionally, Figure 9c shows typical generated structural design images obtained by the different methods; the ManiGAN-generated image shows significant distortion. Thus, the FID-based evaluation and typically generated images indicate that the ManiGAN-generated image had the worst structural design. Although ManiGAN performed well under training with sufficient data (nearly 100,000 of data) (Li et al., 2020), it was not easy to improve the generation quality with the dataset size limit for building structural design (approximately 220 of data).
In comparison, the authenticity and clarity of the images generated using TxtImg2Img, StructGAN, and pix2pixHD were excellent. Moreover, FID primarily evaluated the image similarity only, without considering the physical meaning of pixels in the structural design. Further, the FID did not accurately evaluate the quality of the structural design. Therefore, further evaluation based on ScoreIoU was required.
Figure 9b shows the ScoreIoU-based structural design evaluation results. The authenticity of the ManiGAN-generated image was unacceptable; thus, the corresponding ScoreIoU was low. The ScoreIoU using StructGAN was up to 24% higher than that of pix2pixHD (Table 1). The GAN algorithm of StructGAN is pix2pixHD, and StructGAN groups the training and test datasets according to the structural design properties. In contrast, all the structural design data were mixed and adopted for pix2pixHD training. The mixed datasets for GAN training made the learned features closer to the average characteristics of all the data. Thus, StructGAN performed better for structural designs, especially those designs with G7-H1 and G8-H1H2 properties, which was consistent with the finding of Liao et al. (2021). The ScoreIoU of TxtImg2Img was up to 21% higher than that of StructGAN (Table 1).
In contrast to the StructGAN training, TxtImg2Img did not group the datasets according to the structural design properties; hence, the training data were relatively sufficient. TxtImg2Img was trained with more data and text guidance, resulting in better performance than StructGAN. Thus, TxtImg2Img showed better performance in shear wall structural design compared to other methods.
5.2 Structural designs guided by different texts
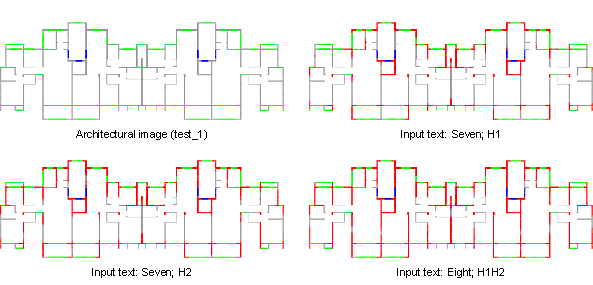
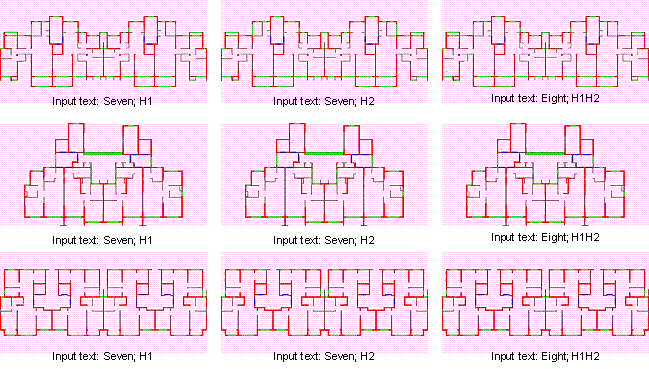
Figure 10 Structural designs guided by different texts
Subsequently, this study carried out the overall structural design and analyzed the corresponding overall structural performance based on the designs in Figure 10. The overall structure modeling and analysis methods refer to StructGAN (Liao et al., 2021) and StructGAN-PHY (Lu et al., 2022), where the determination of wall thickness is from StructGAN-PHY (Lu et al., 2022), and engineers design other components (i.e., beam and plate). The design cases are named Case-7d50m, Case-7d100m, and Case-8d100m, based on their design conditions (i.e., 7-degree seismic design intensity and 50 m structural height, 7-degree and 100 m, and 8-degree and 100 m), respectively. Typical plans and 3D views of ETABS mechanical models are shown in Figure 11. Furthermore, the structural dynamic characteristics and performance under seismic load are analyzed, and the corresponding results are shown in Table 3 and Figure 11, respectively.
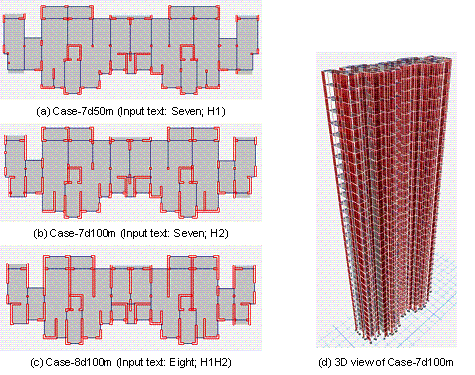
Figure 11 ETABS structural design model
Table 3 Structural dynamic characteristics and mechanical response
|
Case |
Wall thickness (mm) |
Period and mode (s) |
Self-weight (kN) |
Maximum inter-story drift ratio (rad) |
|||
|
1st |
2nd |
3rd |
x-direction |
y-direction |
|||
|
Case-7d50m |
220 |
1.46 (y) |
1.33 (x) |
1.14 (torsion) |
93236 |
0.00047 |
0.00067 |
|
Case-7d100m |
280 |
2.99 (y) |
2.84 (x) |
2.18 (torsion) |
196445 |
0.00067 |
0.00096 |
|
Case-8d100m |
300 |
1.79 (y) |
1.68 (x) |
1.28 (torsion) |
200428 |
0.00055 |
0.00086 |
As shown in Tabel 3 and Figure 11, the structural dynamic characteristics are highly related to the layouts of shear wall components. Specifically, the seismic deformation response of the Case-7d50m structure can effectively meet the design code requirement. Although the design is a little conservative, the number and length of structural components have almost reached the lower limit of the design. Once the components become less, the strength of the structure can hardly satisfy the code requirement. Compared with Case-7d50m, the number of shear wall components increased slightly due to the higher structure height. The overall structural stiffness is relatively small, and the corresponding inter-story drift ratio is greater but still within the deformation limits of the design code. As for Case-8d100m, its seismic design intensity is highest, and the corresponding seismic action is quite large, so the layout and number of shear wall components are obviously increased to resist more intensive seismic action, ensuring the structural deformation can effectively meet the code requirements.
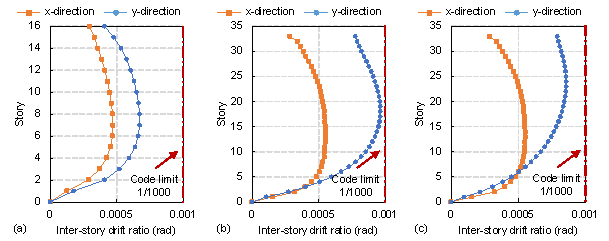
Figure 12 Structural deformation response under seismic action. (a) Case-7d50m, (b) Case-7d100m, (c) Case-8d100m.
Consequently, the analysis results indicate that both the structural design image and the corresponding established overall structural analysis model can effectively reflect the guiding effect of the design condition texts on the structural design, and the mechanical performance of the designed structure can effectively meet the corresponding code.
5.3 Designs for shoes, handbags, and colored birds
Section 3.1 discusses the creation of the datasets and the corresponding text properties. Based on these datasets, TxtImg2Img was also trained, tested, and evaluated. Unlike structural design, the three types of datasets had no specific evaluation methods or metrics. Hence, this study used the widely used FID indicator for evaluation (Heusel et al., 2017). Figure 13 shows a comparison of the FID-based evaluation results and typical generated images.
The datasets for shoe edges-to-appearance and handbag edges-to-appearance designs were adopted for training and testing. The corresponding evaluation results of the TxtImg2Img, pix2pixHD, and ManiGAN designs are shown in Figures 13a and 13b, respectively. Specifically, ManiGAN had the worst performance. pix2pixHD did not generate oriented images without text guidance; hence, the color of the pix2pixHD-designed shoe was brown, which was different from the target color of black. In contrast, TxtImg2Img effectively generated a shoe appearance with the text property guidance. Moreover, the FIDs of TxtImg2Img and pix2pixHD were relatively similar, indicating that the texture and authenticity of the TxtImg2Img-generated images were approximately similar to those generated using pix2pixHD.
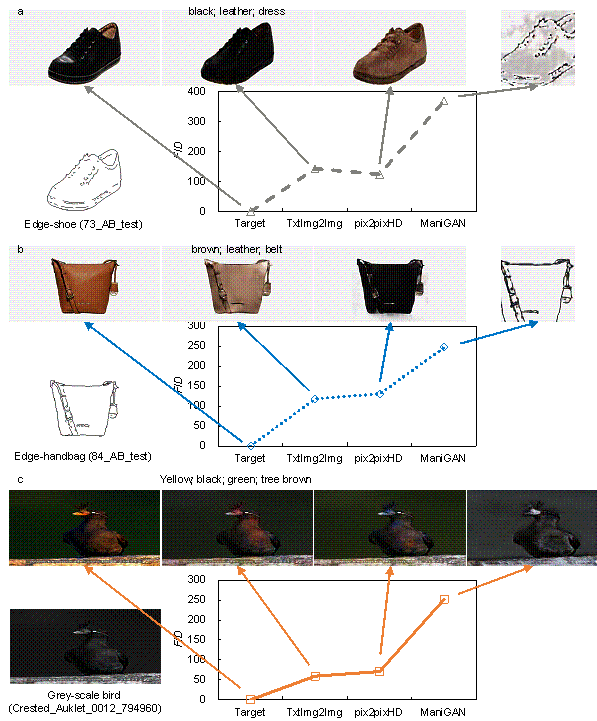
Figure 13. Comparison of performance evaluation and typical generations. a. shoe edges-to-appearance design datasets; b. handbag edges-to-appearance design datasets; and c. gray-to-colored bird image conversion datasets.
Figure 13c shows the generation performance of the different methods using the gray-to-colored bird image conversion datasets. The figure shows that the image generated by TxtImg2Img was not good, as cases with sophisticated features and properties require attention mechanisms, as indicated by Li et al. (2020). However, the training of neural networks with attention mechanisms requires an enormous amount of data (at least hundreds of thousands of images and corresponding sentences). As such amount of data were not available in this study, the attention mechanism was not adopted.
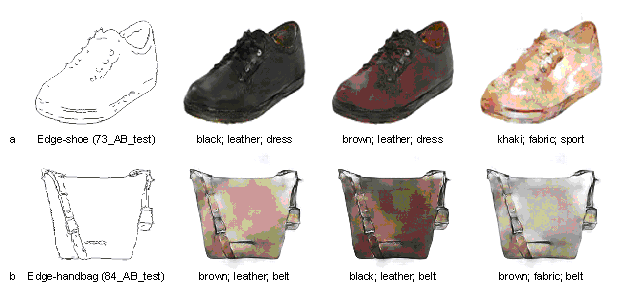
Figure 14. TxtImg2Img-generated images with different text properties. a. Architectural-to-structural design datasets; b. shoe edges-to-appearance design datasets; and c. handbag edges-to-appearance datasets.
Subsequently, Figures 14a and 14b show the designed appearances of the shoes and handbags, respectively, with different properties. With the same edge inputs and different text properties, the TxtImg2Img designs basically conformed to the text descriptions.
In addition, one critical advantage of the TxtImg2Img method proposed in this study is its relatively excellent generation ability under few-shot learning. The cases mentioned earlier proved that TxtImg2Img performed well under small training datasets (less than 1000 data). In addition, this study also augmented the Edge2shoes datasets from the initial 600 to 10,000 of training data (dataset size increased by approximately 20 times). The impact of dataset size on the method was investigated by comparing the performance of trained TxtImg2Img using different sizes of datasets. As shown in Figure 15, the test performance of TxtImg2Img trained using 600 of data only was almost equivalent to that trained using 10,000 of data. The difference of their FID was relatively small (FID600 / FID10000 = 1.69), and the perceptual evaluation could hardly distinguish the difference between them. Therefore, TxtImg2Img has an excellent image generation ability under small training datasets (less than 1000 datasets).
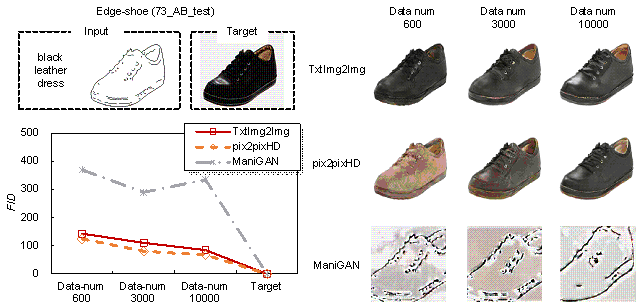
Figure 15. Generative design performance affected by different training dataset sizes.
6. Conclusions
In this study, we developed a novel GAN-based structural design method, namely TxtImg2Img. TxtImg2Img can generate structural designs according to the guidance of text properties and primary images by simultaneously inputting an architectural drawing and the corresponding text properties. The method effectively breaks through the limitation that existing generative design can only learn and generate based on image, with few-shot learning. Compared with StructGAN, TxtImg2Img improved the shear wall structural design performance by up to 21%, thereby facilitating GAN-based structural designs. The detailed conclusions are as follows.
(1) Based on the GAN architecture, text encoding, text feature extraction, and text-image feature fusion neural networks were developed and embedded into the generator. Subsequently, the generator was combined with a discriminator to establish TxtImg2Img. Through analyses of critical network architecture and hyperparameters of text feature extraction, the architecture and performance of TxtImg2Img were determined, and its design generation ability under few-shot learning (< 1000 of data) was validated.
(2) FID-based and ScoreIoU-based evaluation methods were adopted for the structural design performance assessment of TxtImg2Img. With different text property guidance, the ScoreIoU of TxtImg2Img structural designs were the highest compared to that of other methods, indicating that TxtImg2Img performed better than the other methods. Moreover, the metric FID was not applicable for evaluating the structural design as it did not reflect the structural layout difference between the designs.
(3) The TxtImg2Img method was also used in shoe edges-to-appearance design, handbag edges-to-appearance design, and gray-to-colored bird image conversion datasets. The FID-based evaluation method was adopted for the assessment. The results indicate that TxtImg2Img generated images that were relatively similar to the targets with text properties guidance, and the appearance designs for the shoes and handbags were excellent.
(4) The text features extracted by TxtImg2Img are relatively simple, mainly related to seismic design conditions. The text features are primarily used to enhance the overall image features of structural design while can hardly control local image details. Moreover, in practical engineering design, many language texts still need to be learned and used to guide structural design, which is challenging for TxtImg2Img to deal with. Therefore, further research is required in the future to realize the fusion and generation of multiple complex and detailed text and image features.
Data availability statement
The dataset and all codes for this study are available by request to the corresponding author. All inquiries regarding this content should be directed to the corresponding author. Moreover, the code of critical parts (i.e., text data encoding, text feature extraction, and image-text feature fusion networks, shown in Section 2.2) can be found on GitHub (https://github.com/wenjie-liao/StructGAN-TXT-TxtImg2Img).
Declaration of Competing Interest
The authors declare that they have no known competing financial interests or personal relationships that could have appeared to influence the work reported in this paper.
Acknowledgment
References
[dataset] Wah, C., Branson, S., Welinder, P., Perona, P., Belongie, S. (2011). The caltech-ucsd birds-200-2011 dataset. http://www.vision.caltech.edu/visipedia/CUB-200.html
Babu, K. K., & Dubey, S. R. (2021). CSGAN: cyclic-synthesized generative adversarial networks for image-to-image transformation. Expert Systems with Applications, 169, 114431. https://doi.org/10.1016/J.ESWA.2020.114431
Chaillou S. (2019). ArchiGAN: a generative stack for apartment building design. https://devblogs.nvidia.com/archigan-generative-stack-apartment-building-design/?linkId=70968833 (Accessed September 24, 2021)
Chen, Q., Wang, W., Huang, K., De, S., & Coenen, F. (2021). Multi-modal generative adversarial networks for traffic event detection in smart cities. Expert Systems with Applications, 177, 114939. https://doi.org/10.1016/J.ESWA.2021.114939
Dowson, D. C., & Landau, B. V. (1982). The Fr��chet distance between multivariate normal distributions. Journal of Multivariate Analysis, 12(3), 450�C455. https://doi.org/10.1016/0047-259X(82)90077-X
Everingham, M., Eslami, S. M. A., Van Gool, L., Williams, C. K. I., Winn, J., & Zisserman, A. (2015). The pascal visual object classes challenge: A retrospective. International Journal of Computer Vision, 111(1), 98�C136. https://link.springer.com/article/10.1007%252Fs11263-014-0733-5
Everingham, M., Van Gool, L., Williams, C. K. I., Winn, J., & Zisserman, A. (2010). The pascal visual object classes (voc) challenge. International Journal of Computer Vision, 88(2), 303�C338. https://link.springer.com/article/10.1007%252Fs11263-009-0275-4
GB50011-2010. (2010). Code for seismic design of buildings. China Architecture & Building Press, Beijing. (in Chinese)
Goodfellow, I., Pouget-Abadie, J., Mirza, M., Xu, B., Warde-Farley, D., Ozair, S., Courville, A., & Bengio, Y. (2014). Generative adversarial nets. Advances in Neural Information Processing Systems, 27. https://papers.nips.cc/paper/2014/file/5ca3e9b122f61f8f06494c97b1afccf3-Paper.pdf
Heusel, M., Ramsauer, H., Unterthiner, T., Nessler, B., & Hochreiter, S. (2017). Gans trained by a two time-scale update rule converge to a local nash equilibrium. Advances in Neural Information Processing Systems, 30. https://proceedings.neurips.cc/paper/2017/file/8a1d694707eb0fefe65871369074926d-Paper.pdf
Huang, W., & Zheng, H. (2018). Architectural drawings recognition and generation through machine learning. Association for Computer Aided Design in Architecture (ACADIA, 2018), pp. 156-165. http://papers.cumincad.org/cgi-bin/works/BrowseTree=series=AZ/Show?acadia18_156
Huang, X., & Xie, M. (2010). Evolutionary topology optimization of continuum structures: methods and applications. John Wiley & Sons. https://onlinelibrary.wiley.com/doi/book/10.1002/9780470689486
Isola, P., Zhu, J. Y., Zhou, T., & Efros, A. A. (2017). Image-to-image translation with conditional adversarial networks. Proceedings of the IEEE Conference on Computer Vision and Pattern Recognition, 1125�C1134. https://openaccess.thecvf.com/content_cvpr_2017/papers/Isola_Image-To-Image_Translation_With_CVPR_2017_paper.pdf
Ivashkov, M. (2004). ACCEL: a tool supporting concept generation in the early design phase. Eindhoven, Technical University Eindhoven. http://citeseerx.ist.psu.edu/viewdoc/download?doi=10.1.1.122.8104&rep=rep1&type=pdf
Karras, T., Laine, S., & Aila, T. (2019). A style-based generator architecture for generative adversarial networks. Proceedings of the IEEE/CVF Conference on Computer Vision and Pattern Recognition (CVPR). https://openaccess.thecvf.com/content_CVPR_2019/papers/Karras_A_Style-Based_Generator_Architecture_for_Generative_Adversarial_Networks_CVPR_2019_paper.pdf
Kingma, D. P., & Ba, J. (2014). Adam: A method for stochastic optimization. arXiv preprint arXiv:1412.6980.
Krizhevsky, A., Sutskever, I., & Hinton, G. E. (2012). Imagenet classification with deep convolutional neural networks. Advances in Neural Information Processing Systems, 25, 1097�C1105. https://kr.nvidia.com/content/tesla/pdf/machine-learning/imagenet-classification-with-deep-convolutional-nn.pdf
Lagaros, N. D., & Papadrakakis, M. (2012). Applied soft computing for optimum design of structures. Structural and Multidisciplinary Optimization, 45(6), 787�C799. https://doi.org/10.1007/s00158-011-0741-9
Li, B., Qi, X., Lukasiewicz, T., & Torr, P. H. S. (2019a). Controllable text-to-image generation. preprint arXiv:1909.07083.
Li, B., Qi, X., Lukasiewicz, T., & Torr, P. H. S. (2020). ManiGAN: text-guided image manipulation. Proceedings of the IEEE/CVF Conference on Computer Vision and Pattern Recognition (CVPR). https://openaccess.thecvf.com/content_CVPR_2020/papers/Li_ManiGAN_Text-Guided_Image_Manipulation_CVPR_2020_paper.pdf
Li, Z., Yang, J., Liu, Z., Yang, X., Jeon, G., & Wu, W. (2019b). Feedback network for image super-resolution. Proceedings of the IEEE/CVF Conference on Computer Vision and Pattern Recognition, 3867�C3876. https://openaccess.thecvf.com/content_CVPR_2019/papers/Li_Feedback_Network_for_Image_Super-Resolution_CVPR_2019_paper.pdf
Liao, W. J., Lu, X. Z., Huang, Y. L., Zheng, Z., & Lin, Y. Q. (2021). Automated structural design of shear wall residential buildings using generative adversarial networks. Automation in Construction, 132, 103931. https://doi.org/10.1016/J.AUTCON.2021.103931
Liu, Y., De Nadai, M., Cai, D., Li, H., Alameda-Pineda, X., Sebe, N., & Lepri, B. (2020). Describe what to change: a text-guided unsupervised image-to-image translation approach. Proceedings of the 28th ACM International Conference on Multimedia, 1357�C1365. https://doi.org/10.1145/3394171.3413505
Lu, X. Z., Liao, W. J., Zhang, Y., & Huang, Y. L. (2022). Intelligent structural design of shear wall residence using physics-enhanced generative adversarial networks. Earthquake Engineering & Structural Dynamics, 51(7), 1657-1676. https://doi.org/10.1002/eqe.3632
Lu, X. Z., Xu, Y. J., Tian, Y., Cetiner, B., & Taciroglu, E. (2021). A deep learning approach to rapid regional post-event seismic damage assessment using time-frequency distributions of ground motions. Earthquake Engineering & Structural Dynamics, 50(6), 1612�C1627. https://doi.org/https://doi.org/10.1002/eqe.3415
Mangal, M., & Cheng, J. C. P. (2018). Automated optimization of steel reinforcement in RC building frames using building information modeling and hybrid genetic algorithm. Automation in Construction, 90, 39�C57. https://doi.org/https://doi.org/10.1016/j.autcon.2018.01.013
McKinsey & Company. (2021). The next normal in construction. https://www.mckinsey.com/business-functions/operations/our-insights/the-next-normal-in-construction-how-disruption-is-reshaping-the-worlds-largest-ecosystem# (Accessed September 24, 2021)
Nauata, N., Chang, K. H., Cheng, C. Y., Mori, G., & Furukawa, Y. (2020). House-gan: relational generative adversarial networks for graph-constrained house layout generation. European Conference on Computer Vision, 162�C177. https://doi.org/10.1007/978-3-030-58452-8_10
Oh, S., Jung, Y., Kim, S., Lee, I., & Kang, N. (2019). Deep generative design: integration of topology optimization and generative models. Journal of Mechanical Design, 141(11). https://doi.org/10.1115/1.4044229
Pan, X., & Yang, T. Y. (2020). Postdisaster image-based damage detection and repair cost estimation of reinforced concrete buildings using dual convolutional neural networks. Computer-Aided Civil and Infrastructure Engineering, 35(5), 495�C510. https://doi.org/https://doi.org/10.1111/mice.12549
Qian, J. R., Zhao, Z. Z., Ji, X. D., Ye, L. P. (2018). Design of tall building structures. China Architecture & Building Press, Beijing. (in Chinese)
Ramesh, A., Pavlov, M., Goh, G., Gray, S., Voss, C., Radford, A., ... & Sutskever, I. (2021, July). Zero-shot text-to-image generation. In International Conference on Machine Learning (pp. 8821-8831). PMLR.
Rezatofighi, H., Tsoi, N., Gwak, J., Sadeghian, A., Reid, I., & Savarese, S. (2019). Generalized intersection over union: a metric and a loss for bounding box regression. Proceedings of the IEEE/CVF Conference on Computer Vision and Pattern Recognition, 658�C666. https://openaccess.thecvf.com/content_CVPR_2019/papers/Rezatofighi_Generalized_Intersection_Over_Union_A_Metric_and_a_Loss_for_CVPR_2019_paper.pdf
Sharma, S., & Kumar, V. (2021). An efficient image super resolution model with dense skip connections between complex filter structures in generative adversarial networks. Expert Systems with Applications, 186, 115780. https://doi.org/10.1016/J.ESWA.2021.115780
Shu, D., Cunningham, J., Stump, G., Miller, S. W., Yukish, M. A., Simpson, T. W., & Tucker, C. S. (2019). 3D design using generative adversarial networks and physics-based validation. Journal of Mechanical Design, 142(7). https://doi.org/10.1115/1.4045419
Sim, E. A., Lee, S., Oh, J., & Lee, J. (2021). GANs and DCGANs for generation of topology optimization validation curve through clustering analysis. Advances in Engineering Software, 152, 102957. https://doi.org/10.1016/J.ADVENGSOFT.2020.102957
Simonyan, K., & Zisserman, A. (2015). Very deep convolutional networks for large-scale image recognition. preprint arXiv:1409.1556.
Sun, H., Burton, H. V., & Huang, H. (2021). Machine learning applications for building structural design and performance assessment: State-of-the-art review. Journal of Building Engineering, 33, 101816. https://doi.org/10.1016/J.JOBE.2020.101816
Szegedy, C., Vanhoucke, V., Ioffe, S., Shlens, J., & Wojna, Z. (2016). Rethinking the inception architecture for computer vision. Proceedings of the IEEE Conference on Computer Vision and Pattern Recognition (CVPR). https://www.cv-foundation.org/openaccess/content_cvpr_2016/papers/Szegedy_Rethinking_the_Inception_CVPR_2016_paper.pdf
Tafraout, S., Bourahla, N., Bourahla, Y., & Mebarki, A. (2019). Automatic structural design of RC wall-slab buildings using a genetic algorithm with application in BIM environment. Automation in Construction, 106, 102901. https://doi.org/https://doi.org/10.1016/j.autcon.2019.102901
Wang, T. C., Liu, M. Y., Zhu, J. Y., Tao, A., Kautz, J., & Catanzaro, B. (2018). High-resolution image synthesis and semantic manipulation with conditional gans. Proceedings of the IEEE Conference on Computer Vision and Pattern Recognition, 8798�C8807. https://openaccess.thecvf.com/content_cvpr_2018/papers/Wang_High-Resolution_Image_Synthesis_CVPR_2018_paper.pdf
Wikipedia. https://en.wikipedia.org/wiki/Curse_of_dimensionality (Accessed September 24, 2021)
Zhang, H., Xu, T., Li, H., Zhang, S., Wang, X., Huang, X., & Metaxas, D. N. (2017). Stackgan: text to photo-realistic image synthesis with stacked generative adversarial networks. Proceedings of the IEEE International Conference on Computer Vision, 5907�C5915. https://openaccess.thecvf.com/content_ICCV_2017/papers/Zhang_StackGAN_Text_to_ICCV_2017_paper.pdf
Zhang, H., Xu, T., Li, H., Zhang, S., Wang, X., Huang, X., & Metaxas, D. N. (2019). StackGAN++: realistic image synthesis with stacked generative adversarial networks. IEEE Transactions on Pattern Analysis and Machine Intelligence, 41(8), 1947�C1962. https://doi.org/10.1109/TPAMI.2018.2856256
Zhang, Y., & Mueller, C. (2017). Shear wall layout optimization for conceptual design of tall buildings. Engineering Structures, 140, 225�C240. https://doi.org/https://doi.org/10.1016/j.engstruct.2017.02.059
Zhu, J. Y., Zhang, R., Pathak, D., Darrell, T., Efros, A. A., Wang, O., & Shechtman, E. (2017). Multimodal image-to-image translation by enforcing bi-cycle consistency. Advances in Neural Information Processing Systems, 465�C476. https://papers.nips.cc/paper/2017/file/819f46e52c25763a55cc642422644317-Paper.pdf
Appendix A
The results of hyperparameter analysis are shown in Table A.1-A.4, indicating that various hyperparameters can affect the design performance differently. Wherein, batch size causes the most significant impact. As batch size increases from 1 to 10, the corresponding design performance first increases and then decreases, with the most effective value ranging from 2 to 4. The primary reason for batch size causing the significant impact is that: with a large batch size value, more images and texts are trained, and the corresponding loss is obtained in the same batch; and it will induce the obtained features to be more uniform in the same batch, which is not conducive to learn specific design image features under different design conditions. Furthermore, as shown in Figure A.1, the AI-designed results are almost not different from each other with varying design conditions, when batch size = 10. Hence, although a large batch size can accelerate the training convergence, it seems not beneficial for this study.
Consequently, the most suitable value range of batch size is 2-4, and the optimal ��Gword, ��Dword, and learning rate are approximately 1, 1, and 0.2, respectively.
Table A.1 Analysis results of hyperparameter ��Gword (text loss weights of the generator)
|
��Gword |
|||||||
|
Groups |
0.01 |
0.1 |
1 |
10 |
100 |
|max-min|/max |
|
|
G7-H1 |
mean |
0.4508 |
0.4535 |
0.4741 |
0.4214 |
0.4459 |
11% |
|
std |
0.1596 |
0.1642 |
0.1783 |
0.1682 |
0.1717 |
||
|
G7-H2 |
mean |
0.5447 |
0.5595 |
0.5498 |
0.5755 |
0.5476 |
5% |
|
std |
0.1041 |
0.0842 |
0.0969 |
0.0918 |
0.1027 |
||
|
G8-H1H2 |
mean |
0.6323 |
0.6417 |
0.6564 |
0.6570 |
0.6346 |
4% |
|
std |
0.2007 |
0.1939 |
0.1973 |
0.1897 |
0.1720 |
||
Table A.2 Analysis results of hyperparameter ��Dword (text loss weights of the discriminator)
|
��Dword |
|||||||
|
Groups |
0.01 |
0.1 |
1 |
10 |
100 |
|max-min|/max |
|
|
G7-H1 |
mean |
0.4503 |
0.4417 |
0.4730 |
0.4588 |
0.4607 |
7% |
|
std |
0.1622 |
0.1684 |
0.1744 |
0.1625 |
0.1603 |
||
|
G7-H2 |
mean |
0.5459 |
0.5501 |
0.5423 |
0.5477 |
0.5585 |
3% |
|
std |
0.1053 |
0.0897 |
0.0867 |
0.0835 |
0.0973 |
||
|
G8-H1H2 |
mean |
0.6398 |
0.6418 |
0.6515 |
0.6519 |
0.6518 |
2% |
|
std |
0.1946 |
0.1889 |
0.1953 |
0.1922 |
0.1922 |
||
Table A.3 Analysis results of hyperparameter learning rate
|
learning rate |
|||||||
|
Groups |
0.0001 |
0.0002 |
0.0003 |
0.0004 |
0.0005 |
|max-min|/max |
|
|
G7-H1 |
mean |
0.4575 |
0.4741 |
0.4654 |
0.4559 |
0.4404 |
7% |
|
std |
0.1698 |
0.1783 |
0.1664 |
0.1652 |
0.1460 |
||
|
G7-H2 |
mean |
0.5582 |
0.5498 |
0.5726 |
0.5340 |
0.5501 |
7% |
|
std |
0.1005 |
0.0969 |
0.1004 |
0.0974 |
0.0845 |
||
|
G8-H1H2 |
mean |
0.6443 |
0.6564 |
0.6528 |
0.6473 |
0.6404 |
2% |
|
std |
0.1911 |
0.1973 |
0.1756 |
0.1884 |
0.1916 |
||
Table A.4 Analysis results of hyperparameter batch size
|
batch size |
||||||||
|
Groups |
1 |
2 |
4 |
6 |
8 |
10 |
|max-min|/max |
|
|
G7-H1 |
mean |
0.4394 |
0.4741 |
0.4738 |
0.4040 |
0.3281 |
0.3281 |
31% |
|
std |
0.1523 |
0.1783 |
0.1718 |
0.1677 |
0.1501 |
0.1501 |
||
|
G7-H2 |
mean |
0.5579 |
0.5498 |
0.5529 |
0.5481 |
0.5099 |
0.5099 |
9% |
|
std |
0.0994 |
0.0969 |
0.0912 |
0.0964 |
0.0895 |
0.0895 |
||
|
G8-H1H2 |
mean |
0.6339 |
0.6564 |
0.6552 |
0.6394 |
0.5566 |
0.5566 |
15% |
|
std |
0.2011 |
0.1973 |
0.1885 |
0.1756 |
0.1369 |
0.1369 |
||