1. Introduction
The design of frame beams is a critical task in the frame structure design [1]. The plane layout of the frame structure is flexible, the building shapes are diverse, and some nonrectangular irregular plan shapes complicate the beam arrangement of the frame structure [2]. Some existing studies have proposed automatic arrangement methods for frame beams. For example, Herr and Fischer [3] proposed an arrangement method for frame structure beams based on human- and machine-readable notation. Nimtawat and Nanakorn [4¨C5] developed a method for the layout design of beams and slabs in frame structures based on genetic algorithms. However, existing research often relies on predefined rules, and it is difficult to meet the challenges of frame structure design with a free-form layout. The neural network method has the ability to learn from experience, and guide and generate new designs. Singaravel et al. [6] used convolutional neural networks to assess energy demand for early design and design strategies quickly. Liao et al. [7], Lu et al. [8], Pizarro et al. [9], and Pizarro and Massone [10] studied the layout design method for shear walls based on convolutional generative adversarial networks and convolutional neural networks. However, few studies have been conducted on the layout design of frame structures based on neural network methods. Ampanavos et al. [11] used a convolutional neural network for the early plan layout design of a frame structure. However, their method was mainly used for simple frames. Consequently, this study aims to investigate a neural-network-based beam arrangement method for plane-regular and plane-irregular frame structures.
The beams and columns of a frame structure have natural topological connection relationships, and their flexible arrangement in space makes it difficult to efficiently and universally represent the frame structure using gridded Euclidean image data. However, the frame structure can be considered as a natural graph owing to its spatial topological features. Previous studies used graphs to represent topological features of building structures. Ślusarczyk [12] adopted graphs to represent the truss-structure topology of the transmission towers and optimized the topology using evolutionary methods. Langenhan et al. [13] adopted graphs to represent the topology of the space to serve the retrieval of building information models. Moreover, there are some precedents for using graphs to represent frame structures [14¨C16], showing that using the graph concept to represent the frame structure is reasonable and convenient. However, in existing research, the graph concept is often used to represent the frame structure only, and design optimization is conducted in combination with the optimization algorithm. Few studies have been conducted on frame structure layout designs using graph neural networks (GNNs).
For non-Euclidean data, such as graphs, traditional deep neural network methods (e.g., convolutional and recurrent neural networks) are not applicable. By contrast, GNNs that operate directly on graphs are an adequate coping method [17¨C19]. As a data-driven geometric deep learning algorithm, the application of GNN in the fields of drug molecule generation and protein space prediction reflects the apparent advantages of GNN for data structures with significant topological features [20].
GNNs and other types of neural networks that incorporate the graph concept also have applications in architectural design [21¨C26]. However, very few related studies have utilized GNNs for structural layout design. Critically, GNNs require sufficient data for training. Meanwhile, in the field of civil engineering, to date, there is no high-quality massive dataset of engineering structures, particularly for frame structures with irregular plane shapes. Consequently, there is a severe shortage of frame structure data for the training and learning of GNNs. Moreover, research on graph representation methods suitable for frame structures is insufficient, hindering the application of GNNs in frame-structure layout design.
In this study, an intelligent beam layout design method for frame structures based on GNNs is presented in Section 3. Section 4 introduces a large-scale dataset generation method for training GNN models. Section 5 presents the graph representation method of frame structures, GNN models, and corresponding neural network architectures. Section 6 discusses the performance differences corresponding to the different graph representations, data features, and GNN models. Section 7 describes the application and verification of the proposed method based on real-world frame structure cases.
2. Literature Review
2.1 Intelligent Architectural and Structural Design
Topology optimization, heuristic algorithms, and neural network methods are widely used in architectural and structural design to optimize structural shape and component size [10, 15, 27¨C31]. In addition to the studies of Nimtawat and Nanakorn [4, 5] and Herr and Fischer [3], Zhao et al. [32] used predefined topological rules to determine the beam arrangement of a frame structure. However, these studies rely on predefined rules. Unlike rule-based and optimization-based research, the neural network method, a data-driven approach, can learn design experience from existing data. Convolutional neural networks were used by Pizarro et al. [9] and Pizarro and Massone [10] to implement the layout design of the shear wall components. Furthermore, Liao et al. [7] and Lu et al. [8] developed generative adversarial networks and physics-enhanced generative adversarial networks for shear wall structural design. These studies show that the deep learning-based design method is highly efficient and can generate scheme designs of shear wall structures. However, limited neural network application is reported for the frame structure layout design.
2.2 GNN and Its Application in Architecture and Structure
GNNs can be divided into spectral-based GNNs and spatial-based GNNs [17¨C19]. Representative spectral-based GNNs are ChebyNet [33] and graph convolutional network [34]. Spatial-based GNNs aggregate adjacent node information directly in space, and the message-passing neural network (MPNN) is proposed as a framework for spatial-based graph convolution [35¨C37]. As a spatial-based GNN, GraphSAGE implements node embedding through a common aggregation function, which has a stronger generalization ability to unseen nodes [38]. The attention mechanism can further improve the aggregation operations in GNNs [39¨C40].
GNNs and other neural networks that incorporate the concept of graphs have applications in architectural design [22]. Chang et al. [21] adopted GNNs to generate 3D volumetric designs. Wang et al. [23] adopted GNNs for room type classification. Jiang et al. [24] used GNNs to detect objects from the floor plan drawings. Nauata et al. [25¨C26] adopted generative adversarial networks for graph-constrained house layout generation. However, GNNs are rarely used in the design of structural layouts. Some studies used graphs to represent frame structures. Kaveh and Shahrouzi [14] used graphs to represent the vertical plane of frame structures and optimized the layout of frame braces using memetic algorithms. Chang and Cheng [15] used graphs and genetic algorithms to optimize the cross sections of frame beams and columns. Hayashi and Ohsaki [16] used a combination of graphs and reinforcement learning for the cross-sectional design of steel frames.
2.3 Research Gap
Existing research on frame-structure beam layout design frequently relies on predefined rules, which are difficult to apply to frame structure design with a free-form layout. Convolutional neural networks, while having great potential for generative architectural and structural design, are more suitable for gridded Euclidean pixel images. Frame structures have the natural topological characteristics of graphs. Existing research shows that using the graph concept to represent frame structures is feasible. Moreover, the development of GNNs show the great potential of GNNs in structural layout design. However, no GNN method is currently available for frame structure beam arrangement, and there is a lack of research on graph representation methods suitable for frame structure layout design. Moreover, the lack of high-quality engineering structure data also restricts the application of GNN in frame structure layout design.
To address these gaps, this work aims to handle the following three scientific challenges in applying GNNs to the beam layout design of frame structures: (1) a parameterized generation method of large-scale frame plane layouts, (2) the suitable graph representation methods of frame structures, and (3) the performance of different GNN models.
3. Design Method of Frame Beam Layout using GNN
This study proposes a data-driven beam layout design method for frame structures based on the graph representation method and GNN model, as shown in Figure 1. The critical problem to be solved in this work is that, given the layout of frame columns, the layout design of frame beams is to be realized by predicting whether there is a frame beam between any two columns. The proposed method includes three parts: (1) parameterized generation of frame structure data, (2) GNN for the frame beam layout design and model training, and (3) model application. The parameterized generation of frame structure data provides large-scale data for training and testing GNNs. Utilizing this large-scale data, a novel GNN model was developed for beam layout design. When the model is applied to a real-world building design, the layout of the frame columns is input into the trained GNN model, and the frame beam layout scheme is then generated. The specific process is as follows.
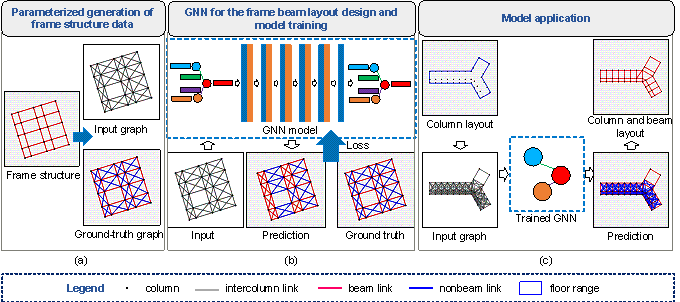
Figure 1 Design method of frame beam layout
(1) Parameterized generation of frame structure data. To solve the contradiction between the demand for a large amount of high-quality data for training and the lack of well-organized engineering structure data, this study proposed a parameterized generation method for large-scale frame structure data for training GNNs. Rectangular, L-shaped, arc-shaped, and Y-shaped frame structure data were generated parametrically. The arrangement of the frame beams is determined by identifying whether there is a frame beam between two columns. Therefore, two types of connection relationships between frame columns are considered: beam and nonbeam links. As shown in Figure 1a, each frame structure corresponds to an input graph and ground-truth graph. The input graph includes frame columns and intercolumn links. The ground-truth graph includes frame columns and predetermined beam/nonbeam links. The GNN is trained to identify whether the intercolumn link between the two columns is a beam or nonbeam link. The details are provided in Section 4.
(2) GNN for the frame beam layout design and model training (Figure 1b). The frame structure can be represented using different graph data formats. An appropriate graph representation of the data is the foundation of GNN research, and the performances of different graph representations of frame structures are compared. Furthermore, many GNNs have been proposed in the literature, the performances of classical GNNs have been discussed, and a novel GNN model for the beam layout design has been proposed. The features required by the GNN models to represent the frame structures are also discussed. From the generated large-scale frame structure data, the graph representation, GNN model, and graph features with the best performances were identified. See Sections 5 and 6 for further details.
(3) Model application. As shown in Figure 1c, when applying the GNN model for beam layout design, it is necessary to construct graph data based on the position of the frame columns as the input of the model. Meanwhile, the predetermined floor range can be used as the constraint condition for the preliminary screening of the intercolumn links. The beam layout can be designed by inputting columns and intercolumn links into the well-trained GNN model. Several applications to real-world structures are presented in Section 7 to demonstrate the accuracy of the proposed method.
4. Parameterized Generation Method of Dataset
The plane layout of the frame structure is diverse. This study discusses four common plane shapes of frame structures: rectangle, L shape, arc shape, and Y shape [41]. A large-scale dataset of these four frame-structure plane shapes was generated and used to train and test the GNN model for the beam layout design. Each frame structure in the dataset corresponds to a graph pair, including an input graph and a ground-truth graph. The input graph included frame columns and intercolumn links, and the ground-truth graph included frame columns and predetermined beam/nonbeam links. The dataset must satisfy the following rules.
(1) The beams were straight beams connecting the load-bearing frame columns at both ends.
(2) The length of the generated frame beam is within a fixed range.
(3) There are no joints inside the structure (structures with joints can be designed as different independent structures).
(4) The intercolumn link must be within the preset floor plane range of the building.
A total of 20,000 data were randomly generated for each frame type. According to Shi and Liang [2], the typical column spacing of frame structures is generally between 3.3 m and 7.5 m. Similarly, according to Qian et al. [41], the small column spacing of the frame structure is 4¨C6 m, whereas the large column spacing is 7¨C10 m. Therefore, this study focuses on the intercolumn links with a column spacing not exceeding 10 m. These intercolumn links are divided into two categories: beam and nonbeam links. Beam links are beams with a length between 3.0 m and 8.0 m, and the rest are nonbeam links. These beam and nonbeam links were the ground truth for training the GNN models. The distribution histograms of the control parameters of the frame structure data corresponding to different plane shapes are presented in Appendix A, which proves that the parameters are rationally distributed in the concerned range to prevent data bias.
4.1. Rectangular Frames
In the x and y directions of the rectangular frame, the span number is random between 1 and 10 spans, the length of each span is random between 3.0 m and 8.0 m, and the modulus of the span length is 0.1 m. Except for beam links, any intercolumn link less than 10 m long that does not pass through other columns is a nonbeam link. Finally, a random clockwise rotation of 1ˇă to 360ˇăaround the coordinate origin (0, 0) was performed, with 1ˇă as the modulus.
The steps and schematic of rectangular frame structure generation are shown in Figures 2a and 2b, respectively. In Figure 2a, Nx and Ny are the span numbers in the x and y directions, respectively; Lxi is the span length of the i-th span in the x direction; Lyj is the span length of the j-th span in the y direction; ¦Č is the clockwise rotation angle of the rectangular frame; randomint() is a function for taking random integers; and random() is a function for taking random numbers. Typical generated rectangular frames are shown in Figure 2c.
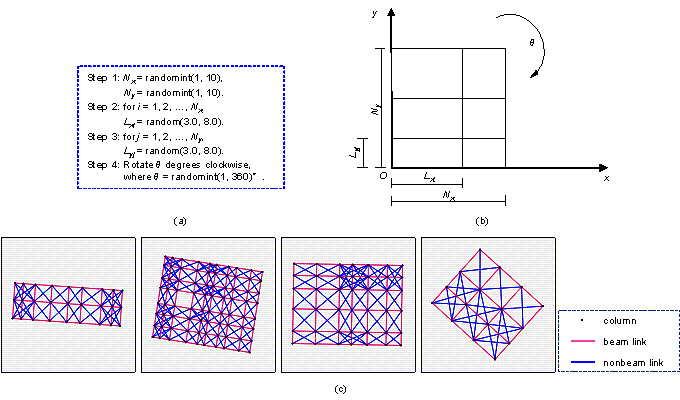
Figure 2 Rectangle Frames: (a) steps of dataset generation, (b) schematic of dataset generation, and (c) typical cases of dataset.
4.2. L-shaped Frames
An L-shaped frame structure can be considered as a combination of two rectangular frame structures. The steps and schematic of data generation are shown in Figures 3a and 3b, respectively. In the x direction, the span numbers Nx1 and Nx2 of the two rectangles are random between one and five spans. In the y direction, the span number Ny1 of the first rectangle is random between 2 and 10 spans, and the span number Ny2 of the second rectangle is random between 1 and Ny1 spans. Moreover, in the y direction, the length of each span of the second rectangle is precisely the same as that of the first rectangle. A random clockwise rotation between 1ˇă and 360ˇă around the coordinate origin (0, 0) was performed. Nx1 and Nx2 in Figure 3a are the span numbers of the two rectangles in the x direction, Ny1 and Ny2 are the span numbers of the two rectangles in the y direction, L1xi and L2xi are the span lengths of the two rectangles in the x direction, L1yj and L2yj are the span lengths of the two rectangles in the y direction, and the other parameters have the same meaning as those in Subsection 4.1. Typical generated L-shaped frames are shown in Figure 3c.
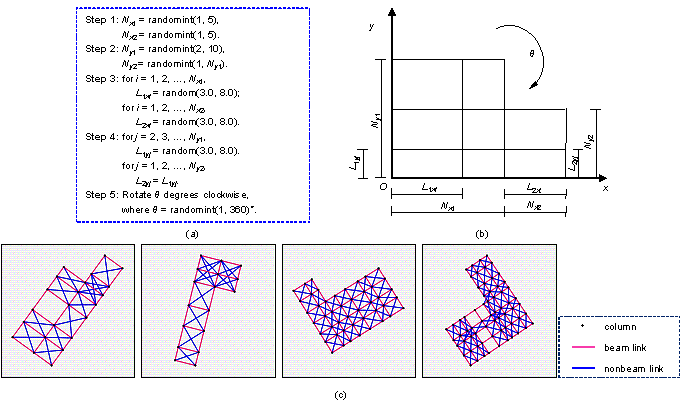
Figure 3 L-shaped Frames: (a) steps of dataset generation, (b) schematic of dataset generation, and (c) typical cases of dataset.
4.3. Arc-shaped Frames
Arc-shaped frame structure data were generated using a polar coordinate system. The radial span number Nr is random between 1 and 4 spans, and the angular span number N¦Č is random between 1 and 10 spans. The steps and schematic of data generation are shown in Figures 4a and 4b, respectively. The innermost radial span length L0 ranges from 12.0 m to 30.0 m, and the other radial span lengths are still in the range of 3.0 m to 8.0 m. The sum of all the angles should not exceed 360ˇă. To ensure that the innermost angular frame beam length of the arc-shaped frame is longer than 3.0 m, the lower limit of the angle of each span in the angular direction was 15ˇă. Similar to the rectangular and L-shaped frames, a random clockwise rotation between 1ˇă and 360ˇăaround the coordinate origin (0, 0) was performed. In the steps shown in Figure 4a, Nr and N¦Č are the span numbers in the radial and angular directions, respectively; L0 is the length of the innermost radial span that intersects the circle center; Li is the length of each span of the i-th radial span; ¦Či is the angle of each span in the angular direction; ¦Á is the clockwise rotation angle of the frame; and the other parameters have the same meaning as those in Subsection 4.1. Typical generated arc-shaped frames are shown in Figure 4c.
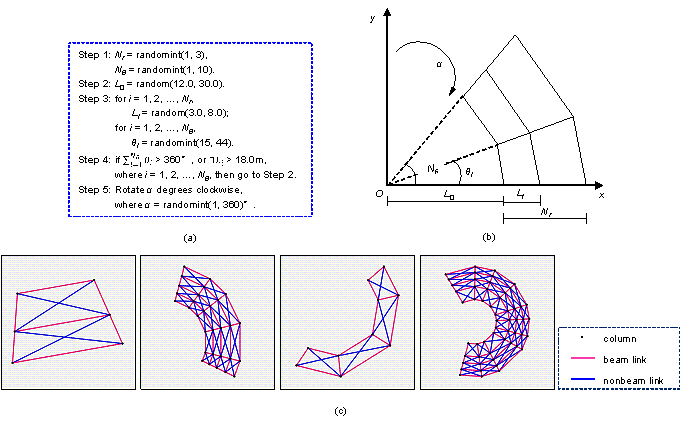
Figure 4 Arc-shaped Frames: (a) steps of dataset generation, (b) schematic of dataset generation, and (c) typical cases of dataset.
4.4. Y-shaped Frames
The Y-shaped frame can be considered a combination of three rectangular frame structures, and the sides of the three rectangular frames can form a triangle. The steps and schematic of data generation are shown in Figures 5a and 5b, respectively. The span numbers of the three rectangles are random between 1 and 10 spans in the x and y directions, and the span lengths are all random between 3.0 m and 8.0 m. The side lengths of the three rectangles on the y axis are denoted as a, b, and c. If a, b, and c cannot form a triangle, then the Y-shaped frame structure is regenerated. After fixing the second rectangle, the first and third rectangles are rotated around points A and B to form a Y-shaped frame structure. A random clockwise rotation between 1ˇă and 360ˇăaround the coordinate origin (0, 0) is required. In the steps shown in Figure 5a, Nx1, Nx2, and Nx3 are the span numbers of the three rectangles in the x direction; Ny1, Ny2, and Ny3 are the span numbers of the three rectangles in the y direction; L1xi, L2xi, and L3xi are the span lengths of the i-th span of the three rectangles in the x direction; L1yj, L2yj, and L3yj are the span lengths of the j-th span of the three rectangles in the y direction; and the other parameters have the same meaning as those in Subsection 4.1. Typical generated Y-shaped frames are shown in Figure 5c.
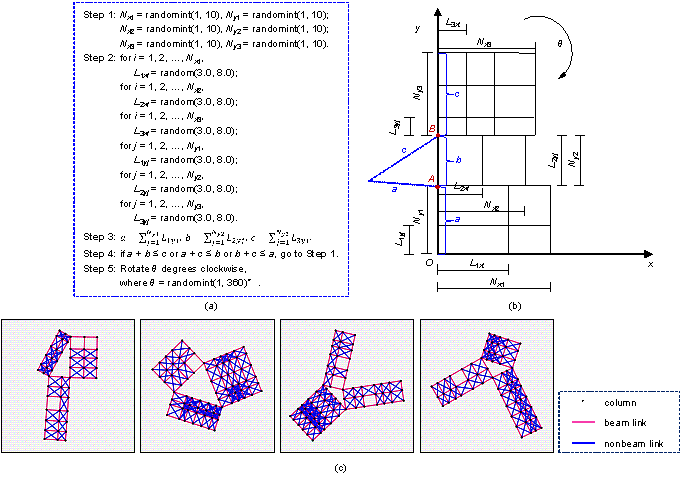
Figure 5 Y-shaped Frames: (a) steps of dataset generation, (b) schematic of dataset generation, and (c) typical cases of dataset.
The generated 80,000 frame structures also require normalization before being used for neural network training. First, find the upper and lower limits of the coordinates of all frame structures in the x and y directions successively, and then find the center of each circumscribed rectangle and translate the center of each frame structure to the origin (0, 0). Subsequently, the maximum side length Lmax of all circumscribed rectangles is obtained. The coordinates of all frame structures are then normalized by Lmax, as shown in Equation (1).
|
cnormalized = 2ccentered / Lmax, |
(1) |
where cnormalized is the normalized coordinate and ccentered is the coordinate centered on the origin. After normalization, all coordinates were in [-1, 1].
After the data generation, from each type of frame structure, 72% are randomly selected as the training set, 8% as the validation set, and 20% as the test set.
5. Graph Representation and Graph Neural Networks
5.1. Graph Representation of Frame Structure
The frame structure has an intuitive topological form, with beams and columns as its key components. For the dataset used in this study, the frame structure data included columns, beam links, and nonbeam links.
The graph consists of a set ![]() of nodes and a set
of nodes and a set ![]() of edges, which can be expressed as:
of edges, which can be expressed as:
|
|
(2) |
Chang and Cheng [15] used graph nodes to represent the beams and columns of frame structures, and Hayashi and Ohsaki [16] used graph nodes to represent the beam-to-column intersections of frame structures and graph edges to represent beams or columns. This study discusses the following three graphical representations of frame structures, as shown in Figure 6:
(1) Case-Normal: graph nodes represent columns, and graph edges represent beam and nonbeam links;
(2) Case-Inverse: graph edges represent columns, and graph nodes represent beam and nonbeam links;
(3) Case-AllNodes: graph nodes represent all columns, beam links, and nonbeam links.
For Case-Normal, the frame columns and intercolumn links are represented as graph nodes and graph edges, respectively, and the topological representation of the graph is intuitively consistent with the actual frame structure. However, for Case-Inverse, the intercolumn links are represented as graph nodes, and the graph edges only represent the connectivity of two intercolumn links. In Case-Inverse, if two intercolumn links share the same frame column, there is an edge between the two nodes representing intercolumn links, and the edge indicates that the two intercolumn links are connected. In a frame structure, there are usually multiple intercolumn links sharing the same column, and an edge is required between any two nodes that represent the intercolumn links. Therefore, a column is represented by multiple graph edges with identical features. For Case-AllNodes, because all the columns and intercolumn links are represented by graph nodes, graph edges only represent their connections and have no physical properties.
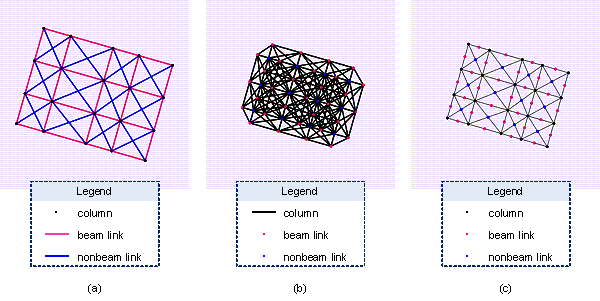
Figure 6 Three graph representation cases: (a) Case-Normal, (b) Case-Inverse, and (c) Case-AllNodes. In (b) and (c), when an intercolumn link is drawn as a node, its position is the midpoint of the link segment, so there are overlaps in the schematic.
This study aims to determine whether a structural beam exists between two columns of a frame structure (i.e., an intercolumn link can be distinguished as a beam link or nonbeam link). For Case-Normal, intercolumn links are represented by graph edges; therefore, the problem is the binary classification of graph edges. For Case-Inverse and Case-AllNodes, intercolumn links are represented by graph nodes; therefore, the problem is the classification prediction of graph nodes.
In the three graph representations, the features of the frame column are only the column coordinates, whereas the features of the intercolumn link include the column coordinates at both ends of the link and the link length, as shown in Table 1.
Table 1 Graph features of the three graph representations
|
Graph representations |
Graph elements |
Features |
|
Case-Normal |
Column |
[xc, yc] |
|
Intercolumn link |
[xleft, yleft, xright, yright, length] |
|
|
Case-Inverse |
Column |
[xc, yc] |
|
Intercolumn link |
[xleft, yleft, xright, yright, length] |
|
|
Case-AllNodes |
Column |
[0, 1, xc, yc, xc, yc, 0] |
|
Intercolumn link |
[1, 0, xleft, yleft, xright, yright, length] |
xc and yc are the column coordinates, xleft and yleft are the column coordinates at one end of the link, and xright and yright are the column coordinates at the other end of the link; length is the link length.
For Case-Normal and Case-Inverse, columns and intercolumn links of frame structures are represented by graph edges and nodes; therefore, the features of columns and intercolumn links do not need to have identical dimensions when the graph data are applied to the GNN models. However, for Case-AllNodes, both columns and intercolumn links are represented by graph nodes; therefore, the features of columns and intercolumn links need to have identical dimensions. Specifically, as shown in Table 1, the first two elements of the column and intercolumn link features of Case-AllNodes are two-category one-hot codes that can distinguish between columns and intercolumn links. The following four elements of the intercolumn link feature are the column coordinates at both ends of the link. The corresponding four elements of the column feature are copies of the column coordinates, which ensures that the dimensions of the column feature are identical to those of the intercolumn link feature. The last element of the feature is the length. Note that the column has no length feature. Therefore, the corresponding element of the column is 0.
5.2. Graph Neural Network Layers
The GNN layers significantly influence the performance of the GNN model. Three GNN layers, namely graphConv, graphSAGE, and graphSAGE-Frame, are discussed herein. The models were built on the platforms of Deep Graph Library [42] and PyTorch [43].
5.2.1. graphConv Layer
Kipf and Welling [34] proposed the classic graph convolutional network (GCN). It is a localized first-order approximation of spectral graph convolution, which ensures that a node is only influenced by the first-order neighbor nodes around it. Stacking k layers of first-order graph convolution can extend the influence of nodes to k-order neighbor nodes. Each layer of the graph convolution can be defined as shown in Equations (3) and (4) [37]:
|
|
(3) |
|
|
|
(4) |
where ![]() is the nonlinear activation function,
is the nonlinear activation function, ![]() is the node vector of the k-th layer,
is the node vector of the k-th layer, ![]() is the learnable weight parameter of the k-th layer,
is the learnable weight parameter of the k-th layer,
![]() is the adjacency matrix of the graph, and
is the adjacency matrix of the graph, and ![]() is the degree matrix of the graph.
is the degree matrix of the graph.
5.2.2. graphSAGE Layer
Hamilton et al. [38] proposed an inductive learning GNN model, and its core embedding generation algorithm is
Algorithm 1 Embedding generation algorithm of graphSAGE
|
Input: Graph
Output: The embedding
vector for each node |
|
|
|
|
|
|
|
|
|
|
|
|
|
|
|
|
|
|
Commonly used aggregator functions include the mean, LSTM,
and pooling aggregators [38]. The mean aggregator is adopted herein, which is
built based on the Deep Graph Library [42], which is a graph neural network
tool library. The corresponding ![]() is given by Equation (5):
is given by Equation (5):
|
|
(5) |
where ![]() is the nonlinear activation function,
is the nonlinear activation function, ![]() is the node feature, and
is the node feature, and ![]() represents the neighbor node set of node v.
represents the neighbor node set of node v.
5.2.3. graphSAGE-Frame Layer
An improved algorithm based on the graphSAGE layer, that
is, the graphSAGE-Frame layer, is proposed in this work. During message passing,
the features of the edges and nodes are simultaneously aggregated. Following
the construction code of the neural network of Wang et al. [23],
the features of node v, neighbor node u, and the edges between
the two nodes are first concatenated. Subsequently, the concatenated features
are input into the fully connected network to obtain preliminary aggregated
features. The obtained preliminary aggregated features are then summed to
obtain the neighbor node feature ![]() . The difference between the graphSAGE-Frame layer and graphSAGE layer
is the calculation of
. The difference between the graphSAGE-Frame layer and graphSAGE layer
is the calculation of ![]() , as shown in Equation (6):
, as shown in Equation (6):
|
|
(6) |
where ![]() is the nonlinear activation function,
is the nonlinear activation function, ![]() is the learnable weight parameter,
is the learnable weight parameter, ![]() is the graph node feature,
is the graph node feature, ![]() is the graph edge feature, v and u represent
nodes, and
is the graph edge feature, v and u represent
nodes, and ![]() represents the neighbor node set of node v.
represents the neighbor node set of node v.
After obtaining the neighbor node feature ![]() of node v, it is concatenated with the features
of node v, and the concatenated features are then inputted into the
fully connected network to obtain the embedding feature
of node v, it is concatenated with the features
of node v, and the concatenated features are then inputted into the
fully connected network to obtain the embedding feature ![]() of node v. As shown in Equation (7):
of node v. As shown in Equation (7):
|
|
(7) |
where ![]() is the nonlinear activation function,
is the nonlinear activation function, ![]() is the learnable weight parameter,
is the learnable weight parameter, ![]() is the graph node feature, v and u represent
nodes, and
is the graph node feature, v and u represent
nodes, and ![]() represents the neighbor node set of node v.
represents the neighbor node set of node v.
A simple schematic of this process is shown in Figure 6. The graph in Figure 6 has three nodes, denoted as nodes A, B, and C, and their features are hA, hB, and hC, respectively. There are two edges in Figure 6: one edge connects nodes A and B and the other edge connects nodes A and C. The features of the two edges were eAB and eAC. The target node is node A, and nodes B and C are neighbor nodes of node A. For the target node A and the neighbor node B, first, features hA and hB of the neighbor nodes A and B and the feature eAB of the edge between the two nodes are concatenated. The concatenated features are then input into a predefined fully connected network to obtain the preliminary aggregated feature h'B. For the target node A and the neighbor node C, the same method can be used to obtain the preliminary aggregated feature h'C. Subsequently, the obtained preliminary aggregated features are summed to obtain the neighbor node feature h'B + h'C. Subsequently, the neighbor node feature h'B + h'C and target node feature hA are concatenated, and the concatenated features are inputted into a predefined fully connected network. Finally, the embedding feature vector hAnew of the target node can be obtained.
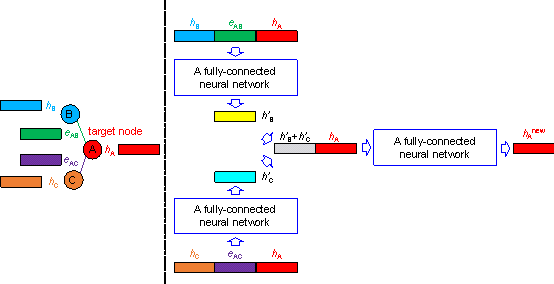
Figure 6 Schematic of graphSAGE-Frame layer.
5.3. Graph Neural Network Architecture
Multilayer GNNs were built based on the above three types
of GNN layers. The network architecture is shown in Figure 7a. The GNN layer
can be the graphConv, graphSAGE, and graphSAGE-Frame layers, leading to three
GNN models: Model-graphConv, Model-graphSAGE, and Model-graphSF (i.e., the
abbreviation of Model-graphSAGE-Frame). For the graph representation of Case-Inverse
and Case-AllNodes, the layout design of the frame beams is a node classification
problem of the GNN. Therefore, the above multilayer GNN architecture can be
directly adopted, as shown in Figure 7a. For Case-Normal, frame columns are
represented as graph nodes and intercolumn links are represented as graph
edges. Therefore, the problem of identifying whether a beam exists between
two frame columns is a link prediction problem of the GNN (i.e., the problem
of predicting the potential relationship between two nodes). To solve such
link prediction problems, the embedding features ![]() and
and ![]() of the node pair u and v are computed.
Then, the embedding features
of the node pair u and v are computed.
Then, the embedding features ![]() and
and ![]() are input into the function shown in Equation (8) to predict
the connection probability yu,v between nodes
u and v.
are input into the function shown in Equation (8) to predict
the connection probability yu,v between nodes
u and v.
|
|
(8) |
A multilayer perceptron (MLP) network was used to generate
prediction vectors for each edge, the architecture of which is shown in Figure
7b. In addition to features ![]() and
and ![]() of the two nodes u and v, the feature
of the edge euv to be predicted between the two nodes u and v are fused
into the input features of the MLP network. Therefore, Equation (8) is expressed
as Equation (9) in this study.
of the two nodes u and v, the feature
of the edge euv to be predicted between the two nodes u and v are fused
into the input features of the MLP network. Therefore, Equation (8) is expressed
as Equation (9) in this study.
|
|
(9) |
where ![]() represents the edge feature of the edge euv, which is concatenated with
represents the edge feature of the edge euv, which is concatenated with ![]() and
and ![]() as the input feature, and
as the input feature, and ![]() is the MLP network in this study.
is the MLP network in this study.
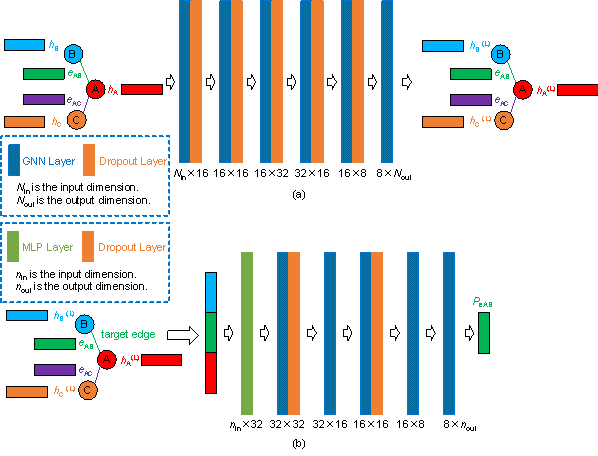
Figure 7 Schematic of (a) graph neural network and (b) MLP predictor.
6. Discussion on Performance of different GNN models and features
6.1. Influence of Graph Representations and Graph Neural Networks
Comparing the effects of different GNN models and graph representations on the results requires reasonable evaluation metrics. The accuracy, F1 score, precision, and recall of the test set are often used as evaluation metrics, and their calculation equations are shown in Equations (10)¨C(13). The calculation of these evaluation metrics requires the definition of four types of data: true positive (TP), false negative (FN), false positive (FP), and true negative (TN). The definitions of the four types of data are presented in Table 2. The accuracy and F1 score were used by the test sets as the evaluation metrics.
|
|
(10) |
|
|
|
(11) |
|
|
|
(12) |
|
|
|
(13) |
Table 2 Confusion matrix of this study
|
Prediction |
|||
|
Beam link (positive) |
Nonbeam link (negative) |
||
|
Ground truth |
Beam link (positive) |
True positive (TP) |
False negative (FN) |
|
Nonbeam link (negative) |
False positive (FP) |
True negative (TN) |
|
The results of the test set corresponding to the different GNN models and graph representations are presented in Table 3.
Table 3 Influence of Graph Representations and Graph Neural Networks
|
Graph Representations |
Performance |
Model-graphConv |
Model-graphSAGE |
|
|
Accuracy |
0.7762 |
0.7730 |
0.9959 |
|
|
F1 score |
0.7940 |
0.7753 |
0.9960 |
|
|
Case-Inverse |
Accuracy |
0.4836 |
0.9881 |
0.9997 |
|
F1 score |
ˇŞ*a |
0.9884 |
0.9997 |
|
|
Case-AllNodes |
Accuracy |
0.5164*b |
0.9233 |
0.9755 |
|
F1 score |
0.6811*b |
0.9268 |
0.9764 |
*a ˇ°ˇŞˇ± means that all intercolumn links were predicted to be nonbeam links, and the F1 score cannot be calculated because the denominator is 0;
*b This accuracy value (0.5164) and F1 score value (0.6811) indicate that all intercolumn links were predicted to be beam links.
Model-graphSF with Case-Inverse graph representation had the highest accuracy and F1 score. For different graph representations, Model-graphSF had a stable performance, as well as the highest accuracy and F1 score. Overall, Model-graphSF has the best performance, Model-graphSAGE the second best, and Model-graphConv the worst.
Different models had different suitable graph representations. For Model-graphConv, Case-Normal has the best performance; for Model-graphSAGE, Case-Inverse, and Case-AllNodes have marked advantages compared to Case-Normal; and for Model-graphSF, all three graph representations have excellent performance.
6.2. Influence of Link Features
In the above discussion, the graph features adopted in the GNN models are shown in Table 1. The intercolumn link features include the coordinates of the columns at both ends of the link and the link length, but the necessity of such redundant information is not yet apparent. Hence, the effect of different intercolumn link features on the model performance is discussed. The following four intercolumn link features were compared:
(a) Feature-All: The features defined in Table 1, including the column coordinates of the link ends and link length;
(b) Feature-Coord.: the features including only the coordinates of the columns at the ends of the link;
(c) Feature-Length: the features including only the length of the link;
(d) Feature-None: the features have no physical meaning.
The four intercolumn link features corresponding to different graph representations are listed in Table 4.
Table 4 Four intercolumn link features
|
Graph feature types |
Graph representations |
Features |
|
Feature-All |
Case-Normal |
[xleft, yleft, xright, yright, length] |
|
Case-Inverse |
[xleft, yleft, xright, yright, length] |
|
|
Case-AllNodes |
[1, 0, xleft, yleft, xright, yright, length] |
|
|
Feature-Coord. |
Case-Normal |
[xleft, yleft, xright, yright] |
|
Case-Inverse |
[xleft, yleft, xright, yright] |
|
|
Case-AllNodes |
[1, 0, xleft, yleft, xright, yright] |
|
|
Feature-Length |
Case-Normal |
[length] |
|
Case-Inverse |
[length] |
|
|
Case-AllNodes |
[1, 0, 0, 0, length] |
|
|
Feature-None |
Case-Normal |
[0] |
|
Case-Inverse |
[0] |
|
|
Case-AllNodes |
[1, 0, 0, 0] |
Owing to the unsatisfactory performance of Model-graphConv, it is no longer been discussed. The test set performances of the four intercolumn link features are compared in Table 5.
Table 5 Influence of different link features
|
Graph Representations |
GNN models |
Performance |
Feature-All |
Feature-Coord. |
Feature-Length |
Feature-None |
|
Case-Normal |
Model-graphSAGE |
Accuracy |
0.7730 |
0.7907 |
0.7674 |
0.5164 |
|
F1 score |
0.7753 |
0.8090 |
0.7722 |
0.6811 |
||
|
Model-graphSF |
Accuracy |
0.9959 |
0.9984 |
0.9953 |
0.8906 |
|
|
F1 score |
0.9960 |
0.9984 |
0.9955 |
0.9009 |
||
|
Case-Inverse |
Model-graphSAGE |
Accuracy |
0.9881 |
0.9903 |
0.9469 |
0.4836 |
|
F1 score |
0.9884 |
0.9906 |
0.9480 |
ˇŞ |
||
|
Model-graphSF |
Accuracy |
0.9997 |
0.9997 |
0.9911 |
0.8214 |
|
|
F1 score |
0.9997 |
0.9997 |
0.9915 |
0.8204 |
||
|
Case-AllNodes |
Model-graphSAGE |
Accuracy |
0.9233 |
0.8219 |
0.9100 |
0.5164 |
|
F1 score |
0.9268 |
0.8127 |
0.9070 |
0.6811 |
||
|
Model-graphSF |
Accuracy |
0.9755 |
0.7158 |
0.9668 |
0.7148 |
|
|
F1 score |
0.9764 |
0.7357 |
0.9683 |
0.7208 |
Overall, Feature-None is the worst-performing intercolumn link feature. For almost every type of link feature, Model-graphSF outperforms Model-graphSAGE. For Case-Normal and Case-Inverse graph representations, Feature-All and Feature-Coord. have the top two highest accuracies and F1 scores. For Case-AllNodes graph representation, Feature-All and Feature-Length have better performance than the other two link features.
The above discussion shows that Model-graphSF is the best-performing model, and Feature-All is the best and most stable link feature. Therefore, Feature-All is suggested as the intercolumn link feature of frame-structure graph representations.
7. Case study
Fifteen real-world frame structures from well-known Chinese design institutes were selected for case analyses. Model-graphSF was adopted as the GNN model. All three graph representations were used for further discussion, and Feature-All was adopted as the intercolumn link feature. The column layout and potential intercolumn links of real-world frame structures are inputted into the well-trained GNN model. The results are shown in Table 6, where the beam and nonbeam links of the ground truth were determined based on the actual beam layout of real-world frame structures.
Table 6 Case study of 15 real-world frame structures
|
Model-graphSF |
Prediction of the GNN model |
Evaluation metrics |
|||||
|
Beam link |
Nonbeam link |
Accuracy |
F1 score |
Precision |
|||
|
Case-Normal |
Ground truth |
Beam link |
882 |
103 |
0.9550 |
0.9758 |
0.9591 |
|
Nonbeam link |
32 |
783 |
|||||
|
Case-Inverse |
Ground truth |
Beam link |
857 |
128 |
0.7808 |
0.7869 |
0.8099 |
|
Nonbeam link |
161 |
654 |
|||||
|
Case-AllNodes |
Ground truth |
Beam link |
929 |
56 |
0.9305 |
0.9527 |
0.9369 |
|
Nonbeam link |
72 |
743 |
|||||
As shown in Table 6, Case-Normal and Case-AllNodes are at a similar level (the evaluation metrics are all over 90%), and they are significantly better than Case-Inverse. Specifically, Case-Normal exhibited the best performance (the evaluation metrics exceeded 95%).
Figures 8 and 9 show the performance of the proposed method for typical regular and irregular frame structures, respectively, in which the Case-Normal graph representation is adopted. For the frame structures with relatively regular shapes in Figure 8 (e.g., rectangular and L-shaped frames), the model proposed in this study can correctly predict the layout of the frame beam with almost 100% accuracy.
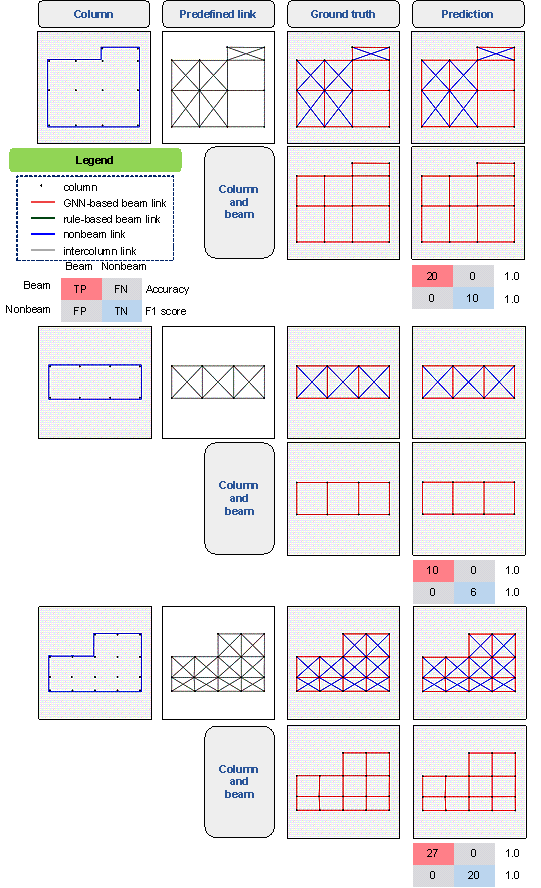
Figure 8 Cases of regular-shaped frame structures

Figure 9 Cases of irregular-shaped frame structures
It can be seen from Figure 9 that the proposed method can achieve an accuracy of more than 95% for frame structures with irregular shapes, which shows that almost every beam and nonbeam link in the frame structures can be correctly predicted. Furthermore, based on the engineerˇŻs experience, it is reasonable to arrange beams at the outer edge of the frame structure. Therefore, a simple post-processing method was adopted to make the frame beam layouts generated by the GNN model more practical. That is, all intercolumn links on the outer edge were identified as beams. After utilizing this simple post-processing method, the generated beam layout agreed very well with the engineerˇŻs experience.
Notably, the dataset proposed in Section 4 contains only four common frame structure plane forms: the rectangle, L shape, arc shape, and Y shape, and the GNN model is trained using this dataset. However, irregular frame structures beyond the scope of this dataset can still be effectively designed, as demonstrated by the first two cases in Figure 9, which indicate that the proposed dataset generation method can effectively reflect the characteristics of real-world frame structures.
8. Conclusion
An intelligent layout design method for frame structure beams based on GNNs was proposed. The GNN model was trained and tested using a predefined frame-structure dataset. By inputting the column layout and potential intercolumn links, the GNN model can accurately generate the beam layout of the frame structure. The detailed conclusions are as follows.
(1) The performance of the layout design of the frame beam based on GNNs is closely related to the choice of GNN model. The graph representation method and features of the graph data also significantly affect the performance. This study discusses three GNN models, three graph representations, and four graph data features. The proposed Model-graphSF model has the most stable and excellent performance. In addition, the link features of the graph that contain more information have better performance.
(2) A case study on real-world frame structures shows that the graph representation of Case-Normal exhibits the best performance. The proposed method can be used to design the frame beam layout for both regular and irregular real-world frame structures with stable performance.
(3) To satisfy the large amount of data required for the training of GNNs, a parameterized generation method for the dataset was proposed. A total of 80,000 frames with four typical shapes were generated, covering the rectangle, L shape, arc shape, and Y shape. For real-world frames beyond the scope of the generated dataset, the proposed method can also make satisfactory predictions, indicating that the generated dataset can accurately capture the characteristics of a real-world frame structure.
Declaration of Competing Interest
The authors declare that they have no known competing financial interests or personal relationships that could have appeared to influence the work reported in this paper.
Acknowledgments
References
[1] J.M. Yu, Y.H. Zhang, L.P. Duan, H.M. Wu, S.R. Niu, Reinforced Concrete Structures, Tsinghua University Press, Beijing, 2013. (in Chinese)
[2] Q.X. Shi, X.W. Liang, Design of Tall Building Structures, 2nd ed., Science Press, Beijing, 2012. (in Chinese)
[3] C.M. Herr, T. Fischer, A notation to aid column and beam layout design for reinforced concrete construction in China, In: Proceedings of the 19th International Conference on Computer-Aided Architectural Design Research in Asia, Kyoto, Japan, 2014, pp. 399¨C408.
[4] A. Nimtawat, P. Nanakorn. Automated layout design of beam-slab floors using a genetic algorithm, Comput. Struct. 87 (2009) 1308¨C1330, https://doi.org/10.1016/j.compstruc.2009.06.007
[5] A. Nimtawat, P.Nanakorn, A genetic algorithm for beam¨Cslab layout design of rectilinear floors, Comput. Struct. 32 (2010) 3488¨C3500, https://doi.org/10.1016/j.engstruct.2010.07.018
[6] S. Singaravel, J. Suykens, P. Geyer, Deep convolutional learning for general early design stage prediction models, Adv. Eng. Inform. 42 (2019) 100982, https://doi.org/10.1016/j.aei.2019.100982
[7] W.J. Liao, X.Z. Lu, Y.L. Huang, Z. Zheng, Y.Q. Lin, Automated structural design of shear wall residential buildings using generative adversarial networks, Autom. Constr. 132 (2021) 103931, https://doi.org/10.1016/j.autcon.2021.103931
[8] X.Z. Lu, W.J. Liao, Y. Zhang, Y.L. Huang, Intelligent generative design of shear wall structures using physics-informed generative adversarial networks, Earthq. Eng. Struct. Dyn. 2022, https://doi.org/10.1002/eqe.3632
[9] P.N. Pizarro, L.M. Massone, F.R. Rojas, R.O. Ruiz, Use of convolutional networks in the conceptual structural design of shear wall buildings layout, Eng. Struct. 239 (2021) 112311, https://doi.org/10.1016/j.engstruct.2021.112311
[10] P.N. Pizarro, L.M. Massone, Structural design of reinforced concrete buildings based on deep neural networks, Eng. Struct. 241 (2021) 112377, https://doi.org/10.1016/j.engstruct.2021.112377
[11] S. Ampanavos, M. Nourbakhsh, C.Y. Cheng, Structural design recommendations in the early design phase using machine learning, 2021, https://doi.org/10.48550/arXiv.2107.08567
[12] G. Ślusarczyk, Visual language and graph-based structures in conceptual design, Adv. Eng. Inform. 26 (2012) 267¨C279, https://doi.org/10.1016/j.aei.2011.10.005
[13] C. Langenhan, M. Weber, M. Liwicki, F. Petzold, A. Dengel, Graph-based retrieval of building information models for supporting the early design stages, Adv. Eng. Inform. 27 (2013), 413¨C426, https://doi.org/10.1016/j.aei.2013.04.005
[14] A. Kaveh, M. Shahrouzi, Graph theoretical implementation of memetic algorithms in structural optimization of frame bracing layouts, Eng. Comput. 25 (2008) 55¨C85, https://doi.org/10.1108/02644400810841422
[15] K.H. Chang, C.Y. Cheng, Learning to simulate and design for structural engineering, In: PMLR 119: Proceedings of the 37th International Conference on Machine Learning, 2020 Jul 13¨C18, Online, 2020, pp. 1426¨C1436, https://doi.org/10.48550/arXiv.2003.09103
[16] K. Hayashi, M. Ohsaki, Graph-based reinforcement learning for discrete cross-section optimization of planar steel frames, Adv. Eng. Inform. 51 (2022) 101512, https://doi.org/10.1016/j.aei.2021.101512
[17] M.M. Bronstein, J. Bruna, Y. LeCun, A. Szlam, P. Vandergheynst, Geometric deep learning: going beyond Euclidean data, IEEE Signal Process. Mag. 34 (2017) 18¨C42, https://doi.org/10.1109/MSP.2017.2693418
[18] Z. Chen, F. Chen, L. Zhang, T. Ji, K. Fu, L. Zhao, et al., Bridging the gap between spatial and spectral domains: A survey on graph neural networks, 2021, https://doi.org/10.48550/arXiv.2107.10234
[19] Z. Wu, S. Pan, F. Chen, G. Long, C. Zhang, P.S. Yu. A comprehensive survey on graph neural networks, IEEE Trans. Neural Netw. Learn. Syst. 32 (2020) 4¨C24, https://doi.org/10.1109/TNNLS.2020.2978386
[20] L. Waikhom, R. Patgiri, Graph neural networks: methods, applications, and opportunities, 2021, https://doi.org/10.48550/arXiv.2108.10733
[21] K.H. Chang, C.Y. Cheng, J. Luo, S. Murata, M. Nourbakhsh, Y. Tsuji, Building-GAN: graph-conditioned architectural volumetric design generation, In: Proceedings of the IEEE/CVF International Conference on Computer Vision (ICCV), 2021 Oct 11¨C17, Online, 2021, pp. 11956¨C11965, https://doi.org/10.48550/arXiv.2104.13316
[22] C. M¨˘laga-Chuquitaype, Machine learning in structural design: an opinionated review, Front. Built Environ. 8 (2022) 815717, https://doi.org/10.3389/fbuil.2022.815717
[23] Z. Wang, R. Sacks, T. Yeung, Exploring graph neural networks for semantic enrichment: Room type classification, Autom. Constr. 134 (2022) 104039, https://doi.org/10.1016/j.autcon.2021.104039
[24] X. Jiang, L. Liu, C. Shan, Y. Shen, X. Dong, D. Li, Recognizing vector graphics without rasterization, In: NeurIPS 2021: 35th Conference on Neural Information Processing Systems, 2021 Dec 6¨C14, Online, https://doi.org/10.48550/arXiv.2111.03281
[25] N. Nauata, K.H. Chang, C.Y. Cheng, G. Mori, Y. Furukawa, House-GAN: Relational generative adversarial networks for graph-constrained house layout generation, In: ECCV 2020: 16th European Conference on Computer Vision, 2020 Aug 23¨C28, Glasgow, UK, Cham: Springer, 2020, pp. 162¨C177, https://doi.org/10.1007/978-3-030-58452-8_10
[26] N. Nauata, S. Hosseini, K.H. Chang, H. Chu, C.Y. Cheng, Y. Furukawa, House-GAN++: Generative adversarial layout refinement network towards intelligent computational agent for professional architects, In: CVPR 2021: Proceedings of the IEEE/CVF Conference on Computer Vision and Pattern Recognition, 2021 Jun 20¨C25, Nashville, TN, USA, IEEE, 2021, pp. 13632¨C13641, https://doi.org/10.1109/CVPR46437.2021.01342
[27] A.J. Torii, R.H. Lopez, L.F.F. Miguel, Design complexity control in truss optimization, Struct. Multidiscip. Optim. 54 (2016) 289¨C299, https://doi.org/10.1007/s00158-016-1403-8
[28] R. Kicinger, T. Arciszewski, K.D. Jong, Evolutionary computation and structural design: a survey of the state-of-the-art, Comput. Struct. 83 (2005) 1943¨C1978, https://doi.org/10.1016/j.compstruc.2005.03.002
[29] F. Ranalli, F. Flager, M. Fischer, A ground structure method to minimize the total installed cost of steel frame structures, Int. J. Civ. Environ. Eng. 12 (2018) 160¨C168. https://www.semanticscholar.org/paper/A-Ground-Structure-Method-to-Minimize-the-Total-of-Ranalli-Flager/0adc7aa37bcc0155ed7a91a29cca87278d399530
[30] Y. Zhang, C. Mueller, Shear wall layout optimization for conceptual design of tall buildings, Eng. Struct. 140 (2017) 225¨C240, https://doi.org/10.1016/j.engstruct.2017.02.059
[31] H. Lou, B. Gao, F. Jin, Y. Wan, Y. Wang, Shear wall layout optimization strategy for high-rise buildings based on conceptual design and data-driven tabu search, Comput. Struct. 250 (2021) 106546, https://doi.org/10.1016/j.compstruc.2021.106546
[32] Q. Zhao, Z. Ma, X. Hei, Y. Zhu, J. Niu, A 3-D structural components automatic modeling method based on BIM. In: 2017 13th International Conference on Computational Intelligence and Security (CIS), IEEE, 2017, pp. 59¨C63, https://doi.org/10.1109/CIS.2017.00021
[33] M. Defferrard, X. Bresson, P. Vandergheynst, Convolutional neural networks on graphs with fast localized spectral filtering, In: NIPS 2016: Proceedings of the 30th Conference on Neural Information Processing Systems, 2016 Dec 5¨C10, Barcelona, Spain, 2016: pp. 3844¨C3852, https://doi.org/10.48550/arXiv.1606.09375
[34] T.N. Kipf, M. Welling, Semi-supervised classification with graph convolutional networks, 2017, https://doi.org/10.48550/arXiv.1609.02907
[35] J. Gilmer, S.S. Schoenholz, P.F. Riley, O. Vinyals, G.E. Dahl, Neural message passing for quantum chemistry, In Proceedings of the 34th International Conference on Machine Learning, Sydney, Australia, PMLR 70, 2017: pp. 1263¨C1272, https://dl.acm.org/doi/pdf/10.5555/3305381.3305512
[36] P.W. Battaglia, J.B. Hamrick, V. Bapst, A. Sanchez-Gonzalez, V. Zambaldi, et al., Relational inductive biases, deep learning, and graph networks, 2018, https://doi.org/10.48550/arXiv.1806.01261
[37] W.L. Hamilton, Graph representation learning, synthesis lectures on artificial intelligence and machine learning, 14 (2020) 1¨C159, https://doi.org/10.2200/S01045ED1V01Y202009AIM046
[38] W.L. Hamilton, R. Ying, J. Leskovec, Inductive representation learning on large graphs, In: NIPS 2017: Proceedings of the 31st Conference on Neural Information Processing Systems, 2017 Dec 4¨C9, Long Beach, CA, USA, 2017, pp. 1024¨C1034, https://doi.org/10.48550/arXiv.1706.02216
[39] D. Bahdanau, K. Cho, Y. Bengio, Neural machine translation by jointly learning to align and translate, In: ICLR 2015: International Conference on Learning Representations, 2015 May 7¨C9, San Diego, USA, 2015, https://doi.org/10.48550/arXiv.1409.0473
[40] P. Veličković, G. Cucurull, A. Casanova, A. Romero, P. Li¨°, Y. Bengio, Graph attention networks [J]. In: ICLR 2018: International Conference on Learning Representations, 2018 Apr 30¨CMay 3, Vancouver, Canada, 2018, https://doi.org/10.48550/arXiv.1710.10903
[41] J. Qian, Z. Zhao, X. Ji, L. Ye, Design of Tall Building Structures, 3rd ed., China Architecture & Building Press, Beijing, 2018. (in Chinese)
[42] M. Wang, D. Zheng, Z. Ye, Q. Gan, M. Li, X. Song, et al., Deep graph library: A graph-centric, highly-performant package for graph neural networks, 2020, https://doi.org/10.48550/arXiv.1909.01315
[43] A. Paszke, S. Gross, F. Massa, A. Lerer, J. Bradbury, G. Chanan, et al., Pytorch: An imperative style, high-performance deep learning library, In: NeurIPS 2019: Proceedings of the 33rd International Conference on Neural Information Processing Systems, 2019 Dec 8¨C14, Vancouver, Canada, 2019, pp. 8026¨C8037, https://doi.org/10.48550/arXiv.1912.01703
Appendix
Appendix A. Statistical Features of Frame-Structure Data
Figures A.1 to A.4 show the statistical distribution of the critical control parameters of the frame structure dataset. The parameters are rationally distributed in the concerned range.

Figure A.1 Distribution of statistical features of rectangular frame structures

Figure A.2 Distribution of statistical features of L-shaped frame structures
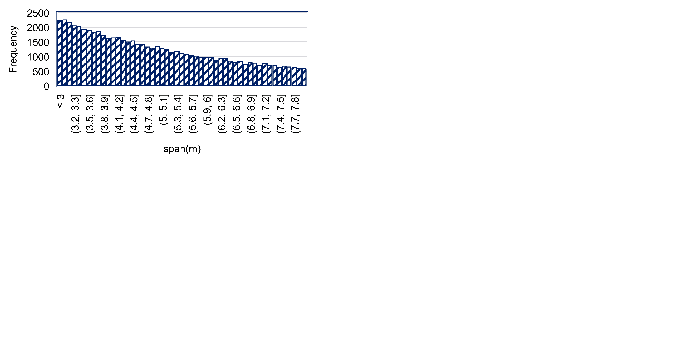
Figure A.3 Distribution of statistical features of arc-shaped frame structures
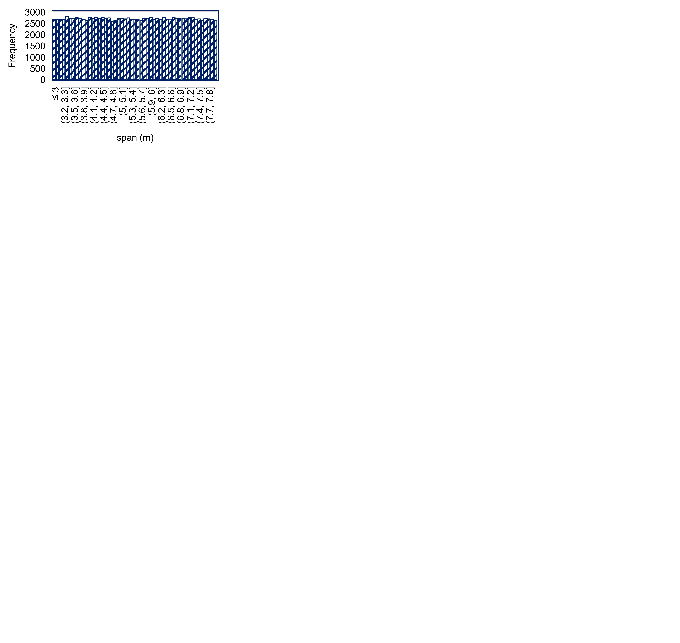
Figure A.4 Distribution of statistical features of Y-shaped frame structures