1 Introduction
Increasing urbanization has promoted the construction of high-rise residential buildings [1-2]. Reinforced concrete structures are one of the main building structure forms, and their design and analysis are essential [3-6]. Reinforced concrete shear wall systems are widely used in high-rise residential buildings, and their structural design demands are significant. In a shear wall structure system, the floor structure system consisting of coupling beams, frame beams, and floor slabs primarily bears and transmits vertical loads and is combined with shear wall components to form a complete shear wall structure system. As such, the floor structure system is a critical component of the shear wall structure system, and its practical and efficient design is essential [3-4]. At present, the iteration and coordination between architectural and structural designers in the layout design of a floor structure system consume a significant amount of time, and the experience is challenging to reuse and effectively pass on to others. Consequently, it is difficult for conventional design methods to meet the challenging demands of intelligent construction.
Artificial intelligence has developed rapidly in recent years and demonstrated its efficiency and reliability in many fields [7], and it also has applications in the field of structural engineering [8], for example, ceiling damage detection [9] and earthquake damage prediction based on ground motions [10] and drone photos [11]. In the field of architectural and structural design [12], topology optimization [13], cellular automata method [14], heuristic algorithms [15-17], and machine learning methods [18-20] are widely used for the structural optimization and performance assessment [21-22]. For residential structures, Fraile-Garcia et al. presented a methodology to select structural alternatives for a one-way slab in residential buildings [23] and performed a combined assessment of the environmental, economic, and social impacts of structural solutions for residential construction [24]. Tafraout et al. [25] adopted a genetic algorithm in BIM environment for the automatic structural design of RC wall-slab buildings. For the beam layout design of the shear wall structure, Nimtawat and Nanakorn [26-27] and Herr and Fischer [28], based on genetic algorithms and human- and machine-readable notation assistance, proposed layout design methods for structural beams and floor slabs. However, these beam layout design methods had difficulty encoding structural features and had a low design efficiency because they were mainly used for frame structures, and it was challenging to rapidly design a floor system of complicated shear wall structures. In contrast to optimization algorithms, Pizarro et al. [29-30] and Liao et al. [31] used convolutional neural networks and generative adversarial networks (GANs) to implement the layout design of shear wall components and showed that their deep learning-based design methods were highly efficient and capable of designing complex structures. The deep learning method provides a new solution for the intelligent design of building structures. However, current deep generative design algorithms target the layout design of shear walls, and few are applicable for the design of floor systems. The influencing factors of a beam layout scheme in a floor system are complex, existing design features are challenging to extract and learn effectively, and a new design is difficult to generate quickly. Therefore, further study is required to develop efficient, reliable, and intelligent floor structure design methods.
Deep learning has powerful implicit feature extraction and learning capabilities and can learn the implicit laws of structural design and realize the inference of new designs. In recent years, intelligent generative algorithms based on convolutional neural networks have progressed rapidly [7]. U-Net is a typical image semantic generation algorithm based on deep learning that realizes end-to-end training on a small number of images and has been successfully applied in many fields, such as biomedical engineering [32], urban planning [33], crack detection [33] and computational fluid dynamics [35]. Furthermore, image-generation algorithms based on GANs have been proposed, and pix2pix and pix2pixHD [36-37] are their representatives. GANs can learn the rules of design through simultaneous training of the generator and the discriminator and have been effectively applied in architectural and structural engineering [31,38-39]. Obviously, intelligent algorithms such as U-Net and pix2pixHD exhibit great potential for learning from existing design outcomes and the generation of new structural designs. Therefore, this study explores the intelligent generative design method of a floor structure system and its research dataset establishment, network model analysis, beam layout design, and critical component size design.
The design method of the floor structure system based on deep learning is presented in Section 2, and the corresponding dataset construction method is presented in Section 3. In Section 4, a discussion on the influence of fundamental algorithms and data characteristics on the design is provided. Section 5 introduces the cross-sectional design method for the critical components of the floor system and the structural modeling and analysis method. In Section 6, based on the proposed method, a typical floor structure design case is presented and discussed. Finally, the conclusions of this study are presented in Section 7.
2 Design Method of Beam and Slab Based on Deep Learning
Based on a deep learning algorithm, this study proposes a beam�Cslab design method for a floor system that comprehensively considers the characteristics of building space and element attributes, as shown in Figure 1. The images of the building element and building space attributes were fused and input into a trained deep neural network model to generate the corresponding beam layout design of the floor system. Then, based on statistical analysis, the coupling beam and frame beam are distinguished, and the sizes of coupling beams, frame beams, and floor slabs are determined to complete the floor structure design.

Figure 1 Beam�Cslab design method for floor system based on deep learning
The floor structure design process was as follows:
(1) Fused inputs of building elements and space attributes. In structural design, the location of critical structural and non-structural elements and the distribution of architectural internal functional spaces have a significant influence on the design of a floor structure system. Therefore, this study adopted the semantic method to extract the features of building elements and space attributes and construct the corresponding dataset. The functional spaces (living rooms, bedrooms, bathrooms, balconies, kitchens, cloakrooms, stairwells, elevators, shafts, and general spaces), critical elements(infill walls, shear walls, windows, interior and exterior doors), and beams are semantically represented using different colors. Image segmentation augmentation and distortion-free augmentation are adopted while constructing the dataset. See Section 3 for details. During the training and application of the neural network models, building space attributes and building element attributes are fused together as input. The fusion method adopted in this study is to concatenate building space and building element attributes in the channel dimension.
(2) Deep neural network model for beam�Cslab design. This study used deep neural networks to extract and map design features and infer the structural design based on the fused input of building elements and space attributes. The selection of the deep neural network was critical. Therefore, this study discussed the outcomes using the widely used U-Net and pix2pixHD models. See Section 4 for details. This study also discussed the effects of different input sizes, classification numbers of building space attributes and building element attributes on the neural network��s performance. Furthermore, the coupling effect of building space�Celement attributes was also discussed.
(3) Cross-section design of critical components and modeling/analysis of floor structure system. Determining the location and size of critical components is indispensable for the design of floor systems. This study completed the layout design of floor structural components by using a deep generative design method. Computer vision processing algorithms were used to extract the vectorized component layout from a pixel image. Based on the statistical analysis of structural design empirical data and Chinese design codes, methods for determining the coupling and frame beams and the cross-section design of coupling beams, frame beams, and floor slabs are proposed. Combined with the design of shear wall components [31,40], the application program interface (API) of the structural design software was used to complete the construction of the structural design model and conduct a structural performance analysis. See Section 5 for further details.
3 Dataset Construction
The deep neural network learned the probability distribution of the floor structure design plan from existing data, the success of which significantly depends on the quality of the dataset used. This study collected 200 sets of architectural�Cstructural design drawings from more than 10 well-known Chinese design institutes as the dataset. The design drawings were optimized by experienced architectural and structural engineers from various design institutes and were related to actual engineering projects; thus, their quality was guaranteed. To improve the performance of the floor-structure scheme design method based on deep learning, semantic pre-processing was required for the original architectural�Cstructure design drawings [31]. Semantic pre-processing extracted the spaces and elements in the design drawings and used different colors to encode them. It mainly extracted the distribution of internal functional spaces in architectural design drawings and the element information of infill walls, interior and exterior doors, windows, shear walls, and beams.
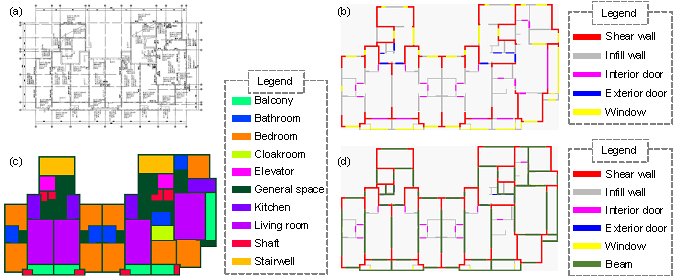
Figure 2 Architectural design images (see Appendix A for color coding): (a) CAD drawing, (b) building elements, (c) functional spaces, and (d) floor structure.
Based on the semantic method of image data, we constructed three types of design feature images: building elements (Figure 2a), functional spaces (Figure 2b), and floor structure (Figure 2c). Among them, the images of building elements and functional spaces were input during deep neural network training, and the image of the floor structure was the ground truth for comparison with the output of the neural network to calculate the loss. Specifically, the image of building elements included infill walls, shear walls, windows, interior and exterior doors. The image of functional spaces included living rooms, bedrooms, bathrooms, balconies, kitchens, cloakrooms, stairwells, elevators, shafts, and general spaces. The image of the floor structure included infill walls, shear walls, windows, interior and exterior doors, and beams.
After the semantic pre-processing of the data, there were 200 sample pairs, of which 160 pairs (80%) were randomly selected as the training set, and the remaining 40 pairs (20%) were used as the test set. To better train the neural network model, data augmentation was adopted, including image segmentation augmentation and image distortion-free augmentation.
(1) Image segmentation augmentation. In the design of structural beams, the main influencing factor is the vertical gravity load, and the overall lateral force design of a structure can generally be carried out independently [3-4]; therefore, image segmentation can be used when constructing the dataset. The neural network learns the layout of structural beams based on local design features, and the floor layout design can be used for multiple training and learning sessions. The slicing method is illustrated in Figure 3a. An original pixel image with a size of (dim_x �� dim_y) was evenly divided into square image tiles of size (data_size �� data_size). The images used in this study are of the same spatial resolution, with each pixel representing a real-world size of 32 mm. Therefore, the different data_size values represent the range of the image input to the neural network, as shown in Figure 3b. The number of tiles Ntile is given as:
|
|
(1) |
where data_size is the image sample size used by the neural network, ⌈⌉ is the round-up operator, n is the repetition multiple, and dim_x and dim_y are the image pixel sizes.
In the x- and y- directions, the distances dist_x and dist_y between the two tiles are shown respectively as:
|
|
(2) |
|
|
|
(3) |
When dim_x < data_size or dim_y < data_size, the image can be centered in the corresponding dimension. When the original pixel image was segmented, the original pixel coordinates corresponding to the segmented tiles were recorded and were used to restore the tiles after segmentation.
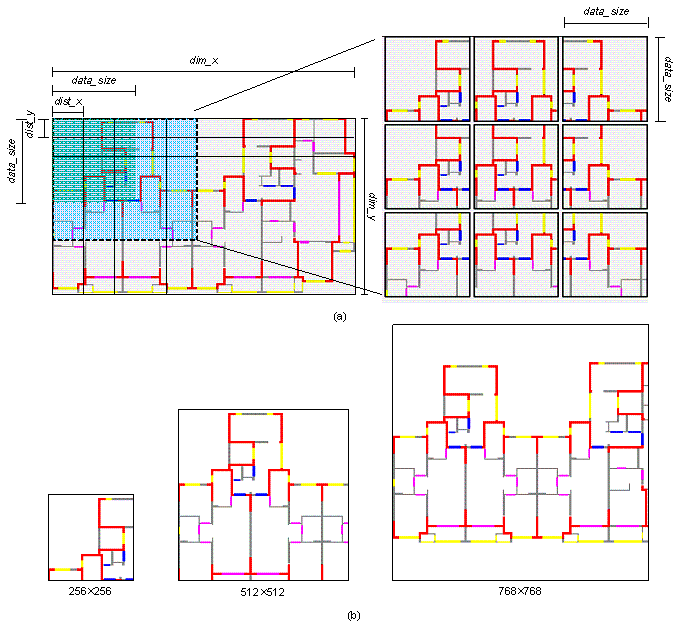
Figure 3 Image segmentation augmentation: (a) slicing method and (b) schematic of different data sizes.
(2) Image distortion-free augmentation. The segmented tiles were randomly rotated counterclockwise by 0��, 90��, 180��, and 270�� during neural network training and randomly flipped left and right simultaneously. This further increased the amount of training data by eight times.
4 Beam Layout Generation Method
4.1 Performance of neural network models
In this study, high-performance image generation algorithms U-Net [32] and pix2pixHD [37] were selected to discuss the performance of deep neural networks. Different image input sizes corresponded to different network model parameters and model performance; therefore, the input image size is discussed first. Under the same image scale, this study compared the effects of four input sizes of 256 �� 256, 512 �� 512, 768 �� 768, and 1024 �� 1024 on the performance of neural networks. The evaluation score selected the intersection over union (IoU) based on image pixel classification [41] as:
|
|
(4) |
where c is the target category, y is the ground-truth
category of the pixel, and ![]() is the predicted category of the pixel.
is the predicted category of the pixel.
Table 1 shows the mean, standard deviation, and coefficient of variation (COV) of the test results for different input sizes. The 512 �� 512 input size was the best for both U-Net and pix2pixHD because it resulted in the highest evaluation score and the dispersion was small (i.e., the mean value was the highest, and the COV was small). Because pix2pixHD is a GAN equipped with high-resolution [37], its performance is stable and excellent after training on datasets of different resolutions. The U-Net network is mainly used for semantic segmentation with a resolution ranging from 256 to 512 [32-35]; therefore, more network parameters need to be trained for direct application to high-resolution images. The amount of existing data was insufficient to meet these requirements, resulting in U-Net��s poor effect on high-resolution images.
Table 1 Mean, standard deviation, and coefficient of variation (COV) of test set scores of U-Net and pix2pixHD under four input sizes
|
Score |
Input size |
256��256 |
512��512 |
768��768 |
1024��1024 |
|
U-Net |
Mean |
0.7849 |
0.7849 |
0.5807 |
0.4414 |
|
Standard deviation |
0.1167 |
0.1156 |
0.0939 |
0.0784 |
|
|
COV |
0.1487 |
0.1473 |
0.1617 |
0.1776 |
|
|
pix2pixHD |
Average |
0.7230 |
0.7562 |
0.7340 |
0.7271 |
|
Standard deviation |
0.1054 |
0.1139 |
0.1217 |
0.1198 |
|
|
COV |
0.1458 |
0.1506 |
0.1658 |
0.1648 |
Consider an image in the test set as an example to show the output difference between U-Net and pix2pixHD under four input sizes (Figure 4). When the resolution was higher, U-Net generated more secondary beams (i.e., in the results corresponding to the input sizes of 768 �� 768 and 1024 �� 1024, U-Net generated far more secondary beams than the target design, as shown in the rectangular box in Figure 4). For pix2pixHD, there was little difference in the results for different input sizes.

Figure 4 Results of an image in the test set corresponding to different input sizes
4.2 Data characteristics
4.2.1 Influence of building space attributes
After determining the network model and input size, this study considered the influence of the building space attributes on the generation of the beam layout of a floor structure. Ten functional spaces were considered: living room, bedroom, bathroom, balcony, kitchen, cloakroom, stairwell, elevator, shaft, and general space. This study designed the following six building space input schemes to quantitatively investigate the influence of building space attributes on the design results shown in Figure 5:
(1) 10 Spaces: original 10 building space attributes,
(2) 9 Spaces: elevators and stairwells are used for the vertical traffic of the building, so they were combined into one category,
(3) 7 Spaces: including those mentioned in (2), the bathroom and kitchen with interior water supply and drainage systems, were combined into one category, and the cloakroom and bedroom were combined into one category,
(4) 6 Spaces: including those mentioned in (3), the balcony and shaft were combined into one category,
(5) 3 Spaces: combines the elevator and stairwell into one category, the general space as a second category, and all the remaining rooms into a third category, and
(6) 0 Spaces: no building space attributes.
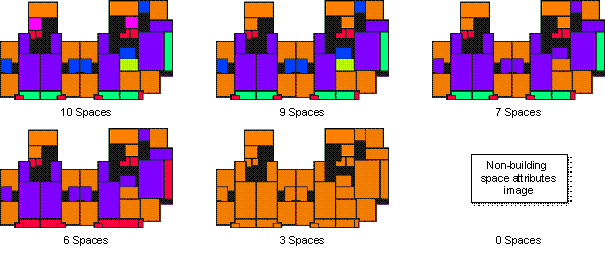
Figure 5 Six building space input schemes
The comparison results of the above six building space input schemes are listed in Table 2. From the mean evaluation score, in general, the effect of U-Net was still better than that of pix2pixHD. Although the mean evaluation score of U-Net was generally better than that of pix2pixHD, the standard deviation and COV of U-Net were generally larger, demonstrating that the performance of pix2pixHD was more stable than that of U-Net. This phenomenon is consistent with that shown in Table 1.
Table 2 Evaluation scores of U-Net and pix2pixHD test sets under six building space input schemes
|
Networks |
Score |
10 Spa. |
9 Spa. |
7 Spa. |
6 Spa. |
3 Spa. |
0 Spa. |
(max-min)/max |
|
U-Net |
Mean |
0.7849 |
0.7854 |
0.7811 |
0.7721 |
0.7880 |
0.7775 |
2.02% |
|
Standard deviation |
0.1156 |
0.1178 |
0.1280 |
0.1328 |
0.1225 |
0.1169 |
/ |
|
|
COV |
0.1473 |
0.1500 |
0.1639 |
0.1720 |
0.1555 |
0.1504 |
/ |
|
|
pix2pixHD |
Mean |
0.7562 |
0.7597 |
0.7568 |
0.7513 |
0.7531 |
0.7522 |
1.11% |
|
Standard deviation |
0.1139 |
0.1072 |
0.1103 |
0.1026 |
0.1089 |
0.1092 |
/ |
|
|
COV |
0.1506 |
0.1411 |
0.1457 |
0.1366 |
0.1446 |
0.1452 |
/ |
Spa. denotes space.
For the mean evaluation scores of U-Net and pix2pixHD, the difference between the highest and lowest scores of the 6 input schemes was less than 3%, which means that the category number of building space attributes had a limited effect in this study. However, when there was no building space attribute input, the model generated structural beams outside the building outline as shown in �� and �� of the ��0 Spaces�� input scheme in Figure 6.
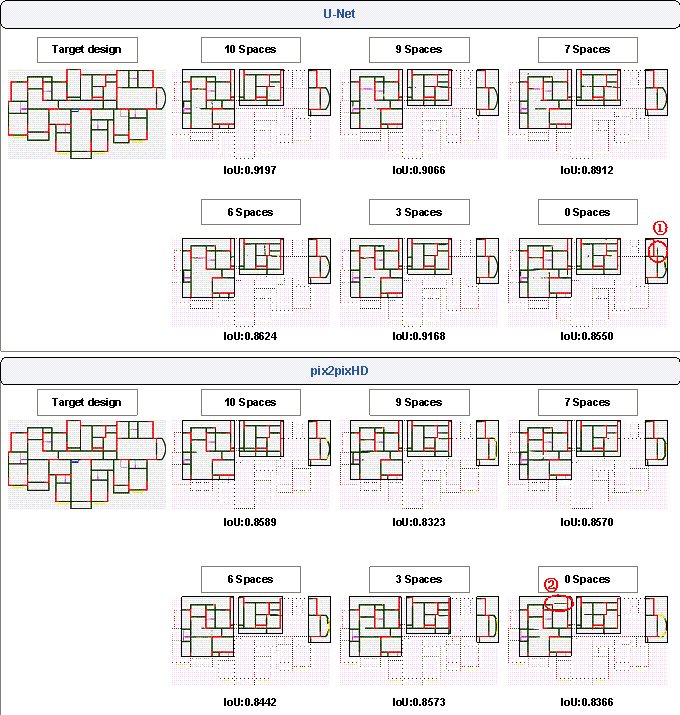
Figure 6 Results of a test set image corresponding to building space input schemes (the part inside the rectangle is the apparent difference of the generated results).
4.2.2 Influence of building element attributes
In addition to the building space attributes, the building element attributes also served as input features for the neural network. This study considered five element types��infill walls, shear walls, windows, interior and exterior doors��and discussed the influence of different classification criteria for building element attributes. The original 10 building space attributes were input simultaneously with the building element attributes. Six building element input schemes were considered, as shown in Figure 7.
(1) 5 Elements: original five types of building elements,
(2) 4 Elements-1: windows and the interior doors combined into one category,
(3) 4 Elements-2: interior and exterior doors combined into one category,
(4) 3 Elements: windows, interior and exterior doors combined into one category,
(5) 2 Elements: windows, interior and exterior doors, and infill walls combined into one category, and
(6) 1 Element: only shear walls.
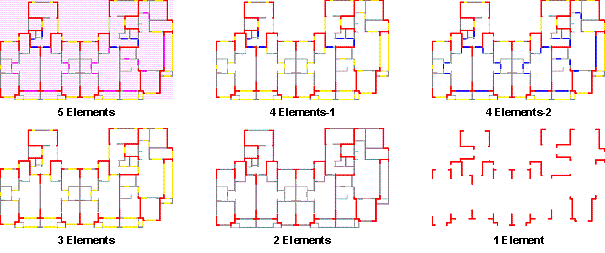
Figure 7 Building element input schemes
The comparison results are listed in Table 3. Generally speaking, the element-attribute classification had a limited effect on the result averages, and the difference between the highest and lowest scores was within 4%. Relatively speaking, the ��5 Elements�� scheme and U-Net had the smallest COV, and the ��4 Elements-2�� scheme and pix2pixHD had the smallest COV, respectively.
Table 3 Evaluation scores of U-Net and pix2pixHD test sets under building element input schemes
|
Networks |
Score |
5 Ele. |
4 Ele. -1 |
4 Ele. -2 |
3 Ele. |
2 Ele. |
1 Ele. |
(max-min)/max |
|
|
U-Net |
Mean |
0.7849 |
0.7783 |
0.7876 |
0.7702 |
0.7927 |
0.7685 |
3.05% |
|
|
Standard deviation |
0.1156 |
0.1239 |
0.1217 |
0.1222 |
0.1264 |
0.1236 |
/ |
||
|
COV |
0.1473 |
0.1592 |
0.1545 |
0.1587 |
0.1595 |
0.1608 |
/ |
||
|
pix2pixHD |
Mean |
0.7562 |
0.7636 |
0.7625 |
0.7489 |
0.7620 |
0.7511 |
1.93% |
|
|
Standard deviation |
0.1139 |
0.1086 |
0.1034 |
0.1107 |
0.1037 |
0.1098 |
/ |
||
|
COV |
0.1506 |
0.1422 |
0.1356 |
0.1478 |
0.1361 |
0.1462 |
/ |
Ele. denotes element.
Taking an image in the test set as an example, the ��5 Elements�� scheme and U-Net had the best results, and the differences of the different input schemes are shown in Figure 8.
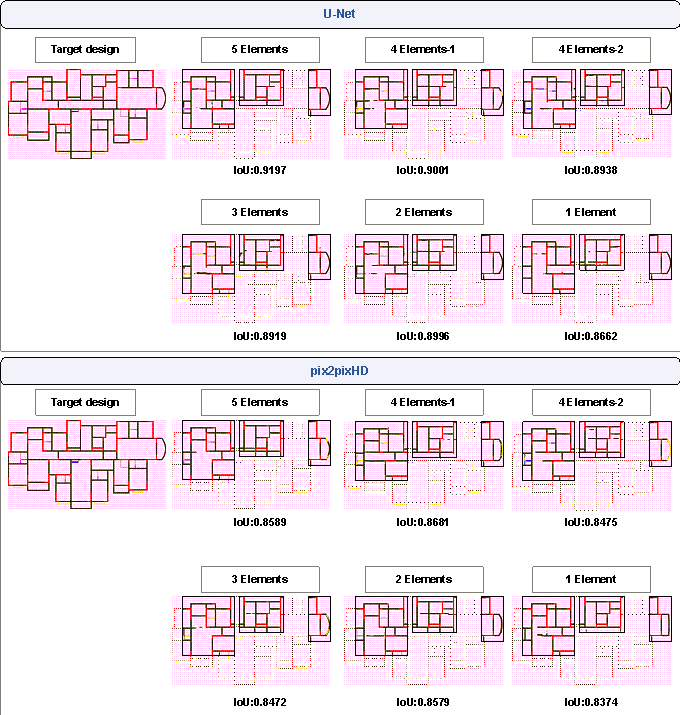
Figure 8 Results of a test set image corresponding to building element input schemes
4.2.3 Coupling effect of building space�Celement attributes
The previous analysis discussed the single variable of building space and element attributes in the design of beam layout schemes in the floor structure system. The following compares and analyzes the five typical coupling schemes for the two attributes as shown in Figure 9:
(1) 10 Spaces + 5 Elements,
(2) 6 Spaces + 3 Elements,
(3) 3 Spaces + 2 Elements,
(4) 0 Spaces + 2 Elements, and
(5) 0 Spaces + 1 Element.
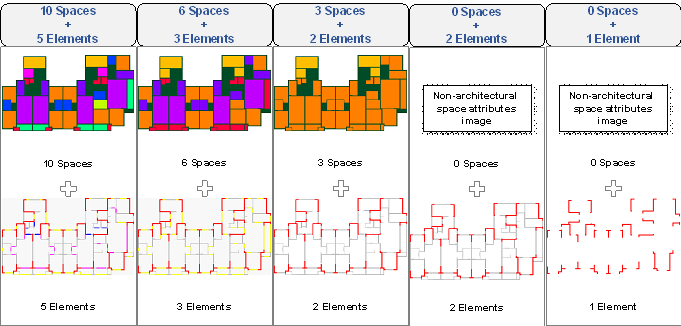
Figure 9 Coupling schemes of building space and element attributes
The comparison results of the five input schemes are presented in Table 4. Generally speaking, when both the building space and the element attributes existed, the classification number of building space and element attributes had a limited effect on the generation of the neural network model. However, when the building space attribute did not exist, the ��0 Spaces + 1 Element�� scheme (i.e., only the shear wall element attribute existed) performed the worst for both U-Net and pix2pixHD, and the ��0 Spaces + 2 Elements�� scheme performed the second worst for both U-Net and pix2pixHD. Thus, only one or two types of building element attributes were insufficient for the neural network of the layout design of the floor structure system.
|
Networks |
Score |
10
Spa. + |
6
Spa. + |
3
Spa. + |
0
Spa. + |
0
Spa. + |
|
U-Net |
Mean |
0.7849 |
0.7822 |
0.7915 |
0.7400 |
0.1021 |
|
Standard deviation |
0.1156 |
0.1308 |
0.1247 |
0.1314 |
0.0857 |
|
|
COV |
0.1473 |
0.1672 |
0.1575 |
0.1776 |
0.8394 |
|
|
pix2pixHD |
Mean |
0.7562 |
0.7563 |
0.7586 |
0.7196 |
0.5869 |
|
Standard deviation |
0.1139 |
0.1031 |
0.1150 |
0.0829 |
0.1310 |
|
|
COV |
0.1506 |
0.1363 |
0.1516 |
0.1152 |
0.2232 |
Spa. denotes Space and Ele. denotes element.
Figure 10 shows an image from the test set. It can be seen that the ��0 Spaces + 1 Element�� scheme had the worst result. For this input scheme, U-Net hardly learned any features of the beam layout. Meanwhile, redundant beams were generated by pix2pixHD outside the scope of the building.
In summary, in the layout design of the floor structure system, the design outcome of U-Net was slightly better than that of pix2pixHD, the optimal image input size was 512��512, and the presence or absence of building space and element attributes had a significant impact on the design results. However, the influence of the number of attribute classifications was relatively limited; therefore, using U-Net with three or more types of building spaces and component attributes is recommended for floor structure layout design.
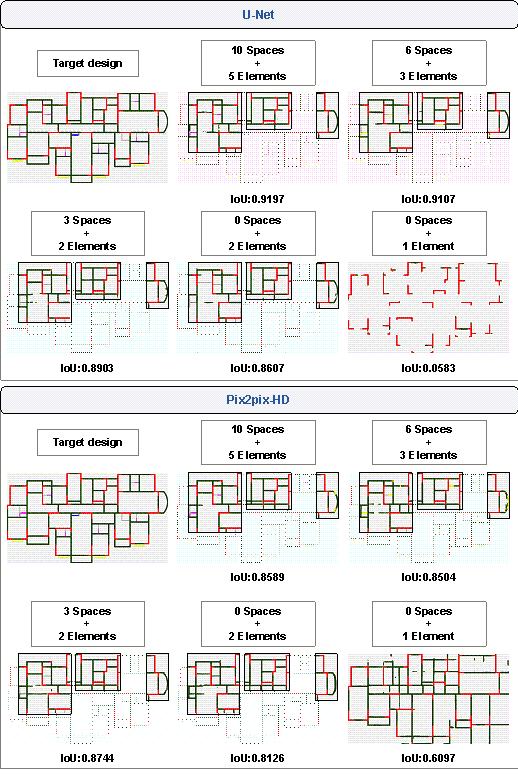
Figure 10 Results of a test set image corresponding to coupling schemes of building space and element attributes
5 Design Method of Key Component Section and Modeling Analysis Method of Floor Structure
5.1 Automatic extraction method of components
The component layout scheme generated based on the deep neural network is a pixel image that cannot be directly used for subsequent structural cross-section design and modeling analysis. Therefore, this study proposed a vectorized coordinate extraction method based on computer vision algorithms for critical beam, wall, and slab components.
(1) Coordinate extraction method for beam and wall components (Figure 11a).
Step 1: Feature separation of critical elements. Use the value range of the HSV space (Appendix B) of the color corresponding to each component to separate the pixels belonging to different structural components. For the analysis and design of the floor structure system, the critical component elements that need to be extracted from the floor-structure pixel image include shear wall elements and beam elements in this study.
Step 2. Extraction of component positioning lines. The extracted shear wall and beam elements are converted into a binary image. Then the morphological transformation algorithms of corrosion and dilation are used to clean up the binary image��s noise points and small gaps. Subsequently, the skeleton line extraction method [42] was used to obtain the skeleton lines of the components. A probabilistic Hough transform algorithm [43] is used to fit the skeleton lines of the components to straight line segments. Then, the component positioning lines are obtained.
Step 3. Component-positioning-line cleaning. The alignment of adjacent parallel line segments and the extension and division between the line segments are used to clean the extracted shear wall and beam positioning straight-line segments. Meanwhile, small cantilever lines are also deleted. Then the shear wall and beam positioning lines with the endpoints aligned can be obtained.
(2) Slab component extraction method (Figure 11b). The contour detection algorithm was used to extract the contour of the building space attributes, and the ordered contour coordinates were obtained as the outer contour of the slab element. To ensure the smooth modeling of any slab, the Delaunay method [44] was used to triangulate the contour of the slab, and the divided triangles represent the slab.
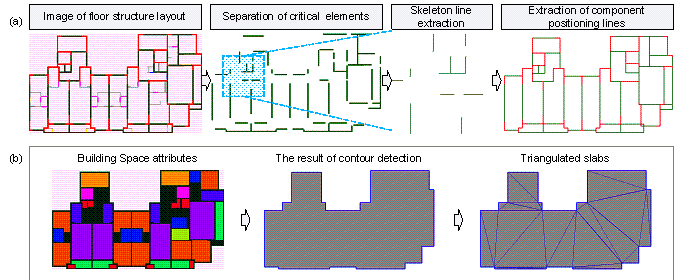
Figure 11 Automatic detection and extraction of wall, beam, and slab components: (a) coordinate extraction method of beam and wall components and (b) slab component extraction method.
5.2 Determination of beam element types
After the positioning lines were extracted and cleaned, the vectorized positioning line segments of the shear wall and beam elements were obtained. Owing to the significant differences between the coupling- and frame-beam design methods and their influence on the mechanical properties of a structure, it was necessary to first classify the beams in the floor system as either coupling or frame.
According to the analysis of the drawing data, three characteristics determine the arrangement of a coupling beam: (1) the shear wall is the support for the vertical force transmission, (2) the direction of the shear wall at the end is consistent with the beam, and (3) the coupling beam length is less than the limit value Lcbmax. As the coupling beam is a structural element in the coupled wall, it must meet criteria (1) and (2), while criterion (3) is determined statistically based on the existing design data. In this study, the length data of the coupling beams and the frame beams that meet criteria (1) and (2) in the dataset in Section 3 was collected. The stacking probabilities of the coupling and frame beams were calculated. The cumulative distribution function of the lognormal distribution was used to fit the stacking probability of frame beams Pfb. Then, the stacking probability of the above coupling beam Pcb is 1 − Pfb. Pfb and Pcb are shown in Equations (5) and (6), and their plots are shown in Figure 12a. From Equations (5) and (6), the intersection of Pfb and Pcb was calculated as 2577 mm or approximately 2.6m.
|
|
(5) |
|
|
|
(6) |
where erf is the error function, and its expression is given as [45]:
|
|
(7) |
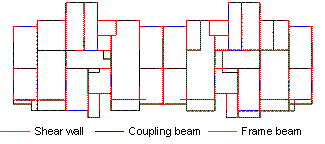
It can be seen that when the limit value of the coupling beam length Lcbmax was set to 2.6 m and the beam length Lcb was less than Lcbmax, the probability was greater that this beam was a coupling beam and not a frame beam. The difference in the floor system layout corresponding to different Lcbmax values is shown in Figure 12b (Lcbmax = 2.6m and Lcbmax = 8.0m), where the red line segment represents the shear wall, the green line represents the beam and the frame beam, and the blue line represents the coupling beam.
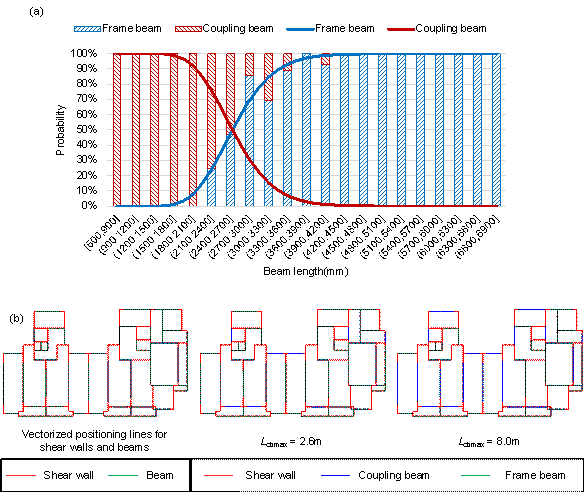
Figure 12 (a) Statistical data distribution of coupling and frame beam lengths that meet criteria (1) and (2), and (b) floor structure layout corresponding to different Lcbmax values.
5.3 Design of component sections
(1) Design of coupling beam sections. The span-to-height ratio of the coupling beam in the dataset in Section 3 was fitted with a normal distribution, and the mean value was 2.74, as shown in Figure 13. The span-to-height ratio of coupling beams must be less than 5, and the span-to-height ratio of a large number of coupling beams in actual engineering projects was less than 2.5 [3], which is close to the mean value fitted by this study. Therefore, in this study, the span-to-height ratio of the coupling beams was set to 2.5 as much as possible; that is, Hcb = 0.4 Lcb. When designing the height of a coupling beam, the net height requirements of the doors and windows must be considered. Therefore, Hcb = min (0.4 Lcb, Hcbclear), where Hcbclear is the maximum allowable coupling beam height that meets the net height requirements of doors and windows. The width of the coupling beam, Wcb, was taken from the thickness of the walls at both ends of the coupling beam.
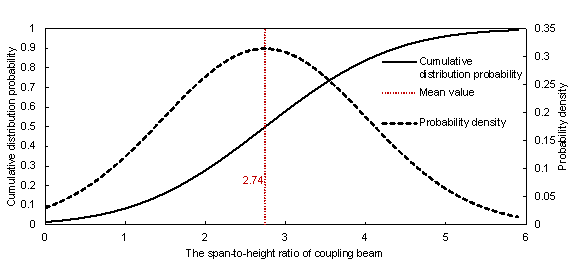
Figure 13 Statistical data distribution of span-to-height ratio of coupling beams
(2) Design of frame beam sections. The frame beam mainly bears the local vertical load and transfers the load to the shear wall. Therefore, the frame beam in a shear wall structure can be designed based on the design experience of the frame structure. ��Chinese technical specification for concrete structures of tall building�� [46] and Qian et al. [3] have shown that the height Hfb of a frame beam section can be 1/18�C1/10 of the frame beam length Lfb. Furthermore, it is not suitable for particles smaller than 400 mm. Similar to that of the coupling beam, the setting of the height of a frame beam must consider the net height requirements of the room. Therefore, Hfb = min(max(0.4m, 1/12 Lfb), Hfbclear) can be obtained, where Hfbclear is the maximum allowable frame beam height that meets the net height requirements. The width of the beam Wfb is taken as 1/3�C1/2 of the beam height Hfb, and the width of the beam section Wfb should not be less than 1/4 the height of the beam section Hfb, and Wfb should not be less than 200mm. Therefore, in this study, Wfb =max(0.2m, 5/12 Hfb).
(3) Design of slab thickness. The ��Chinese technical specification for concrete structures of tall building�� [46] indicates that the thickness of cast-in-place slabs for general floors is within the range 100 mm�C140 mm, and should not be less than 80 mm, and the thickness of the top floor should not be less than 120 mm. Therefore, in this study, the slab thickness was set to 120 mm.
5.4 Automatic structural modeling and analysis method
Based on the floor structure design, combined with the shear wall design method of Liao et al. [31], the overall structural design can be completed. The API of ETABS software [47] was used to perform structural modeling and analysis, using the coordinate, cross-section, and attribute information of the overall structure design. The SapModel.AreaObj.AddByCoord() command was mainly used to model the shear walls, coupling beams, and floor slabs. Meanwhile, the SapModel.FrameObj.AddByCoord() command was mainly used to model the frame beams. As a result, a typical floor structure model was obtained. The model of the entire structure was obtained by cloning the typical floor model. The overall structural analysis can be performed after the load and boundary are applied to the structure.
6 Case Study
6.1 Typical case evaluated by structural analysis
A typical high-rise shear wall residence was selected as the research case. The 26-story structure had a height of 76.7 m and a floor height of 2.95m. The seismic design intensity was 7-degree, and the design peak ground acceleration is 100 cm/s2 with a 10% probability of exceedance in 50 years. The corresponding building space and element attributes of a typical structural floor are shown in Figure 14a. As mentioned above, the ��10 Spaces + 5 Elements�� scheme using the U-Net network had the best effect and was used to generate the floor structure beam layout. The pixel image generated by the deep neural network and the vectorized floor structure design results are shown in Figure 14b. According to the ��Chinese design code for residential buildings�� [48], the height of the door opening is generally at least 2.00 m, the height of the upper edge of the window opening should not be less than 2.00 m from the ground, and the indoor net height of the living room should not be less than 2.40 m. Therefore, Hfbclear was taken as 2.95 − 2.40 = 0.55 m and Hcbclear as 2.95 − 2.00 = 0.95 m.
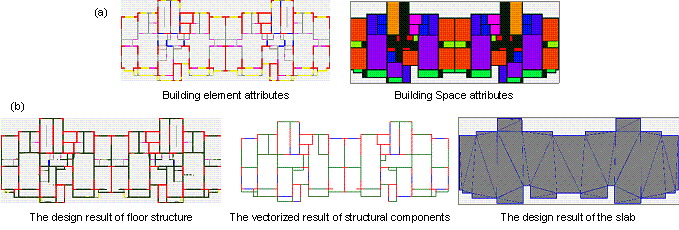
Figure 14 (a) Images of building space and element attributes of a typical floor of a 24-story residential structure under 7-degree seismic design intensity and (b) design pixel image and vectorized design results of the typical floor.
The corresponding structural models were established according to the design results. The model with the floor structure designed using the proposed method is called Model-DLdesign (i.e., deep learning-based design). The following three models were established for comparison:
(1) Model-Engineer �C floor structure designed by experienced engineers, and
(2) Model-RuleDesign-1 �C floor structure designed using defined rules (see Appendix C), and
(3) Model-RuleDesign-2 �C floor structure designed using defined rules, while coupling beams and frame beams are distinguished according to the proposed method in this study (see Appendix C).
The beam layouts of Model-RuleDesign-1 and Model-RuleDesign-2 are the same, and their difference lies in distinguishing between frame beams and coupling beams. Except for the floor beams, the three models had the same shear wall layout, loads, and other parameters.

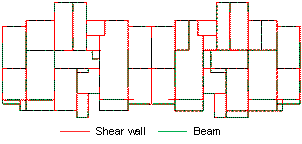
Figure 15 Typical floors of Model-DLdesign, Model-Engineer, Model-RuleDesign-1, and Model-RuleDesign-2: (a) similarity of floor-structure design results, (b) vectorized floor-structure design results and ETABS models, and (c) vertical typical-floor-slab displacement cloud diagrams.
Typical floors of the four models are shown in Figure 15. It can be seen that the beam layout designed by the proposed method was consistent with that designed by engineers. The IoU of the Model-DLdesign and Model-Engineer was 0.7490, which was better than that of the Model-RuleDesign-1 (or Model-RuleDesign-2) and Model-Engineer (0.5775). The layouts of the coupling and frame beams designed by the proposed method were similar to those designed by engineers. Furthermore, the difference in the vertical floor slab displacement between the typical floor designed by the proposed method and that designed by engineers was slight. In contrast, the typical-floor design results based on defined rules (Model-RuleDesign-1 and Model-RuleDesign-2) were quite different from that of the engineers. As a result, the vertical floor slab displacements were relatively larger than that of the engineers, which shows that it is difficult for humans to define explicit design rules comprehensively.
In addition, modal response spectrum analysis was used to calculate the structural response of the four models. Comparisons of the maximum inter-story drift ratio, maximum vertical typical-floor-slab displacement, and material consumption are shown in Table 5. Figure 16 shows the inter-story drift ratio response of different models. It can be seen that the structural performance and material consumption of Model-DLdesign were very close to those of Model-Engineer. The maximum vertical floor-slab displacement and steel consumption of Model-DLdesign were 0.80% and 6.20% larger than those of Model-Engineer, respectively. However, because providing a perfect explicit rule is challenging, the structural vertical floor-slab displacement and material consumption of Model-RuleDesign-1 and Model-RuleDesign-2 were significantly larger. The maximum vertical floor-slab displacements of Model-RuleDesign-1 and Model-RuleDesign-2 were 24.73% and 23.40% larger than that of Model-Engineer, respectively. The steel consumption of Model-RuleDesign-1 and Model-RuleDesign-2 was 22.36% and 16.70% larger than that of Model-Engineer, respectively. As a result, the design result of the proposed method was comparable to that of an experienced engineer. Moreover, the proposed method significantly improved the efficiency of floor structure design and modeling by nearly 30 times compared to that of the engineer��s design.
Table 5 Comparison of mechanical performance, material consumption, and design efficiency of Model-DLdesign, Model-Engineer, Model-RuleDesign-1, and Model-RuleDesign-2
|
Comparison of the maximum inter-story drift ratio |
|||||||
|
Model- |
Model- |
Model- |
Model- |
Difference |
Difference
|
Difference
|
|
|
x |
0.00040 |
0.00045 |
0.00062 |
0.00042 |
-11.11% |
+37.78% |
-6.67% |
|
y |
0.00045 |
0.00044 |
0.00054 |
0.00046 |
+2.27% |
+22.73% |
+4.55% |
|
Comparison of the maximum vertical floor-slab displacement of the typical floor |
|||||||
|
Direction |
Model- |
Model- |
Model- |
Model- |
Difference
|
Difference
|
Difference
|
|
z |
3.79 mm |
3.76 mm |
4.69 mm |
4.64 mm |
+0.80% |
+24.73% |
+23.40% |
|
Comparison of the material consumption |
|||||||
|
Material |
Model- |
Model- |
Model- |
Model- |
Difference
|
Difference
|
Difference
|
|
Concrete |
4918 m3 |
5064 m3 |
4996 m3 |
5120 m3 |
-2.88% |
-1.36% |
+1.10% |
|
Steel |
637.2 ton |
600.0 ton |
734.2 ton |
700.2 ton |
+6.20% |
+22.36% |
+16.70% |
|
Comparison of design efficiency (including floor structure design and modeling) |
|||||||
|
Engineer design |
30 min |
||||||
|
DL design |
Less than 1 min |
The efficiency is increased by more than 30 times. |
|||||
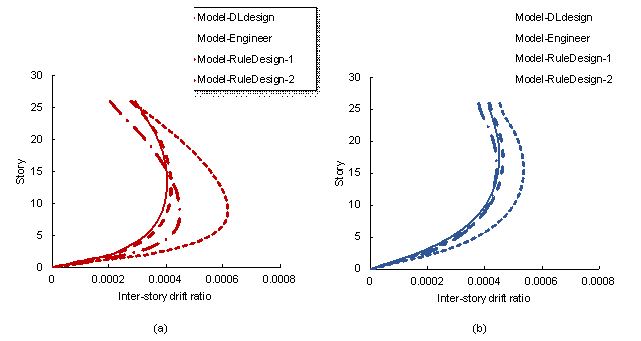
Figure 16 Inter-story drift ratio of each story of Model-DLdesign, Model-Engineer, Model-RuleDesign-1, and Model-RuleDesign-2 subjected to the design seismic response spectrum: (a) in the x-direction and (b) in the y-direction.
6.2 Multiple cases evaluated by human experts
Forty typical-floor layouts of shear wall structures were designed by engineers, and the proposed deep learning method, respectively. To evaluate the layout design results professionally, this study invited 40 professionals who are engineers, researchers, and graduate students majoring in civil engineering and with structural design experience to conduct a questionnaire survey [31]. In the survey, a design was randomly selected from a total of 80 designs. Then each subject judged whether the design was ��AI��s design�� or ��engineer��s design,�� and finally scored the rationality (1 to 5, from low to high) of the typical-floor layout design and the rationality (1 to 5, from low to high) of the determination of coupling and frame beams, respectively. This process was repeated five times for each survey. An illustration of typical questions in the questionnaire is shown in Appendix D. Note that designs generated by the proposed deep learning method are referred to as ��AI��s design�� for ease of understanding.
The evaluation results are shown in Table 6. It can be seen that 45.26% of the typical-floor layouts designed by the proposed deep learning method are judged by experts to be designed by engineers. The rationality of the typical-floor layout and the rationality of beam-type discrimination of the results designed by the proposed deep learning method are less than 13% different from that of the engineer��s design results. According to the questionnaire survey, the design results of the proposed method were comparable to that of experienced engineers. Since the subjects already know that this survey is designed to test whether the ��AI��s design�� can ��fool�� human experts, they possibly have a psychological tendency to judge the design as ��AI��s design,�� resulting in 48.57% (i.e., 1��51.43%) of ��Engineer��s design�� judged as ��AI��s design.��
Table 6 Evaluation results by human experts
|
Designer |
Judged as an ��Engineer��s design�� by human experts |
Rationality quantification of typical-floor layout |
Rationality quantification of determination of beam types |
|
Engineer |
51.43% |
3.20 |
3.64 |
|
Deep learning |
45.26% |
2.79 |
3.37 |
|
Relative difference |
12.00% |
12.81% |
7.42% |
7 Conclusion
This study proposed an intelligent design method for a shear wall residential floor structure based on deep learning. The deep neural network quickly generated the corresponding floor structure design scheme by fusing the input of building space and element attribute characteristics and completed the structural modeling and analysis based on the design scheme. The case study shows that the method��s excellent design performance and high efficiency effectively met the requirements of structural scheme design. The detailed conclusions are as follows:
From the perspective of evaluation scores, the building space attributes have a limited effect on the score of beam layout results. However, building space attributes can constrain the location of beam layouts, preventing the neural network from arranging beams in spaces that are not suitable for arranging beams. Moreover, considering the evaluation scores of different models, it is recommended to use U-Net with the fused input of multi-type building space attributes and multi-type component attributes to ensure design effectiveness.
The floor structure design mainly includes the design of the beam layout, the differentiation of coupling and frame beams, and the design of the component sectional size. The beam layout design was generated through a deep neural network. The distinction between coupling and frame beams and the design of the component sectional size relied on statistical analysis.
Compared with the engineer��s design, the floor structure design based on the proposed method showed minimal structural performance difference. The maximum inter-story drift ratio of the results designed by the proposed method differs from that of the engineer��s design by no more than 5��10-5. The differences between the design result of the proposed method and the engineer��s design result in the maximum vertical typical-floor-slab displacement, the concrete consumption, and the steel consumption are 0.8%, 2.88%, and 6.20%, respectively. However, the efficiency was increased by more than 30 times. Moreover, the structural performance of the design result based on the proposed method was significantly better than that based on defined rules. The difference in the maximum vertical displacement between the design result based on defined rules and the engineer��s design result was larger than 20%, and the difference in steel consumption was larger than 16%. The design result based on the proposed method had a smaller vertical structural deformation and less material consumption than the rule-based design. Therefore, the proposed method has the potential to help engineers achieve better and more efficient designs in the future.
CRediT Authorship Contribution Statement
Pengju Zhao: Data curation, Methodology, Formal analysis, Investigation, Writing - original draft. Wenjie Liao: Conceptualization, Methodology, Writing - review & editing, Funding acquisition. Hongjing Xue: Data collection, Writing - review & editing. Xinzheng Lu: Conceptualization, Methodology, Writing - review & editing, Supervision, Funding acquisition.
Declaration of Competing Interest
The authors declare that they have no known competing financial interests or personal relationships that could have appeared to influence the work reported in this paper.
Acknowledgments
References
[1] CTBUH, Tall buildings in 2019: another record year for supertall completions, CTBUH Research, 2019. https://www.skyscrapercenter.com/research/CTBUH_ResearchReport_2019YearInReview.pdf
[2] R. Perez, A. Carballal, J.R. Rabuñal, M.D. Garc��a-Vidaurr��zaga, O.A. Mures, Using AI to simulate urban vertical growth, CTBUH Journal, Issue III, 2019. https://global.ctbuh.org/resources/papers/download/4212-using-ai-to-simulate-urban-vertical-growth.pdf
[3] J.R. Qian, Z.Z. Zhao, X.D. Ji, L.P. Ye, Design of tall building structures, Third edition, China Architecture & Building Press, 2018 (in Chinese)
[4] P.S. Shen, Design of tall building structures, Third edition, China Architecture & Building Press, 2017 (in Chinese)
[5] C.H. Wang., J.Z. Xiao, C.Q. Wang, C.Z. Zhang, Nonlinear damping and nonlinear responses of recycled aggregate concrete frames under earthquake loading, Eng. Struct. 201 (2019) 109575, https://doi.org/10.1016/j.engstruct.2019.109575
[6] J.Z. Xiao, C.Q. Wang, T.L. Pham, Z.J. Yang, T. Ding, Nonlinear analysis and test validation on seismic performance of a recycled aggregate concrete space frame, Struct. Design Tall Spec. Build. 23 (2014) 1381�C1405, https://doi.org/10.1002/tal.1148
[7] S.J. Russell, P. Norvig, Artificial intelligence: a modern approach, Fourth Edition, Hoboken: Pearson, 2021.
[8] H. Salehi, R. Burgueño, Emerging artificial intelligence methods in structural engineering, Eng. Struct. 171 (2018) 170�C189, https://doi.org/10.1016/j.engstruct.2018.05.084
[9] P.J. Wang, J.Z. Xiao, K.I. Kawaguchi, L.C. Wang, Automatic ceiling damage detection in large-span structures based on computer vision and deep learning, Sustainability 14 (2022) 3275, https://doi.org/10.3390/su14063275
[10] Y.J. Xu, X.Z. Lu, B. Cetiner, E. Taciroglu, Real-time regional seismic damage assessment framework based on long short-term memory neural network, Comput.-Aided Civil Infrastruct. Eng. 36 (2021) 504�C521, https://doi.org/10.1111/mice.12628
[11] C. Xiong, Q.S. Li, X.Z. Lu, Automated regional seismic damage assessment of buildings using an unmanned aerial vehicle and a convolutional neural network, Autom. Constr. 109 (2020) 102994, https://doi.org/10.1016/j.autcon.2019.102994
[12] K.H. Chang, C.Y. Cheng, Learning to simulate and design for structural engineering, in: Proceedings of the 37th International Conference on Machine Learning, 2020, pp. 1426�C1436. https://proceedings.mlr.press/v119/chang20a.html
[13] F. Ranalli, F. Flager, M. Fischer, A ground structure method to minimize the total installed cost of steel frame structures, Int. J. Civ. Environ. Eng. 12 (2018) 160�C168. https://www.semanticscholar.org/paper/A-Ground-Structure-Method-to-Minimize-the-Total-of-Ranalli-Flager/0adc7aa37bcc0155ed7a91a29cca87278d399530
[14] C.M. Herr, R.C. Ford, Cellular automata in architectural design: from generic systems to specific design tools, Autom. Constr. 72 (2016) 39�C45, https://doi.org/10.1016/j.autcon.2016.07.005
[15] Y. Zhang, C. Mueller, Shear wall layout optimization for conceptual design of tall buildings, Eng. Struct. 140 (2017) 225�C240, https://doi.org/10.1016/j.engstruct.2017.02.059
[16] H. Lou, B. Gao, F. Jin, Y. Wan, Y. Wang, Shear wall layout optimization strategy for high-rise buildings based on conceptual design and data-driven tabu search, Comput. Struct. 250 (2021) 106546, https://doi.org/10.1016/j.compstruc.2021.106546
[17] M. Mangal, J.C.P. Cheng, Automated optimization of steel reinforcement in RC building frames using building information modeling and hybrid genetic algorithm, Autom. Constr. 90 (2018) 39�C57, https://doi.org/10.1016/j.autcon.2018.01.013
[18] J. Ferreiro-Cabello, E. Fraile-Garcia, E.M. de P. Ascacibar, F.J. Martinez-de-Pison, Metamodel-based design optimization of structural one-way slabs based on deep learning neural networks to reduce environmental impact, Eng. Struct. 155 (2018) 91�C101, https://doi.org/10.1016/j.engstruct.2017.11.005
[19] C. Hou, X.G. Zhou, Strength prediction of circular CFST columns through advanced machine learning methods, J. Build. Eng. 51 (2022) 104289, https://doi.org/10.1016/j.jobe.2022.104289
[20] M. Yucel, G. Bekdaş, S.M. Nigdeli, S. Sevgen. Estimation of optimum tuned mass damper parameters via machine learning, J. Build. Eng. 26 (2019) 100847, https://doi.org/10.1016/j.jobe.2019.100847
[21] H. Sun, H.V. Burton, H. Huang, Machine learning applications for building structural design and performance assessment: state-of-the-art review, J. Build. Eng. 33 (2021) 101816, https://doi.org/10.1016/j.jobe.2020.101816
[22] R. Kicinger, T. Arciszewski, K.D. Jong, Evolutionary computation and structural design: a survey of the state-of-the-art, Comput. Struct. 83 (2005) 1943�C1978, https://doi.org/10.1016/j.compstruc.2005.03.002
[23] E. Fraile-Garcia, J. Ferreiro-Cabello, E. Martinez-Camara, E. Jimenez-Macias, Adaptation of methodology to select structural alternatives of one-way slab in residential building to the guidelines of the European Committee for Standardization (CEN/TC 350), Environ. Impact Assess. Rev. 55 (2015) 144�C155, https://doi.org/10.1016/j.eiar.2015.08.004
[24] E. Fraile-Garc��a, J. Ferreiro-Cabello, E. Sodupe-Ortega, A. Sanz-Garcia, Combined assessment of the environmental, economic and social impacts of structural solutions for residential construction, Inf. Constr. 67 (2015) e101, http://dx.doi.org/10.3989/ic.14.041
[25] S. Tafraout, N. Bourahla, Y. Bourahla, A. Mebarki, Automatic structural design of RC wall-slab buildings using a genetic algorithm with application in BIM environment, Autom. Constr. 106 (2019) 102901, https://doi.org/10.1016/j.autcon.2019.102901
[26] A. Nimtawat, P. Nanakorn, Automated layout design of beam-slab floors using a genetic algorithm, Comput. Struct. 87 (2009) 1308�C1330, https://doi.org/10.1016/j.compstruc.2009.06.007
[27] A. Nimtawat, P. Nanakorn, A genetic algorithm for beam�Cslab layout design of rectilinear floors, Comput. Struct. 32 (2010) 3488�C3500, https://doi.org/10.1016/j.engstruct.2010.07.018
[28] C.M. Herr, T. Fischer, A notation to aid column and beam layout design for reinforced concrete construction in China, in: Proceedings of the 19th International Conference on Computer-Aided Architectural Design Research in Asia, Kyoto, Japan, 2014, pp. 399�C408. https://www.researchgate.net/publication/273320862_A_Notation_to_Support_Column_and_Beam_Layout_Design_for_Reinforced_Concrete_Construction_in_China
[29] P.N. Pizarro, L.M. Massone, F.R. Rojas, R.O. Ruiz, Use of convolutional networks in the conceptual structural design of shear wall buildings layout, Eng. Struct. 239 (2021) 112311, https://doi.org/10.1016/j.engstruct.2021.112311
[30] P.N. Pizarro, L.M. Massone, Structural design of reinforced concrete buildings based on deep neural networks, Eng. Struct. 241 (2021) 112377, https://doi.org/10.1016/j.engstruct.2021.112377
[31] W.J. Liao, X.Z. Lu, Y.L. Huang, Z. Zheng, Y.Q. Lin, Automated structural design of shear wall residential buildings using generative adversarial networks, Autom. Constr. 132 (2021) 103931, https://doi.org/10.1016/j.autcon.2021.103931
[32] O. Ronneberger, P. Fischer, T. Brox, U-Net: convolutional networks for biomedical image segmentation, in: International Conference on Medical Image Computing and Computer-Assisted Intervention, Springer, Cham, 2015, pp. 234�C241, https://doi.org/10.1007/978-3-319-24574-4_28
[33] Z. Pan, J. Xu, Y. Guo, Y. Hu, G. Wang, Deep learning segmentation and classification for urban village using a worldview satellite image based on U-Net, Remote Sens. 12 (2020) 1574, https://doi.org/10.3390/rs12101574
[34] J. Cheng J, W. Xiong, W. Chen, Y. Gu, Y. Li, Pixel-level crack detection using U-Net, in: Proceedings of TENCON 2018-2018 IEEE Region 10 Conference, Jeju, Korea, 2018, pp. 0462�C0466. https://ieeexplore.ieee.org/document/8650059
[35] T.Q. Le, P.H. Chiu, C. Ooi, U-Net-based surrogate model for evaluation of microfluidic channels, Int. J. Comput. Methods (2021) 2141018, https://doi.org/10.1142/S0219876221410188
[36] P. Isola, J.Y. Zhu, T. Zhou, A.A. Efros, Image-to-image translation with conditional adversarial networks, IEEE Conf. Comp. Vis. Pattern Recognit. (2017) 1125�C1134. https://openaccess.thecvf.com/content_cvpr_2017/papers/Isola_Image-To-Image_Translation_With_CVPR_2017_paper.pdf
[37] T.C. Wang, M.Y. Liu, J.Y. Zhu, A. Tao, J. Kautz, B. Catanzaro, High-resolution image synthesis and semantic manipulation with conditional GANs, IEEE Conf. Comp. Vis. Pattern Recognit. (2018) 8798�C8807. https://openaccess.thecvf.com/content_cvpr_2018/papers/Wang_High-Resolution_Image_Synthesis_CVPR_2018_paper.pdf
[38] N. Nauata, K. Chang, C. Cheng, G. Mori, Y. Furukawa, House-GAN: relational generative adversarial networks for graph-constrained house layout generation, Eur. Conf. Comp. Vis. (2020) 162�C177, https://doi.org/10.1007/978-3-030-58452-8_10
[39] N. Nauata, S. Hosseini, K.H. Chang, H. Chu, C.Y. Cheng, House-GAN++: generative adversarial layout refinement network towards intelligent computational agent for professional architects, in: Proceedings of the IEEE/CVF Conference on Computer Vision and Pattern Recognition, Nashville, TN, USA, 2021, pp. 13632�C13641. https://ieeexplore.ieee.org/document/9577959
[40] X.Z. Lu, W.J. Liao, Y. Zhang, Y.L. Huang, Intelligent structural design of shear wall residence using physics-enhanced generative adversarial networks, Earthq. Eng. Struct. Dyn. (2022), https://doi.org/10.1002/eqe.3632
[41] J. Yu, J. Xu, Y. Chen, W. Li, Q. Wang, B. Yoo, et al., Learning generalized intersection over union for dense pixelwise prediction, in: Proceedings of the 37th International Conference on Machine Learning, 2021, pp. 12198�C12207. https://proceedings.mlr.press/v139/yu21e.html
[42] T.Y. Zhang, C.Y. Suen, A fast parallel algorithm for thinning digital patterns, Commun. ACM 27 (1984) 236�C239, https://doi.org/10.1145/357994.358023
[43] J. Matas, C. Galambos, J. Kittler, Robust detection of lines using the progressive probabilistic Hough transform, Comput. Vis. Image Underst. 78 (2000) 119�C137, https://doi.org/10.1006/cviu.1999.0831
[44] C.B. Barber, D.P. Dobkin, H. Huhdanpaa, The quickhull algorithm for convex hulls, ACM Trans. Math. Softw. 22 (1996) 469�C483. https://www.researchgate.net/publication/242414606_The_Quickhull_Algorithm_for_Convex_Hulls
[45] J.M. Linhart, Algorithm 885: computing the logarithm of the normal distribution, ACM Trans. Math. Softw. 35 (2008) 20, https://doi.org/10.1145/1391989.1391993
[46] JGJ3�C2010, Technical specification for concrete structures of tall building, China Architecture & Building Press, Beijing, 2010 (in Chinese)
[47] Computers & Structures Inc., ETABS, California, Online: https://www.csiamerica.com/products/etabs
[48] GB 50096�C2011, Design code for residential buildings, China Architecture & Building Press, Beijing, 2011 (in Chinese)
Appendix A. Color Coding Used in Drawing Semantics
Different colors were used to represent the different components in the drawings. The specific colors used in this study are listed in Table A.1.
Table A.1 Component drawing colors
|
Semantic color of building components |
|||||||||||||
|
Building components |
Infill wall |
Shear wall |
Window |
Exterior door |
Interior door |
Beam |
|||||||
|
Colors |
Gray |
Red |
Yellow |
Blue |
Magenta |
Dark green |
|||||||
|
R |
183 |
255 |
255 |
0 |
255 |
82 |
|||||||
|
G |
183 |
0 |
255 |
0 |
0 |
120 |
|||||||
|
B |
183 |
0 |
0 |
255 |
255 |
63 |
|||||||
|
Semantic color of building functional spaces |
|||||||||||||
|
Building functional spaces |
Living room |
Bedroom |
Bathroom |
Balcony |
Kitchen |
Cloakroom |
Stairwell |
Elevator |
Shaft |
General space |
|||
|
R |
191 |
255 |
0 |
0 |
127 |
191 |
255 |
255 |
255 |
0 |
|||
|
G |
0 |
127 |
63 |
255 |
0 |
255 |
191 |
0 |
0 |
76 |
|||
|
B |
255 |
0 |
255 |
127 |
255 |
0 |
0 |
255 |
63 |
38 |
|||
Appendix B. HSV Value Range of Critical Elements in Image of Floor Structure
Conventional image pixel colors are stored and expressed in the RGB (i.e., red, green, and blue) format. However, because the RGB format represents the expression of colors in discrete spaces, it is difficult to divide a continuous color space through the RGB range. Therefore, this study adopted the HSV (i.e., hue, saturation, and value) color space expression, which is conducive to an effective division of colors. To accurately extract different elements in pixel images, pixels were categorized and distinguished according to the range of the HSV value of each pixel in the image. The HSV value ranges corresponding to each element are shown in Table B.1. The conversion from the RGB space to the HSV space is based on the open-source computer vision library OpenCV.
Table B.1 HSV value ranges of critical elements
|
Infill wall |
Shear wall |
Window |
Outdoor door |
Indoor door |
Beam |
||
|
Hmin |
0 |
0 |
156 |
25 |
100 |
135 |
35 |
|
Hmax |
180 |
10 |
180 |
34 |
124 |
155 |
77 |
|
Smin |
0 |
43 |
43 |
43 |
200 |
43 |
|
|
Smax |
43 |
255 |
255 |
255 |
255 |
255 |
|
|
Vmin |
46 |
46 |
46 |
46 |
200 |
46 |
|
|
Vmax |
220 |
255 |
255 |
255 |
255 |
255 |
|
Appendix C. Design of Beam Members Based on Defined Rules
Lou et al. [16] proposed arranging beams in the distributable area of the shear wall. Liao et al. [31] showed that the area above the infill walls, doors, and windows could be used as a potential distributable area of the shear wall. Therefore, the beam component layout rules adopted in this study are: all the distributable areas of the shear wall (including the area above the partition walls, doors, and windows), except for the shear wall components, are arranged as beams. This method was used to design the beam layout of Model-RuleDesign-1. Different from Model-RuleDesign-1, the coupling beams and frame beams of Model-RuleDesign-2 are distinguished based on the proposed method in this work. The method for determining the cross-sectional sizes of coupling beams and frame beams is described in Subsection 5.3.
Appendix D. Questionnaire for Human Experts
An illustration of typical questions in the questionnaire mentioned in Subsection 6.2 is shown in Table D.1. Note that designs generated by the proposed deep learning method are referred to as ��AI��s design�� for ease of understanding.
Table D.1 Typical questions in the questionnaire for human experts
|
[Question] Please distinguish the following typical-floor layout design: AI��s design or engineer��s design? |
|
|
|
|
|
The typical-floor layout design |
The determination of coupling and frame beams |
|
[Choice] �� AI��s design �� Engineer��s design |
|
|
[Question] Rationality score of the typical-floor layout design (1 - Unrational, 5 - Rational) |
|
|
[Choice] �� 1 �� 2 �� 3 �� 4 �� 5 |
|
|
[Question] Rationality score of the determination of coupling and frame beams (1 - Unrational, 5 - Rational) |
|
|
[Choice] �� 1 �� 2 �� 3 �� 4 �� 5 |
|