Abstract
Structural scheme design of shear wall structures is important because it is the first stage that guides the project along its entire structural design process and significantly impacts the subsequent design stages. Design methods for shear wall layouts based on deep generative algorithms have been proposed and achieved some success. However, current generative algorithms rely on pixel images to design shear wall layouts, which have many model parameters and require intensive calculations. Moreover, it is challenging to use pixel image-based methods to reflect the topological characteristics of structures and connect them with the subsequent design stages. The above defects can be effectively solved by representing a shear wall structure in graph data form and adopting graph neural networks (GNNs), which have a robust topological-characteristic-extraction capability. However, there is no existing research using GNN methods in the design of shear wall structures owing to the lack of graph representation methods and high-quality structural graph data for shear walls. Therefore, this study develops an intelligent design method for shear wall layouts based on GNNs. Two graph representation methods for a shear wall structure��graph edge representation and graph node representation��are examined. A data augmentation method for shear wall structures in graph data form is established to enhance the universality of the GNN performance. An evaluation method for both graph representation methods is developed. Case studies show that the shear wall layout designed using the established GNN method is highly similar to the design by experienced engineers.
Keywords
graph neural network; graph representation method; shear wall structure; intelligent shear wall layout design; deep learning
1. Introduction
High-rise buildings are commonly being built with global urbanization [1-2]. Shear walls can effectively resist lateral loads and are usually reinforced concrete walls. The shear wall is the main element that resists horizontal loads in a shear wall structure [3]. Reinforced concrete shear wall structures are becoming the primary high-rise building type [3]. However, most of their structural scheme design processes are manual, necessitating an improvement in efficiency. To this end, automated design methods have been an emerging research topic, with advances based on evolutionary algorithms and neural networks.
Automated design methods based on evolutionary algorithms [4-6] rely on explicitly defined constraints and rules. They face the following challenges: (a) Explicit definitions of design rules are rarely sufficient because it is prohibitively difficult to consider all constraints a priori. (b) Potential conflicts and priorities between constraints are obscure. Resolving these conflicts between multiple objectives and constraints is nontrivial. (c) Programing complex constraint rules into computers is not straightforward.
Intelligent structural design methods include pixel image-based deep learning methods using convolutional neural networks (CNNs) [7-9] and generative adversarial networks (GANs) [10-12]. Pixel image-based methods use pixel images (such as BMP or PNG images) as the data format, and pixel images can be represented using 3D tensors generally. However, high-resolution pixel images are required to represent a shear wall structure, leading to overwhelming model parameters and computational workloads. Moreover, using pixel images to represent structures cannot trivially reflect the topological characteristics of structures, and connecting them with the subsequent design stages is inconvenient.
This paper attempts to find an alternative solution and overcome the limitations associated with evolutionary algorithms and pixel image-based deep learning methods. It was discovered that graph data consisting of graph nodes and edges are potent forms for representing topological relationships between elements [13-14] and connect precisely with structural forms. Graph neural networks (GNNs) operate on graph data, typically non-Euclidean [15-17], and involve significantly fewer parameters and less computational expense. Therefore, GNNs are promising candidates to represent the topological characteristics of complex systems and contribute to the automated design of shear wall structures.
Existing GNNs and other graph-related neural networks are mainly used in structural designs with simple structural forms (e.g., frame structures) [18-22]. Although GNNs are sophisticated in representing complex topological features, they are yet to be applied to the design of shear wall structures for the following reasons: (a) Graph representation methods for shear wall structures are lacking. An appropriate graph representation method is the foundation for applying GNNs to structural design; however, there is no graph representation research for shear wall structures. (b) There is a lack of high-quality structural data represented in graph form. Data are frequently key constraints in data-driven intelligent methods.
This study aims to push the envelope and bridge the gaps in developing a GNN-based design method. Section 3 outlines the proposed GNN-based design method. Section 4 introduces the graph edge and node representation methods of a shear wall structure, data augmentation method, and GNN models developed in the study. Section 5 discusses the performance of the different graph representation methods and GNN models. Section 6 presents case studies under various design conditions.
2. Literature Review
2.1. Intelligent Design Methods
Automatic and intelligent design methods are widely used in architectural and structural designs [23-26]. Manfred et al. [23] realized instant structural feedback and performance prediction for architectural conceptual designs based on SketchUp. Boonstra et al. [24] proposed a hybrid method of an evolutionary algorithm and simulations of co-evolutionary design processes to optimize the early-stage spatial design of buildings. Martin et al. [25] proposed a method to address the architectural flexibility requirements for automated structural design schemes of steel and concrete office buildings in the early design phase. Steiner et al. [26] proposed a novel method for designing architectural floor plans that integrates structural layout analysis directly into the planning process.
In the field of structural design, many automatic design methods based on evolutionary algorithms have been proposed [4-6, 27-32]. For example, Zhang & Mueller [4] used an improved evolutionary algorithm for shear wall layout optimization of high-rise buildings. Zhou et al. [6] conducted an automated design of shear wall structures based on an improved genetic algorithm and prior knowledge.
Most existing intelligent structural design methods are based on pixel image-processing neural networks, such as CNNs and deep convolutional GANs. Liao et al. [10], Pizarro et al. [8], Pizarro & Massone [9], and Lu et al. [11] proposed design methods for shear wall structures based on CNNs, GANs, and physics-enhanced GANs. Liao et al. [12] developed ��fused-text-image-to-image�� GANs to guide the design of shear wall layouts by coupling text and image data. Zhao et al. [33] developed a beam�Cslab design method for shear wall structures that coupled building space and element features. Fei et al. [34] integrated existing design methods to build a structural design platform, which significantly improved the efficiency of structural design. Zhao et al. [35] further developed attention-enhanced GANs for designing shear wall structures.
Although the above studies based on pixel image-processing deep neural networks have significantly progressed, the following problems still exist: (a) Using pixel images to represent shear wall structures is computationally expensive. Liao et al. [10], Lu et al. [11], Liao et al. [12], Zhao et al. [33], Fei et al. [34], and Zhao et al. [35] used 1024 �� 512 and 2048 �� 1024 high-resolution images to represent the layouts of components of shear wall structures. However, in high-resolution pixel images, <20% of pixels represent critical components, such as walls, doors, and windows, and the features of key components are sparse. In addition, end-to-end high-resolution image generation methods relying on convolution and deconvolution operations require multiple convolutional and deconvolution layers, which consume a large amount of computing resources. Moreover, large-memory and high-performance GPUs are frequently essential [36]. (b) Using pixel images to represent shear wall structures cannot consider the topological features between structural components. Although pixel images can reflect the spatial positions of key components well, they have difficulty in reflecting the topological characteristics between them [19]. Note that building spaces and structural components have natural topological connections, which can guide architectural and structural designs [19-22, 37-39]. (c) Using pixel images to represent shear wall structures is not connected well with the finite element modeling and mechanical analysis required in the design development and construction documentation stages after the structural scheme design stage. An additional algorithm is necessary to extract the coordinates of structural elements from pixel images in a vectorized form [33-34].
2.2. Graphs, GNNs, and Corresponding Application in Building Design
Graph data have the following typical characteristics [40] that can overcome the deficiencies of pixel image-based methods: (a) Graph data consist of graph nodes and edges. Combined with the location features of nodes, a graph is a natural vectorized form. The vectorized format facilitates the connection between the structural scheme design and subsequent detail development and construction documentation stages in the structural design process. (b) Graphs can consider additional features of graph nodes and edges [40-41]. Each graph node or edge can have its feature vector, which is richer than the conventional three-channel representation of pixel images. Graph edges frequently also possess important features. However, CNNs that deal with pixel images do not possess a mechanism to represent edge features. (c) Graph data are irregular in connectivity [42]. The distributions of nodes and edges in graphs frequently have free-forms [19, 40], which are suitable for efficiently representing complex and free-form building structures. However, pixel images are constrained by fixed sizes and limited spatial resolution. Frequently, an entire building structure needs to be scaled, which will damage its original architectural and structural features. Moreover, only high-resolution images can represent a shear wall structure [10-12], resulting in high computational complexity.
GNNs can be classified into spectral- and spatial-based models [15�C17]. The idea of the spectrum-based graph neural network is to perform a spectral decomposition operation on the Laplacian matrix of the graph and use the obtained eigenvalues and eigenvectors to define the convolution operation in the spectral space [43]. Representative spectral-based GNNs are ChebyNet [44] and graph convolutional networks [45]. In general, Laplacian matrices of different graphs cannot be transferred. Therefore, spectral-based GNNs often have difficulty sharing parameters between different graphs and have poor scalability [40]. However, spatial-based GNNs do not suffer from this drawback [17]. Spatial-based GNNs aggregate adjacent node information directly in space, and the message-passing neural network (MPNN) is proposed as a general framework for spatial-based graph convolution [13, 46�C47]. Therefore, the spatial-based GNN has a stronger transfer and generalization ability [40] and is more suitable for structural design than the spectral-based GNN [19]. GraphSAGE, a spatial-based GNN, was proposed by Hamilton et al. [48]. GraphSAGE extended GNN��s learning mode from transductive learning to inductive learning and implemented node embedding via a common aggregation function, which has a stronger generalization ability for unknown nodes. Veličković et al. [49] proposed a graph attention network that introduced the attention mechanism into GNNs and improved GNN aggregation by using masked self-attention layers. In addition to the above-mentioned classic GNNs, GNNs also have more abundant development [50�C53].
GNNs are commonly used in social networks, molecular property prediction, and other fields, reflecting their substantial advantages in capturing the topological features of data [54-55]. GNNs and other graph-related neural networks have been used in architectural and structural design [20-22, 37-38, 56-58]. However, existing studies focus on simple structures, such as frames and trusses [18-19, 59-60]. For example, Hawkins et al. [60] applied a GNN heuristic search to construction planning. Zhao et al. [19] designed beam layouts for regular and irregular frame structures based on GNNs.
2.3. Research Gap
In the existing research on structural layout design, automatic methods based on evolutionary algorithms rely on predefined rules. However, adequately defining their rules and encoding them is difficult. Intelligent design methods based on CNNs and GANs cannot consider the topological characteristics between building components and are challenging to connect with the subsequent design stages. The topological features between building components can be represented by graphs and extracted using GNNs. Using a suitable graph representation method to represent structures has the advantages of fewer parameters and clearer topological structural features than methods using high-resolution pixel images. However, existing studies using GNNs in structural design mainly focus on simple structures, and there are no investigations on graph representation methods for shear wall structures or the application of GNNs to their layout design.
3. The GNN-based Design Method for Shear Wall Layout
This study establishes a GNN-based shear wall layout design method, as shown in Figure 1. The developed method consists of three parts: (1) graph representations of the shear wall structure, (2) GNN model training, and (3) GNN model application.
(1) Graph representations of shear wall structures: The graph representation methods for shear wall structures involve the use of graph nodes and edges to represent their structural and nonstructural components (such as walls, doors, and windows), which is a critical prerequisite for applying a GNN to the shear wall structural design. In this study, graph edge and node representation methods are developed to explore the best method to represent shear wall structures as graphs, as detailed in Sections 4.1 and 4.2. The rigid-body displacement of an entire shear wall structure does not affect the relative positions of its piers. Therefore, this study develops a data augmentation method for the shear wall layout graphs to improve the universality of the established method and the adequacy of data utilization (see Section 4.3).
(2) GNN model training: Shear walls are represented by graph edges or nodes. Accordingly, different GNN model training methods are developed, whose basic principle is to determine whether graph edges or graph nodes are suitable as shear walls. Different hyperparameters of the GNN models are explored to determine the most suitable model architecture. Ten-fold cross-validation is performed to evaluate the performances of the different models accurately and reliably. Refer to Section 4.4 for its details. This study establishes an evaluation method for the design results of a shear wall layout to compare the different graph representation methods and GNN models. Related discussions and results are presented in Section 5.
(3) GNN model application: Layout designs of shear walls are generated by inputting the architectural layout graph that is designed into the well-trained GNN models. Case studies of shear wall structures under different design conditions are presented in Section 6. A shear wall structure graph is automatically obtained from an AutoCAD drawing and takes approximately 5 min. Specifically, the coordinates of structural and nonstructural components, such as walls, doors, and windows, are extracted from the corresponding layers of architectural AutoCAD drawings using the GANIO plug-in for AutoCAD [34]. Subsequently, graph representations of shear wall structures, as described in Sections 4.1 and 4.2, are defined.
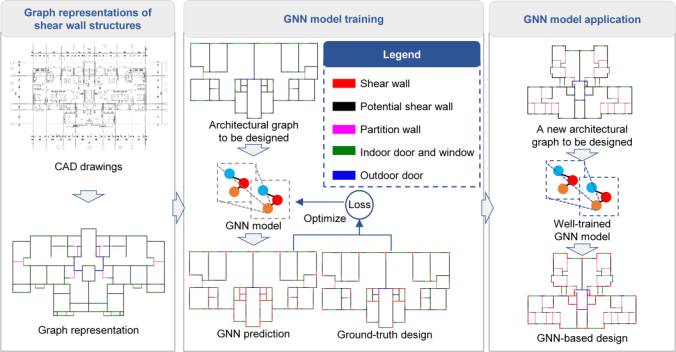
Figure 1 The GNN-based design method for shear wall layout
4. Graph Representations of Shear Wall Structures and GNN Models
A graph consists of nodes and edges between the nodes. The structural and nonstructural components of shear wall structures considered in this study are walls, outdoor doors, indoor doors, and windows. The graph representation methods for shear wall structures use graph nodes and edges to represent these structural and nonstructural components.
The two types of walls in shear wall structures that are designed are as follows:
(a) Potential shear walls (PSWs), which are walls where shear walls may be arranged.
(b) Partition walls (PWs), which are walls only used as building space divisions and cannot be arranged with shear walls owing to building functions or thickness requirements.
Consequently, shear walls can only be arranged at PSWs and not at the locations of the non-PSW components, such as partition walls, doors, and windows. Usually, the positions of all building walls except the PWs in the architectural design scheme can be used as the PSW layout, and experienced architects can also provide the PSW layout in practical applications.
When using a graph to represent a shear wall structure, using graph edges to represent linear components (walls, doors, and windows) and graph nodes to represent component intersections is straightforward. Zhao et al. [19] found that a graph representation of a structure in an intuitive form is effective. Therefore, this study primarily focuses on graph edge representation methods for shear wall structures. Zhao et al. [19] also found that using graph nodes to represent structural components of simple structures was feasible. Therefore, to complement the exploration of the graph edge representation methods, graph node representation methods for shear wall structures are also examined.
4.1. The Graph Edge Representation Method for Shear Wall Structures
The considered graph edge representation method for shear wall structures uses graph edges to represent their structural and nonstructural components (such as walls, doors, and windows) and only graph nodes to represent the component intersections. The following four graph edge representation methods, as shown in Figure 2, are examined in this study:
Edge-PSW: Only PSWs are included in a graph.
Edge-PSW-DW: PSWs, doors, and windows are included in a graph.
Edge-PSW-PW: PSWs and PWs are included in a graph.
Edge-PSW-PW-DW: PSWs, PWs, doors, and windows are included in a graph.
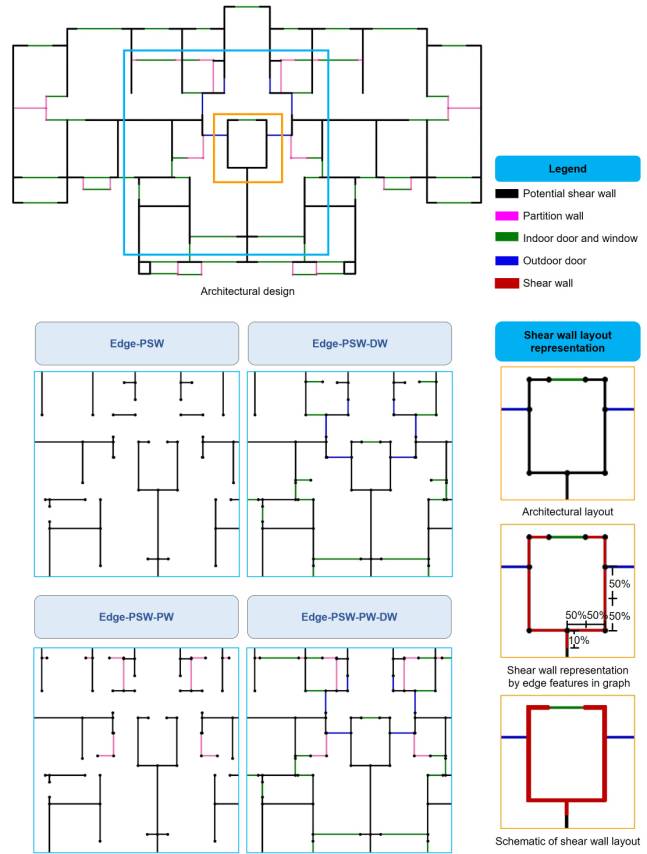
Figure 2 Graph edge representation methods for shear wall structures
For a PSW edge, the entire wall segment may comprise shear walls, or only a part of the wall segment may be arranged as shear walls. Therefore, the arrangement of these shear walls is represented by their length ratio at both ends of the PSW graph edge, as shown in Figure 3. If a PSW edge is entirely covered with shear walls, the lengths of the shear walls at both ends account for 50%.
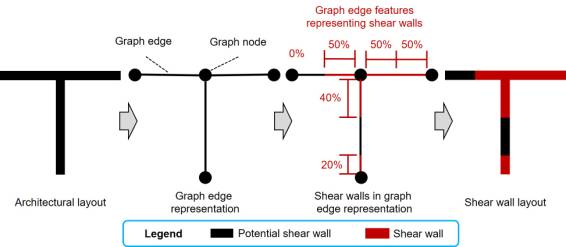
Figure 3 Shear walls in graph edge representation methods
Zhao et al. [19] studied beam layouts of frame structures based on GNNs. They found that simultaneously considering the features of graph nodes and edges yielded the best performance. Therefore, in this study, the features of graph nodes and edges are considered simultaneously. The graph node features include the node locations. The graph edge features are the class, node positions at both ends, and length of the edge (Table 1). The classes are represented by a one-hot encoding. For example, [1,0] and [0,1] can be used to represent 2 classes, and [1,0,0], [0,1,0] and [0,0,1] can be used to represent 3 classes.
All coordinates are normalized using LGraphScale, as expressed in Equation (1).
|
cn = c − ccenter / LGraphScale, |
(1) |
where cn is the normalized coordinate, c is the original coordinate, and ccenter is the center coordinate of the origin shear-wall-layout graph. According to statistics, most of the shear wall structures used in this study have a plane span size of less than 40 m. Therefore, LGraphScale was taken as 20480 mm so that most structural coordinates can be normalized in [-1, 1].
Table 1 Node and edge features in graph edge representation methods
|
Graph edge representation methods |
Node features |
Edge features |
|
Edge-PSW |
Node |
Edge of PSW |
|
[xn, yn] |
[xleft, yleft, xright, yright, length] |
|
|
Edge-PSW-DW |
Edge of PSW |
|
|
[1, 0, 0, xleft, yleft, xright, yright, length] |
||
|
Node |
Edge of indoor door and window |
|
|
[xn, yn] |
[0, 1, 0, xleft, yleft, xright, yright, length] |
|
|
Edge of outdoor door |
||
|
[0, 0, 1, xleft, yleft, xright, yright, length] |
||
|
Edge-PSW-PW |
Edge of PSW |
|
|
Node |
[1, 0, xleft, yleft, xright, yright, length] |
|
|
[xn, yn] |
Edge of PW |
|
|
[0, 1, xleft, yleft, xright, yright, length] |
||
|
Edge-PSW-PW-DW |
Edge of PSW |
|
|
[1, 0, 0, 0, xleft, yleft, xright, yright, length] |
||
|
Edge of PW |
||
|
Node |
[0, 1, 0, 0, xleft, yleft, xright, yright, length] |
|
|
[xn, yn] |
Edge of indoor door and window |
|
|
[0, 0, 1, 0, xleft, yleft, xright, yright, length] |
||
|
Edge of outdoor door |
||
|
[0, 0, 0, 1, xleft, yleft, xright, yright, length] |
Note: xn and yn are node coordinates, xleft and yleft are node coordinates at one end of edge, xright and yright are node coordinates at other end of edge, and length is length of edge.
4.2. Graph Node Representation Methods for Shear Wall Structures
The graph node representation methods for shear wall structures use graph nodes to represent their structural and nonstructural components (such as walls, doors, and windows) and only graph edges to represent the connection relationships between the graph nodes. Figure 4 shows a schematic of the graph node representation methods, which represent the structures shown in Figure 2. The representation of a shear wall layout is realized by predicting whether a PSW graph node belongs to a shear wall class in the graph node representation method.
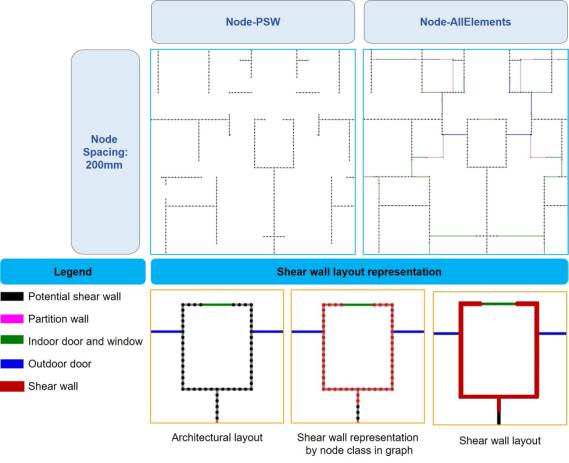
Figure 4 Graph node representation methods for shear wall layouts
Six graph node representation methods are examined. The parameters in Figure 4 are as follows.
(1) Node-PSW: Only PSWs are included in a graph.
(2) Node-All Elements: PSWs, PWs, doors, and windows are included in a graph. Only PSWs are represented by graph nodes, and PWs, doors, and windows are represented by graph edges.
(3) Node Spacing: Node spacing is the spacing of nodes used to represent PSWs. Three scenarios of 50 mm, 100 mm, and 200 mm are investigated.
LnodeSpacing is used to represent the node spacing. A PSW of length LPSW is equally divided into Nspacing parts to arrange the nodes, as expressed in Equation (2).
|
Nspacing = ��(LPSW / LnodeSpacing), |
(2) |
where �� means the operation of rounding up an integer.
Similar to the graph edge representation methods for shear wall structures, the graph node representation methods consider the features of the nodes and edges. The graph node features include the node location and class. The graph edge features consist of the edge class and the node positions at both ends of the edge (Table 2). Classes are also represented using the one-hot encoding method. For the Node-PSW representation method, a graph has only one category of PSWs. Thus, there are no category items in the node and edge features. All coordinates and lengths are normalized using Equation (1).
Table 2 Node and edge features in graph node representation methods
|
Graph-node-representation methods |
Node features |
Edge features |
|
Node-PSW |
Node of PSW |
Edge of PSW |
|
[xn, yn] |
[xleft, yleft, xright, yright] |
|
|
Node-AllElements |
Node of PSW |
Edge of PSW |
|
[1, 0, 0, 0, xn, yn] |
[1, 0, 0, 0, xleft, yleft, xright, yright] |
|
|
Node of PW |
Edge of PW |
|
|
[0, 1, 0, 0, xn, yn] |
[0, 1, 0, 0, xleft, yleft, xright, yright] |
|
|
Node of indoor door and window |
Edge of indoor door and window |
|
|
[0, 0, 1, 0, xn, yn] |
[0, 0, 1, 0, xleft, yleft, xright, yright] |
|
|
Node of outdoor door |
Edge of outdoor door |
|
|
[0, 0, 0, 1, xn, yn] |
[0, 0, 0, 1, xleft, yleft, xright, yright] |
Note: xn and yn are node coordinates; xleft and yleft are node coordinates at one end of the edge, and xright and yright are node coordinates at other end of edge.
4.3. Augmentation and Grouping of Shear Wall Structure Graphs
Data augmentation is a common and useful method for improving the generalizability of model performance [61]. The rigid-body displacement of an entire shear wall structure in a drawing does not affect the layout of the shear walls. Therefore, this study establishes a random combination of data augmentation methods. These include upside-down flipping (two cases), counterclockwise rotation with a modulus of 90�� (four cases), up or down translation with a modulus of 2 m and a range of 0�C20 m (21 cases), and left or right translation with a modulus of 2 m and a range of 0�C20 m (21 cases). The data volume is equivalent to being enlarged by 2 �� 4 �� 21 �� 21 = 3528 times. This data augmentation process is embedded in the training process of the GNN models.
Liao et al. [10] found that individual training for different design condition groups can categorically consider the effects of different seismic design intensities and structural heights on the shear wall layout and wall ratio of shear wall structures. Therefore, based on their research, in this study, the dataset of shear wall structures is divided into three design condition groups: Group7-H1, Group7-H2, and Group8. The shear wall structures in Group7-H1 possess seismic design intensities of 7��, i.e., the peak ground acceleration (PGA) with 10% probability of exceedance in 50 years is 100 cm/s2, and structural heights ��50 m. The shear wall structures in Group7-H2 have seismic design intensities of 7�� and structural heights >50 m. The shear wall structures in Group8 possess seismic design intensities of 8��, i.e., the PGA with 10% probability of exceedance in 50 years is 200 cm/s2. Specifically, there are 96, 70, and 128 training sets and 10, 10, and 10 testing sets in Group7-H1, Group7-H2, and Group8, respectively.
4.4. GNN Models for Shear Wall Layout Design
GNNs can well capture the topological features of structures through the feature enhancement of graph edges [19]. In particular, for a graph edge representation method for shear wall structures, edge features are crucial for the shear wall layout design based on edge feature prediction. Moreover, Zhao et al. [19] demonstrated the advantages of edge feature-enhanced GNN models over other GNN models. Therefore, this study adopts the Graph-SF model proposed by Zhao et al. [19] as the core algorithm of the developed GNN models.
For the graph edge representation methods for shear wall structures, The shear wall layout design is abstracted as an edge feature prediction problem in the GNN for the graph edge representation methods for shear wall structures, as shown in Figure 5(a). The neural network form is coupled with a multilayer perceptron (MLP) after the GNN part to predict the edge features. The input features of the MLP network are the combined feature of an edge and the nodes at both ends, and their dimensions are 2��D_out+D_e (refer to Table 3 for the definitions of the parameters). When designing a shear wall layout based on edge feature prediction, the arrangement of the shear walls is represented by their length ratios at both ends of a PSW graph edge. Therefore, the length ratios of the shear walls at both ends of a PSW graph edge are the output features of the GNN models, which have two dimensions. The L1 loss function, i.e., mean absolute error [62], as expressed in Equation (3) is adopted.
|
|
(3) |
where N is the edge sample number; yi is the target value of the i-th sample; pi is the predicted value of the i-th sample.
Six GNN models with different hyperparameters, referred to as GNN-edge prediction (GNN-EP), are explored to obtain a suitable GNN architecture, as shown in Figure 5(b). Models GNN-EP-1�CGNN-EP-6 are different combinations of a GNN and an MLP network. The definitions of the parameters of the GNN-EP models are summarized in Table 3.
Table 3 Definitions of parameters of GNN-EP models
|
Symbol |
Meaning |
|
SFLayer() |
GNN layer of Graph-SF model [19]. |
|
Linear() |
MLP network layer, i.e., fully connected layer. |
|
BatchNorm() |
Batch normalization layer. |
|
Dropout(p) |
Dropout layer. The dropout rate p taken as 0.25 in developed method. |
|
D_in |
Dimensions of graph node features. |
|
D_out |
Dimensions of graph node features output by GNN part, taken as 32 in developed method. |
|
D_e |
Dimensions of graph edge features. |
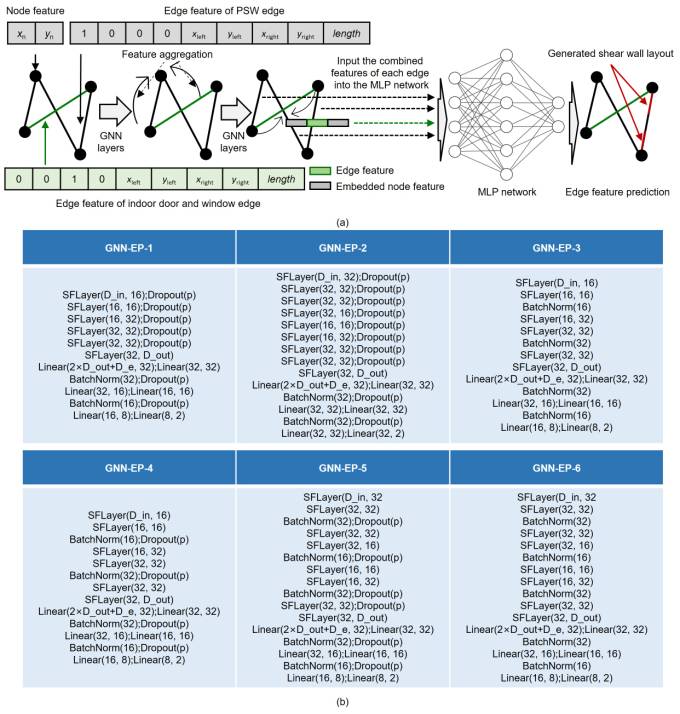
Figure 5 GNN models for graph edge representation methods for shear wall structures. (a) Edge feature prediction schematic. (b) Six GNN models.
As a supplement to the examination of the graph edge representation methods, in the graph node representation methods for shear wall structures, the shear wall layout design is abstracted as a node classification problem in the GNN. Eight GNN models with different hyperparameters are investigated, which are presented in detail in Appendix A.
Cross-validation is a classic method for effectively evaluating the stable performance of a model and is widely used in model evaluation and selection [61, 63]. Ten-fold cross-validation is adopted in this study. The mean and standard deviation of the validation-set evaluation results of the ten-fold cross-validation are adopted as the preliminary performance evaluation indicators of the different graph representation methods and GNN models.
5. Discussion of Graph Representations
5.1. The Evaluation Method for Design Results
The two types of graph representation methods use different graph elements to represent shear walls, and this section compares their performances. The core of the evaluation method is to compare the shear wall layouts designed by the GNN models with the design of engineers, i.e., to calculate their similarity. The design results collected in this study are real-world practical engineering drawings from some design institutes. These design results are the optimized designs of experienced engineers that meet design specifications and comprehensively consider structural performance, design experience, and constructability. Therefore, by comparing an artificial intelligence design with the design of engineers, the comprehensive learning effect of the corresponding intelligent design method on the mechanical performance, design specifications, design experience, and constructability of structures can be best determined. A high similarity implies good GNN-based design results.
To facilitate the comparison, the shear wall components in a shear wall structure represented in graph forms are projected onto an image with a fixed spatial resolution, which is adopted as 10 mm/pixel. As shown in Figure 6(a), for each graph edge representation method, the prediction output of the GNN model is the length ratio of the shear wall at both ends of a PSW. Therefore, the position of a shear wall can be determined based on its length ratio. For each graph node representation method, the prediction output of the GNN model is the classification result of a graph node. Nodes with half the length of the adjacent PSW edges belong to the shear wall class and are considered shear walls. Subsequently, the ground-truth shear wall design results (i.e., the design results of engineers) in the dataset are also projected onto images with the same spatial resolutions. Finally, as shown in Figure 6(b), the intersection over union (IoU) of the shear wall design results generated by the GNN model and the ground-truth shear wall design results in pixel images, i.e., IoUpixel, is calculated, as expressed in Equations (4) and (5).
|
IoUpixel = PNinter / PNunion |
(4) |
|
|
PNunion = PNgt + PNGNN − PNinter |
(5) |
where PNinter is the number of intersection pixels between the shear wall design result generated by the GNN model and the ground-truth shear wall design result; PNunion is the pixel number in the union of the shear wall design result generated by the GNN model and the ground-truth shear wall design result; PNGNN is the total pixel number of the shear wall designed by the GNN model; PNgt is the total pixel number of the ground-truth shear wall design result.
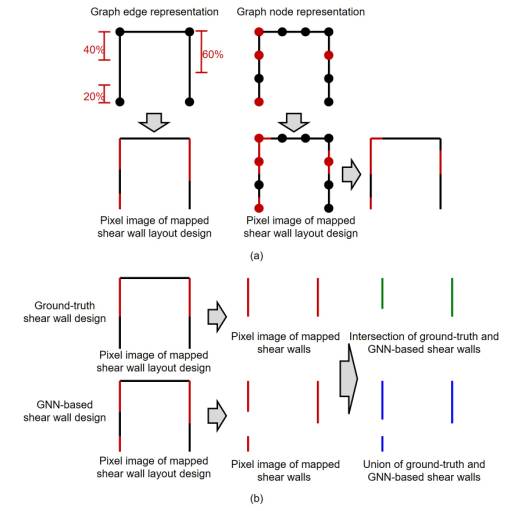
Figure 6 Schematic of the evaluation method of design results. (a) The mapping method of shear wall layout designs on pixel images. (b) IoU of ground-truth and GNN-based shear wall design results.
Ten-fold cross-validation is performed for each model during training. Subsequently, the validation-set average and standard deviation of IoUpixel obtained from the ten-fold training sessions are used as specific evaluation indicators to evaluate the different graph representation methods and GNN models. The closeness of IoUpixel to 1 implies the closeness of the shear wall designed by the GNN-based method to the design by engineers and the high performance of the GNN-based method. In the subsequent discussion, the Group7-H1 design condition group is taken as a representative to compare the performances of the different shear-wall graph representation methods and GNN models.
5.2. Results of Graph Edge Representation Methods
The generation of a shear wall layout scheme using the developed method takes <1 s on a personal computer (i7-9700K CPU, NVIDIA GeForce GTX 1080 Ti GPU), which is efficient. The design results of a structural case using the GNN-EP-4 model are shown in Figure 7 as a representative. It can be seen that the design results based on the graph edge representation methods have good continuity and can well design the topological characteristics of the elevator shaft area.
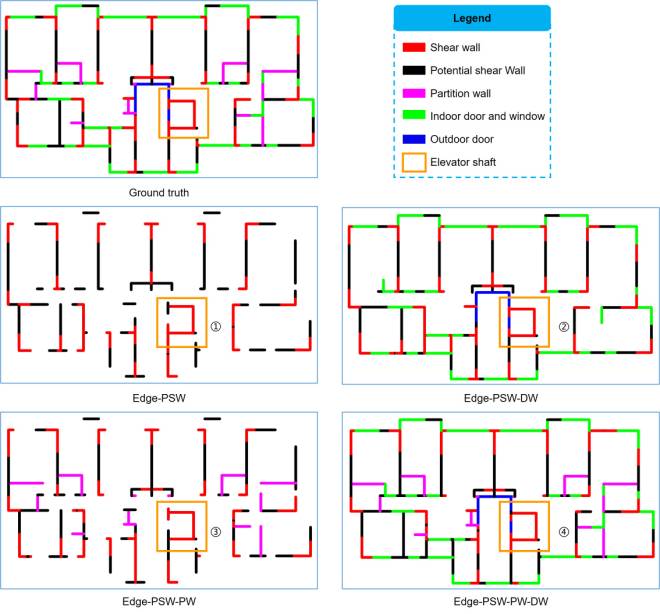
Figure 7 Design results of graph edge representation methods
Table 4 reports the evaluation results of the graph edge representation methods for shear wall structures and the GNN-EP models, i.e., 6 GNN-EP models �� 4 graph representations, leading to a total of 24 results.
(1) GNN-EP-4 performs the best. This is because both batch normalization and dropout methods are adopted in GNN-EP-4. Their simultaneous application effectively avoids the problem of gradient explosion or gradient disappearance, thereby improving the training process stability. Moreover, the GNN layer number of GNN-EP-4 is smaller than those of the other GNN-EP models, which makes it easier to avoid overfitting owing to the limited shear wall samples.
(2) The highest evaluation indicators of the four graph edge representation methods using GNN-EP-4 are relatively similar. Specifically, the evaluation indicator of Edge-PSW-DW is higher than that of Edge-PSW, and the evaluation indicator of Edge-PSW-PW-DW is higher than that of Edge-PSW-PW. Therefore, the graph edge representation methods considering doors and windows are slightly better than those not including doors and windows.
(3) The evaluation indicators of the four graph-edge representation methods with GNN-EP-4 are higher than 0.5. According to the shear wall layout design research of Liao et al. [10] and Zhao et al. [33], a similarity indicator based on IoU metrics greater than 0.5 indicates that the design results are of high quality. Therefore, these graph edge representation methods are suitable for representing shear wall structures.
Table 4 Results of graph edge representation methods
|
Graph representation |
Indicator |
GNN-EP-1 |
GNN-EP-2 |
GNN-EP-3 |
GNN-EP-5 |
GNN-EP-6 |
|
|
Edge-PSW |
Mean |
0.4791 |
0.5004 |
0.4878 |
0.5123 |
0.5015 |
0.4683 |
|
Standard deviation |
0.0822 |
0.0919 |
0.0862 |
0.0901 |
0.0902 |
0.1003 |
|
|
Edge-PSW-DW |
Mean |
0.4412 |
0.5113 |
0.5235 |
0.5296 |
0.5168 |
0.4632 |
|
Standard deviation |
0.1061 |
0.0986 |
0.1284 |
0.1386 |
0.1186 |
0.1438 |
|
|
Edge-PSW-PW |
Mean |
0.4665 |
0.4457 |
0.4916 |
0.5024 |
0.4551 |
0.4985 |
|
Standard deviation |
0.0830 |
0.1240 |
0.1071 |
0.1052 |
0.1243 |
0.1113 |
|
|
Edge-PSW-PW-DW |
Mean |
0.4698 |
0.4407 |
0.5008 |
0.5280 |
0.4494 |
0.4895 |
|
Standard deviation |
0.0950 |
0.1289 |
0.1495 |
0.1215 |
0.1481 |
0.1364 |
5.3. Results of Graph Node Representation Methods
Figure 8 shows the design results for the same case as mentioned in Section 5.2 but obtained using the graph node representation methods, which are presented in detail in Figure A.2. It can be observed from Figures 8 and A.2 that a shear wall is intermittent in the design results. Moreover, the graph node representation methods for shear wall structures show unsatisfactory design performances in the elevator shaft area, suggesting that they cannot effectively capture the topological features of elevator shaft areas.
Table A.1 reports the evaluation results, which in all scenarios of the graph node representation methods are observed to be smaller than 0.5. In contrast, those corresponding to the graph edge representation methods are larger than 0.5. Therefore, the graph node representation methods are less suitable than the graph edge representation methods.
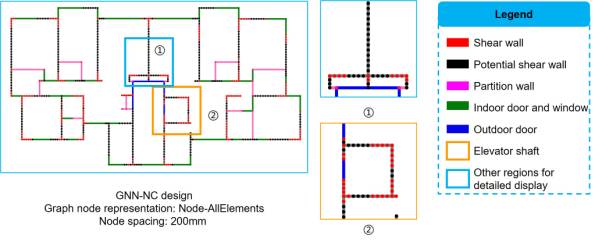
Figure 8 Design results of graph node representation methods
When compared to the graph node representation method, the design results corresponding to the graph edge representation method have better continuity and higher evaluation indicator scores. Furthermore, the graph edge representation method clearly represents the shear wall structure with a smaller graph size (fewer nodes and edges) than the graph node representation method, the topological form is clear, and the graph features can be aggregated more conveniently in the GNN operation. In conclusion, for shear wall structures, graph edge representation methods outperform graph node representation methods. Therefore, in the subsequent analysis and discussion, we focus on the performance of the optimal GNN model for graph edge representation methods, i.e., GNN-EP-4.
6. Case Studies
6.1. Similarity Evaluation
As mentioned in Section 4, Group7-H1, Group7-H2, and Group8 have 10 test sets each. The graph edge presentation methods using the GNN-EP-4 model are evaluated on the three group test sets, and the results are summarized in Table 5. To make full use of the training data, the machine learning models here are retrained, and all the data except the 30 test cases are used as the training set.
Table 5 Test results of Group7-H1, Group7-H2, and Group8
|
Graph representation |
Indicator |
Group7-H1 |
Group7-H2 |
Group8 |
Mean value of three groups |
|
Edge-PSW |
Mean |
0.5711 |
0.6144 |
0.6408 |
0.6088 |
|
Standard deviation |
0.1011 |
0.0744 |
0.0633 |
0.0796 |
|
|
Mean |
0.6065 |
0.6052 |
0.6675 |
0.6264 |
|
|
Standard deviation |
0.1141 |
0.0680 |
0.0838 |
0.0886 |
|
|
Edge-PSW-PW |
Mean |
0.5702 |
0.6056 |
0.6417 |
0.6058 |
|
Standard deviation |
0.0751 |
0.0960 |
0.0777 |
0.0829 |
|
|
Edge-PSW-PW-DW |
Mean |
0.6062 |
0.6129 |
0.6542 |
0.6244 |
|
Standard deviation |
0.1352 |
0.0803 |
0.0800 |
0.0985 |
Overall, the evaluation results of Edge-PSW, Edge-PSW-DW, Edge-PSW-PW, and Edge-PSW-PW-DW are similar, showing that considering PWs, doors, and windows has little effect on the results. From the average performances of the different design condition groups, Edge-PSW-DW exhibits the best performance. In addition, based on the average results of the different design condition groups, Edge-PSW-DW is better than Edge-PSW, and Edge-PSW-PW-DW is better than Edge-PSW-PW; these trends are consistent with the conclusions presented in Section 5.2.
6.2. Comparison with StructGAN Designs
6.2.1 Computational Resource
When the training batch size is 4, a GPU with at least 20 GB of memory is required to train the pixel-image-based StructGAN model [10]. In contrast, only 0.7 GB of GPU memory is required for all GNN models in this study. Therefore, in contrast to the pixel convolution-based deep neural network method, the proposed GNN method significantly reduces computational resources.
6.2.2. Shear Wall Layout Design
Figure 9 shows the differences in the shear wall layouts on pixel images obtained from the typical results designed by the developed GNN-EP-4 model and those designed by the StructGAN model proposed by Liao et al. [10]. One building is designed under a seismic design intensity of 7�� (Group7), and another is designed under that of 8�� (Group8). The results show that the shear wall layout designed using the developed GNN-EP-4 model is comparable to the design of engineers. Moreover, it provides good shear wall layouts in the elevator shaft (zone �� of Group7 and zone �� of Group8 in Figure 9) and balcony (zone �� of Group7 and zones �� and �� of Group8 in Figure 9) areas.
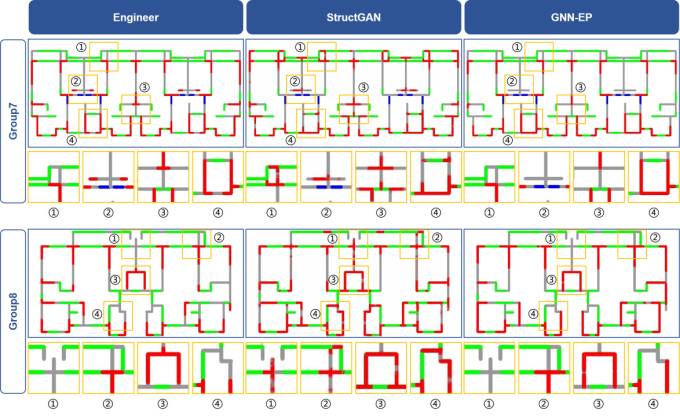
Figure 9 Design results of cases of Group7 and Group8
6.2.3. Mechanical Performance and Material Consumption
Three cases are selected from each of Group7-H1, Group7-H2, and Group8 for a detailed analysis of the mechanical performance and the material consumption. Except for the shear walls, the layout and dimensions of the beams and slabs are designed based on the study by Zhao et al. [33]. The design results of engineers, StructGAN, and the developed GNN-EP-4 model are presented in detail in Appendix B. Figure 10 compares the mechanical performance and material consumption of the StructGAN and GNN-EP model design results with the design of engineers. The GNN-EP model and StructGAN designs have similar torsional period ratio differences. However, in terms of the remaining indicators (i.e., the maximum inter-story drift ratio, first three natural vibration periods, concrete consumption, and steel consumption), the design results of the GNN-EP model are much closer to the design of engineers than those of StructGAN. Thus, the GNN-EP model can better learn the characteristics of the design of engineers from the design drawing dataset than StructGAN, leading to design results that are more similar to those of engineers.
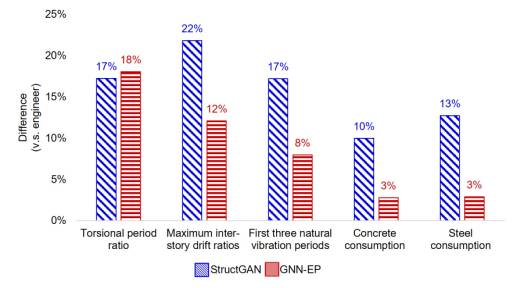
Figure 10 Difference in mechanical prosperities and material consumption of typical cases of Group7-H1, Group7-H2 and Group8 between design results of neural network models and those of engineers.
It should be noted that this research aims to ensure that the artificial intelligence design results are maximally similar to the designs of engineers. This is because the engineering design drawings used in this study are real-world practical engineering design solutions, which are fine in themselves. The future research can include a priori optimized variants of these design results, for instance, using optimization algorithms that can fully consider factors such as structural performance and construction cost.
7. Conclusion
This study develops a GNN-based intelligent design method for shear wall layouts. GNN models are trained using a data-augmented dataset of predefined shear wall structures. Graph representation methods and GNN models for shear wall structures are examined and validated. By inputting the architectural design graph of the shear wall structure to be designed, the well-trained GNN models can generate a shear wall layout design comparable to the design of engineers. The detailed conclusions are as follows.
(1) The established graph edge representation method is better than the graph node representation method for shear wall structures. The edge feature prediction GNN model, GNN-EP-4, is the optimal GNN model, which has the highest score in all graph edge representation scenarios.
(2) The case studies show that the four graph edge representation methods for shear wall structures have similar performances, and the optimal method is Edge-PSW-DW. Therefore, PSWs are necessary for graph representation in a GNN-based shear wall structural design. In practical applications, using Edge-PSW-DW with the edge feature prediction GNN model, GNN-EP-4, is recommended.
(3) The case studies show that the developed GNN-EP model has a mechanical performance and material consumption that are closer to the design results of engineers than those of the StructGAN method based on pixel images.
Declaration of Competing Interest
The authors declare that they have no known competing financial interests or personal relationships that could have appeared to influence the work reported in this paper.
Acknowledgments
Appendices
Appendix A
As a supplementary exploration of the graph edge representation methods, graph node representation methods for shear wall structures are examined. In the latter, a shear wall layout design is abstracted as a node classification problem in the GNN model, as shown in Figure A.1(a). Eight GNN models with different hyperparameters, namely GNN-node classification (GNN-NC), as shown in Figure A.1(b) are studied. Similar to the GNN-EP models, the GNN-NC-1�CGNN-NC-6 models are combinations of a GNN and an MLP network. Models GNN-NC-7 and GNN-NC-8 contain only the GNN.
The definitions of SFLayer(), Linear(), BatchNorm(), Dropout(), p, D_in, and D_out in Figure A.1(b) are the same as those provided in Table 3. N_class is the total number of node classes. For the node-PSW graph representation method, the PSW nodes are finally classified into shear and infill wall classes. Therefore, N_class is 2. For the Node-AllElements graph representation method, the PSW nodes are finally classified into two categories: shear and infill walls, and there are three other node categories in a graph: PWs, outdoor doors, and indoor doors or windows. Therefore, there are a total of 5 node categories, i.e., N_class is 5.
The cross-entropy loss function [64], as expressed in Equation (A.1), is adopted.
|
|
(A.1) |
where M is the class number of nodes; N is the node sample number; yic takes 1 if the true class corresponding to sample i is equal to c; otherwise, yic takes 0; pic is the predicted probability that i-th sample belongs to class c.
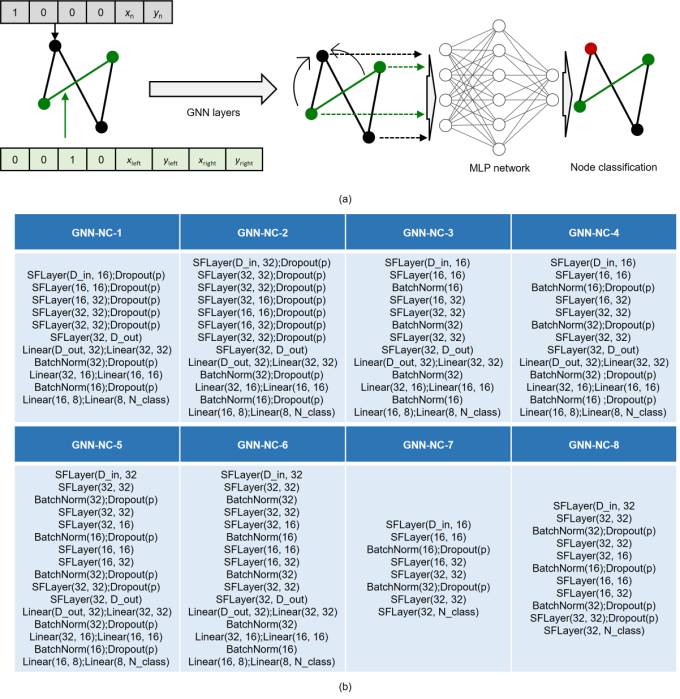
Figure A.1 GNN models for graph node representation methods for shear wall structures. (a) Node classification schematic. (b) Eight GNN models.
Figure A.2 shows the design results of the case described Section 5.2 using the six graph node representation methods.
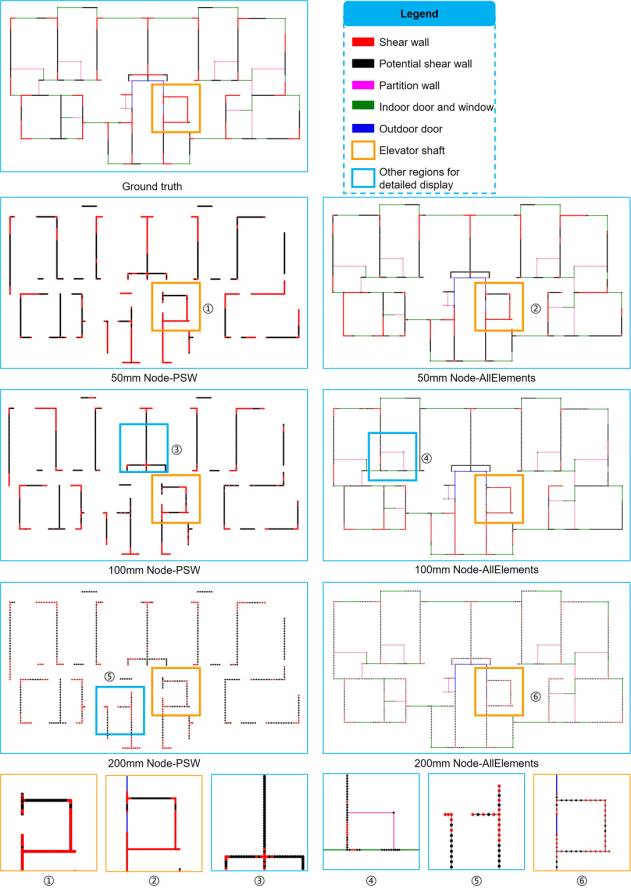
Figure A.2 Design results of graph node representation methods
Table A.1 summarizes the evaluation results of the graph node representation methods for shear wall structures and the GNN-NC models, i.e., results of 8 GNN-NC models �� 3 node spacings �� 2 graph representations, leading to a total of 48 results. The evaluation indicators of all results are smaller than 0.5. Although reducing the node spacing can more precisely represent the location of the shear wall, it will significantly increase the graph complexity and the number of nodes and edges in the graph, which is detrimental to the message passing and feature aggregation of neighbor nodes during GNN operations. Therefore, the node spacing of 50 mm corresponds to the worst performance, as shown in Table A.1.
Table A.1 Results of graph node representation methods
|
Node spacing |
Graph representation |
Indicator |
GNN-NC-1 |
GNN-NC-2 |
GNN-NC-3 |
GNN-NC-4 |
GNN-NC-5 |
GNN-NC-6 |
GNN-NC-7 |
GNN-NC-8 |
|
50mm |
Node-PSW |
Mean |
0.3463 |
0.3560 |
0.3114 |
0.3198 |
0.3264 |
0.3610 |
0.3585 |
0.2028 |
|
Standard deviation |
0.0954 |
0.1181 |
0.0964 |
0.0853 |
0.0714 |
0.0740 |
0.0808 |
0.1007 |
||
|
Node-AllElements |
Mean |
0.3768 |
0.3726 |
0.3161 |
0.3088 |
0.3746 |
0.3246 |
0.4049 |
0.2965 |
|
|
Standard deviation |
0.0822 |
0.0880 |
0.1125 |
0.0846 |
0.0738 |
0.0721 |
0.0749 |
0.1109 |
||
|
100mm |
Node-PSW |
Mean |
0.3857 |
0.4359 |
0.3918 |
0.3526 |
0.4187 |
0.3940 |
0.4045 |
0.2946 |
|
Standard deviation |
0.0939 |
0.0809 |
0.0691 |
0.0722 |
0.0742 |
0.0593 |
0.0774 |
0.1373 |
||
|
Node-AllElements |
Mean |
0.4202 |
0.4329 |
0.3563 |
0.3731 |
0.4221 |
0.4177 |
0.4313 |
0.3180 |
|
|
Standard deviation |
0.0672 |
0.0917 |
0.0761 |
0.1079 |
0.0930 |
0.0796 |
0.0878 |
0.0794 |
||
|
200mm |
Node-PSW |
Mean |
0.4253 |
0.4443 |
0.4033 |
0.4276 |
0.4375 |
0.4332 |
0.4695 |
0.3935 |
|
Standard deviation |
0.1350 |
0.1282 |
0.0725 |
0.0955 |
0.0913 |
0.0748 |
0.0913 |
0.1076 |
||
|
Node-AllElements |
Mean |
0.4866 |
0.4872 |
0.4095 |
0.4576 |
0.4534 |
0.4160 |
0.4657 |
0.4278 |
|
|
Standard deviation |
0.0879 |
0.0902 |
0.0708 |
0.0970 |
0.0848 |
0.0798 |
0.1087 |
0.0817 |
Appendix B
The design results of engineers, StructGAN based on pixel images, and the developed GNN-EP for all nine cases belonging to Group7-H1, Group7-H2, and Group8 are presented in Figures B.1�CB.3, respectively. The layout and dimensions of beams and slabs are designed following Zhao et al. [33].
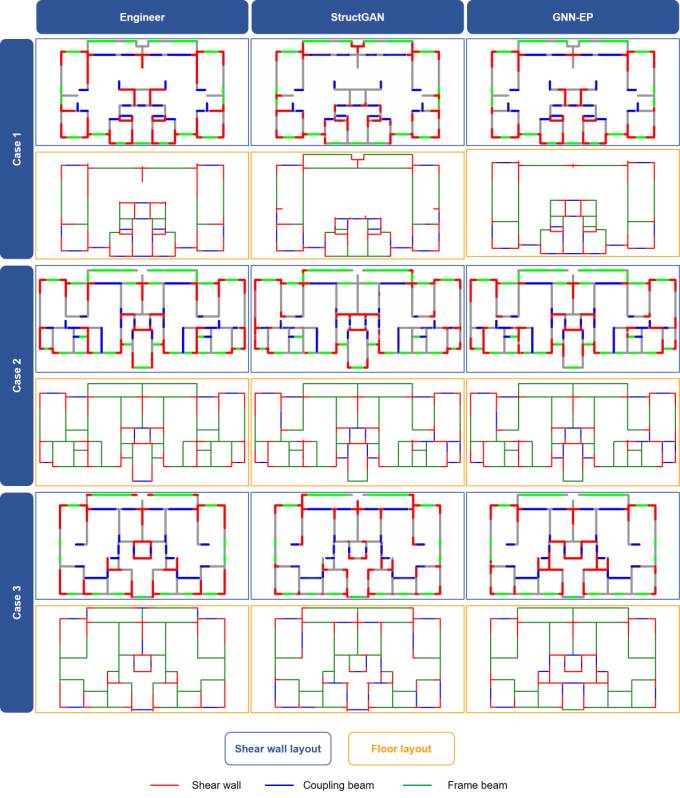
Figure B.1 Design results of engineers, StructGAN, and proposed GNN-EP-4 for Group7-H1
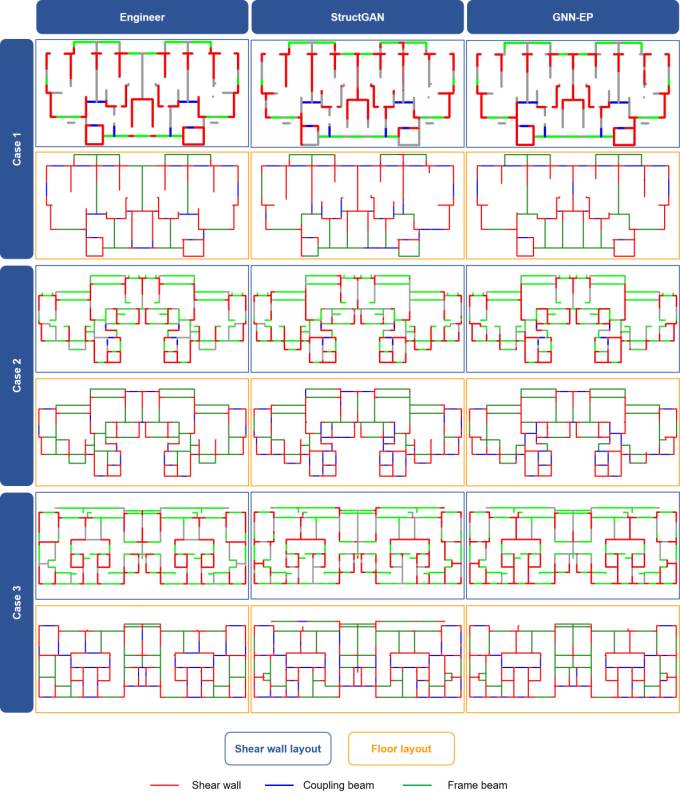
Figure B.2 Design results of engineers, StructGAN, and proposed GNN-EP-4 for Group7-H2
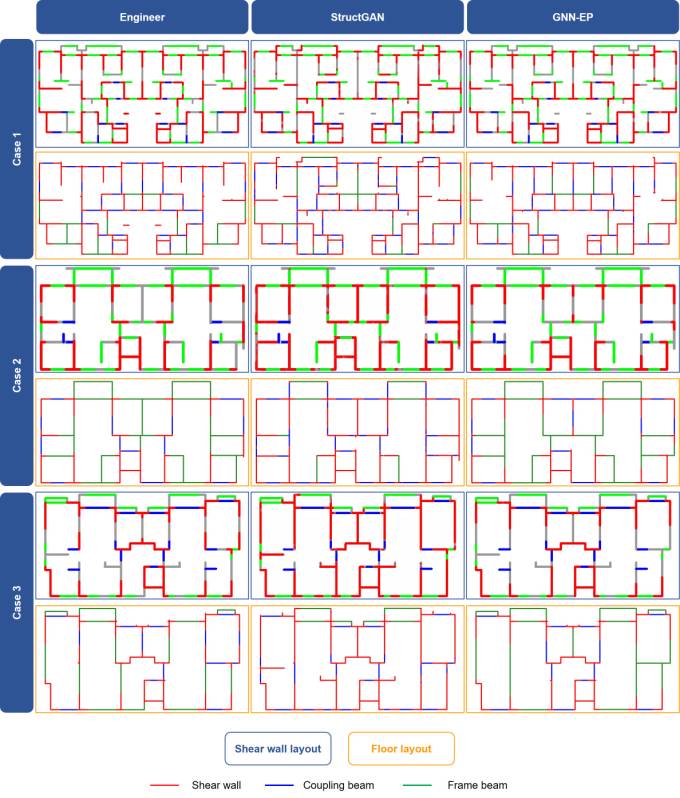
Figure B.3 Design results of engineers, StructGAN, and proposed GNN-EP-4 for Group8
References
[1] CTBUH, Tall buildings in 2019: another record year for supertall completions, CTBUH Research, 2019. https://www.skyscrapercenter.com/research/CTBUH_ResearchReport_2019YearInReview.pdf
[2] R. Perez, A. Carballal, J.R. Rabuñal, M.D. Garc��a-Vidaurr��zaga, O.A. Mures, Using AI to simulate urban vertical growth, CTBUH Journal, Issue III, 2019. https://global.ctbuh.org/resources/papers/download/4212-using-ai-to-simulate-urban-vertical-growth.pdf
[3] J.R. Qian, Z.Z. Zhao, X.D. Ji, L.P. Ye, Design of tall building structures, Third Edition, China Architecture & Building Press, 2018, ISBN: 9787112216840. (in Chinese)
[4] Y. Zhang, C. Mueller, Shear wall layout optimization for conceptual design of tall buildings, Eng. Struct. 140 (2017) 225�C240, https://doi.org/10.1016/j.engstruct.2017.02.059
[5] S. Sotiropoulos, G. Kazakis, N.D. Lagaros, Conceptual design of structural systems based on topology optimization and prefabricated components, Comput. Struct. 226 (2020) 106136, http://doi.org/10.1016/J.COMPSTRUC.2019.106136
[6] X. Zhou, L. Wang, J. Liu, G. Cheng, D. Chen, P. Yu, Automated structural design of shear wall structures based on modified genetic algorithm and prior knowledge, Autom. Constr. 139 (2022) 104318, https://doi.org/10.1016/j.autcon.2022.104318
[7] S. Singaravel, J. Suykens, P. Geyer, Deep convolutional learning for general early design stage prediction models, Adv. Eng. Inform. 42 (2019) 100982, https://doi.org/10.1016/j.aei.2019.100982
[8] P.N. Pizarro, L.M. Massone, F.R. Rojas, R.O. Ruiz, Use of convolutional networks in the conceptual structural design of shear wall buildings layout, Eng. Struct. 239 (2021) 112311, https://doi.org/10.1016/j.engstruct.2021.112311
[9] P.N. Pizarro, L.M. Massone, Structural design of reinforced concrete buildings based on deep neural networks, Eng. Struct. 241 (2021) 112377, https://doi.org/10.1016/j.engstruct.2021.112377
[10] W.J. Liao, X.Z. Lu, Y.L. Huang, Z. Zheng, Y.Q. Lin, Automated structural design of shear wall residential buildings using generative adversarial networks, Autom. Constr. 132 (2021) 103931, https://doi.org/10.1016/j.autcon.2021.103931
[11] X.Z. Lu, W.J. Liao, Y. Zhang, Y.L. Huang, Intelligent structural design of shear wall residence using physics-enhanced generative adversarial networks, Earthq. Eng. Struct. Dyn. 51 (2022) 1657�C1676, https://doi.org/10.1002/eqe.3632
[12] W.J. Liao, Y.L. Huang, Z. Zheng, X.Z. Lu, Intelligent generative structural design method for shear wall building based on ��fused-text-image-to-image�� generative adversarial networks, Expert Syst. Appl. 210 (2022) 118530, https://doi.org/10.1016/j.eswa.2022.118530
[13] W.L. Hamilton, Graph representation learning, synthesis lectures on artificial intelligence and machine learning, 14 (2020) 1�C159, https://doi.org/10.2200/S01045ED1V01Y202009AIM046
[14] Y. Ma, J. Tang, Deep learning on graphs, Cambridge University Press, 2021, https://doi.org/10.1017/9781108924184
[15] M.M. Bronstein, J. Bruna, Y. LeCun, A. Szlam, P. Vandergheynst, Geometric deep learning: going beyond Euclidean data, IEEE Signal Process. Mag. 34 (2017) 18�C42, https://doi.org/10.1109/MSP.2017.2693418
[16] Z. Chen, F. Chen, L. Zhang, T. Ji, K. Fu, L. Zhao, et al., Bridging the gap between spatial and spectral domains: A survey on graph neural networks, 2021, https://doi.org/10.48550/arXiv.2107.10234
[17] Z. Wu, S. Pan, F. Chen, G. Long, C. Zhang, P.S. Yu, A comprehensive survey on graph neural networks, IEEE Trans. Neural Netw. Learn. Syst. 32 (2020) 4�C24, https://doi.org/10.1109/TNNLS.2020.2978386
[18] K.H. Chang, C.Y. Cheng, Learning to simulate and design for structural engineering, In: PMLR 119: Proceedings of the 37th International Conference on Machine Learning, 2020 Jul 13�C18, Online, 2020, pp. 1426�C1436, https://doi.org/10.48550/arXiv.2003.09103
[19] P.J. Zhao, W.J. Liao, Y.L. Huang, X.Z. Lu, Intelligent beam layout design for frame structure based on graph neural networks, J. Build. Eng. 63 (2023) 105499, https://doi.org/10.1016/j.jobe.2022.105499
[20] N. Nauata, K.H. Chang, C.Y. Cheng, G. Mori, Y. Furukawa, House-GAN: Relational generative adversarial networks for graph-constrained house layout generation, In: ECCV 2020: 16th European Conference on Computer Vision, 2020 Aug 23�C28, Glasgow, UK, Cham: Springer, 2020, pp. 162�C177, https://doi.org/10.1007/978-3-030-58452-8_10
[21] N. Nauata, S. Hosseini, K.H. Chang, H. Chu, C.Y. Cheng, Y. Furukawa, House-GAN++: Generative adversarial layout refinement network towards intelligent computational agent for professional architects, In: CVPR 2021: Proceedings of the IEEE/CVF Conference on Computer Vision and Pattern Recognition, 2021 Jun 20�C25, Nashville, TN, USA, IEEE, 2021, pp. 13632�C13641, https://doi.org/10.1109/CVPR46437.2021.01342
[22] C. M��laga-Chuquitaype, Machine learning in structural design: an opinionated review, Front. Built Environ. 8 (2022) 815717, https://doi.org/10.3389/fbuil.2022.815717
[23] M. Breit, L. Huang, F. Lang, F. Ritter, A. Borrmann, Serious play: intuitive architectural conceptual de-sign with immediate structural feedback and economical and ecological performance predictions, In: 12th International Conference on Construction Applications of Virtual Reality, Taipei, 2012. https://publications.cms.bgu.tum.de/2012_Breit_CONVR.pdf
[24] M. Mensinger, M. Breit, L. Huang, Approach to handle architectural flexibility requirements for automated structural design proposals of steel concrete office buildings in early design phases, In: 19th International EG-ICE Workshop, Munich, 2012.
[25] S. Boonstra, K. van der Blom, H. Hofmeyer, M.T.M. Emmerich, Hybridization of an evolutionary algorithm and simulations of co-evolutionary design processes for early-stage building spatial design optimization, Autom. Constr. 124 (2021) 103522, https://doi.org/10.1016/j.autcon.2020.103522
[26] B. Steiner, E. Mousavian, F.M. Saradj, M. Wimmer, P. Musialski, Integrated structural-architectural design for interactive planning, Comput. Graph. Forum 36 (2017) 80�C94, https://doi.org/10.1111/cgf.12996
[27] A.J. Torii, R.H. Lopez, L.F.F. Miguel, Design complexity control in truss optimization, Struct. Multidiscip. Optim. 54 (2016) 289�C299, https://doi.org/10.1007/s00158-016-1403-8
[28] C.M. Herr, R.C. Ford, Cellular automata in architectural design: from generic systems to specific design tools, Autom. Constr. 72 (2016) 39�C45, https://doi.org/10.1016/j.autcon.2016.07.005
[29] M. Aldwaik, H. Adeli, Cost optimization of reinforced concrete flat slabs of arbitrary configuration in irregular high-rise building structures, Struct. Multidiscip. Optim. 54 (2016) 151�C164. http://doi.org/10.1007/s00158-016-1483-5
[30] S. Tafraout, N. Bourahla, Y. Bourahla, A. Mebarki, Automatic structural design of RC wall-slab buildings using a genetic algorithm with application in BIM environment, Autom. Constr. 106 (2019) 102901, https://doi.org/10.1016/j.autcon.2019.102901
[31] H. Lou, B. Gao, F. Jin, Y. Wan, Y. Wang, Shear wall layout optimization strategy for high-rise buildings based on conceptual design and data-driven tabu search, Comput. Struct. 250 (2021) 106546, https://doi.org/10.1016/j.compstruc.2021.106546
[32] J. Liu, S. Li, C. Xu, Z. Wu, N. Ao, F. Chen, Automatic and optimal rebar layout in reinforced concrete structure by decomposed optimization algorithms, Autom. Constr. 126 (2021) 103655, https://doi.org/10.1016/j.autcon.2021.103655
[33] P.J. Zhao, W.J. Liao, H.J. Xue, X.Z. Lu, Intelligent design method for beam and slab of shear wall structure based on deep learning, J. Build. Eng. 57 (2022) 104838, https://doi.org/10.1016/j.jobe.2022.104838
[34] Y.F. Fei, W.J. Liao, S. Zhang, P.F. Yin, B. Han, P.J. Zhao, X.Y. Chen, X.Z. Lu, Integrated schematic design method for shear wall structures: a practical application of generative adversarial networks, Buildings 12 (2022) 1295, https://doi.org/10.3390/buildings12091295
[35] P.J. Zhao, W.J. Liao, Y.L. Huang, X.Z. Lu, Intelligent design of shear wall layout based on attention-enhanced generative adversarial network, Eng. Struct. 274 (2023) 115170, https://doi.org/10.1016/j.engstruct.2022.115170
[36] T.C. Wang, M.Y. Liu, J.Y. Zhu, A. Tao, J. Kautz, B. Catanzaro, High-resolution image synthesis and semantic manipulation with conditional GANs, IEEE Conf. Comp. Vis. Pattern Recognit. (2018) 8798�C8807, https://doi.org/10.1109/CVPR.2018.00917
[37] K.H. Chang, C.Y. Cheng, J. Luo, S. Murata, M. Nourbakhsh, Y. Tsuji, Building-GAN: graph-conditioned architectural volumetric design generation, In: Proceedings of the IEEE/CVF International Conference on Computer Vision (ICCV), 2021 Oct 11�C17, Online, 2021, pp. 11956�C11965, https://doi.org/10.48550/arXiv.2104.13316
[38] Z. Wang, R. Sacks, T. Yeung, Exploring graph neural networks for semantic enrichment: Room type classification, Autom. Constr. 134 (2022) 104039, https://doi.org/10.1016/j.autcon.2021.104039
[39] D.P.H. Claessens, S. Boonstra, H. Hofmeyer, Spatial zoning for better structural topology design and performance, Adv. Eng. Inform. 46 (2020) 101162, https://doi.org/10.1016/j.aei.2020.101162
[40] T. Ma, Grpah neural networks: Fundamentals and frontiers, Beijing: Publishing House of Electronics Industry, 2021, ISBN: 9787121405020. (in Chinese)
[41] L. Wu, P. Cui, J. Pei, L. Zhao, Graph neural networks: Foundations, frontiers, and applications, Singapore: Springer, 2022, https://doi.org/10.1007/978-981-16-6054-2
[42] A. Ali, C. Gary, P. Zhang, Irregularity in graphs, New York: Springer, 2021, https://doi.org/10.1007/978-3-030-67993-4
[43] J. Bruna, W. Zaremba, A. Szlam, Y. LeCun, Spectral networks and deep locally connected networks on graphs, 2nd International Conference on Learning Representations, ICLR 2014, 2014, https://doi.org/10.48550/arXiv.1312.6203
[44] M. Defferrard, X. Bresson, P. Vandergheynst, Convolutional neural networks on graphs with fast localized spectral filtering, In: NIPS 2016: Proceedings of the 30th Conference on Neural Information Processing Systems, 2016 Dec 5�C10, Barcelona, Spain, 2016: pp. 3844�C3852, https://doi.org/10.48550/arXiv.1606.09375
[45] T.N. Kipf, M. Welling, Semi-supervised classification with graph convolutional networks, In: ICLR 2017: International Conference on Learning Representations, 2017 Apr 24�C26, Toulon, France, 2017, https://doi.org/10.48550/arXiv.1609.02907
[46] J. Gilmer, S.S. Schoenholz, P.F. Riley, O. Vinyals, G.E. Dahl, Neural message passing for quantum chemistry, In Proceedings of the 34th International Conference on Machine Learning, Sydney, Australia, PMLR 70, 2017: pp. 1263�C1272, https://dl.acm.org/doi/pdf/10.5555/3305381.3305512
[47] P.W. Battaglia, J.B. Hamrick, V. Bapst, A. Sanchez-Gonzalez, V. Zambaldi, et al., Relational inductive biases, deep learning, and graph networks, 2018, https://doi.org/10.48550/arXiv.1806.01261
[48] W.L. Hamilton, R. Ying, J. Leskovec, Inductive representation learning on large graphs, In: NIPS 2017: Proceedings of the 31st Conference on Neural Information Processing Systems, 2017 Dec 4�C9, Long Beach, CA, USA, 2017, pp. 1024�C1034, https://doi.org/10.48550/arXiv.1706.02216
[49] P. Veličković, G. Cucurull, A. Casanova, A. Romero, P. Li��, Y. Bengio, Graph attention networks. In: ICLR 2018: International Conference on Learning Representations, 2018 Apr 30�CMay 3, Vancouver, Canada, 2018, https://doi.org/10.48550/arXiv.1710.10903
[50] M. Schlichtkrull, T.N. Kipf, P. Bloem, R. van den Berg, I. Titov, M. Welling, Modeling relational data with graph convolutional networks, European semantic web conference, Cham: Springer, 2018: 593-607, https://doi.org/10.1007/978-3-319-93417-4_38
[51] J. Chen, T. Ma, C. Xiao, FastGCN: fast learning with graph convolutional networks via importance sampling, 6th International Conference on Learning Representations, 2018, https://doi.org/10.48550/arXiv.1801.10247
[52] H. Zeng, H. Zhou, A. Srivastava, R. Kannan, V. Prasanna, GraphSAINT: Graph sampling based inductive learning method, International Conference on Learning Representations, 2020, https://doi.org/10.48550/arXiv.1907.04931
[53] A. Feeney, R. Gupta, V. Thost, R. Angell, G. Chandu, Y. Adhikari, T. Ma, Relation-dependent sampling for multi-relational link prediction, Graph Representation Learning and Beyond (GRL+) Workshop at ICML 2020, https://grlplus.github.io/papers/74.pdf
[54] Z. Liu, J. Zhou, Introduction to graph neural networks, Cham: Springer, 2020, https://doi.org/10.1007/978-3-031-01587-8
[55] L. Waikhom, R. Patgiri, Graph neural networks: methods, applications, and opportunities, 2021, https://doi.org/10.48550/arXiv.2108.10733
[56] X. Jiang, L. Liu, C. Shan, Y. Shen, X. Dong, D. Li, Recognizing vector graphics without rasterization, In: NeurIPS 2021: 35th Conference on Neural Information Processing Systems, 2021 Dec 6�C14, Online, https://doi.org/10.48550/arXiv.2111.03281
[57] G. Ślusarczyk, Visual language and graph-based structures in conceptual design, Adv. Eng. Inform. 26 (2012) 267�C279, https://doi.org/10.1016/j.aei.2011.10.005
[58] C. Langenhan, M. Weber, M. Liwicki, F. Petzold, A. Dengel, Graph-based retrieval of building information models for supporting the early design stages, Adv. Eng. Inform. 27 (2013), 413�C426, https://doi.org/10.1016/j.aei.2013.04.005
[59] K. Hayashi, M. Ohsaki, Graph-based reinforcement learning for discrete cross-section optimization of planar steel frames, Adv. Eng. Inform. 51 (2022) 101512, https://doi.org/10.1016/j.aei.2021.101512
[60] P. Hawkins, F. Maire, S. Denman, M. Baktashmotlagh, Modular construction planning using graph neural network heuristic search, Australasian Joint Conference on Artificial Intelligence, Springer, Cham, 2022: 228-239, https://doi.org/10.1007/978-3-030-97546-3_19
[61] S.J. Russell, P. Norvig, Artificial intelligence: a modern approach, Fourth Edition, Hoboken: Pearson, 2021, http://aima.cs.berkeley.edu/
[62] T. Chai, R.R. Draxler, Root mean square error (RMSE) or mean absolute error (MAE), Geoscientific Model Development Discussions 7 (2014) 1525-1534, https://doi.org/10.5194/gmdd-7-1525-2014
[63] D. Berrar, Cross-validation, Encyl. Bioinf. Comput. Biol. 1 (2019) 542-545. https://doi.org/10.1016/B978-0-12-809633-8.20349-X
[64] C. Szegedy, V. Vanhoucke, S. Ioffe, J. Shlens, Rethinking the inception architecture for computer vision, IEEE Conf. Comp. Vis. Pattern Recognit., 2016: 2818-2826, https://doi.org/10.1109/CVPR.2016.308