Abstract
The construction industry, traditionally labor-intensive, has now been evolving towards automation and the incorporation of intelligence. Notably, the shear wall layout has been a critical component in structural construction, where neural networks have promoted the emergence of sophisticated design methods. These methods integrate graph neural networks (GNNs), successfully mitigating the computational resource demands and challenges in capturing the topological features, which are the impediments in pixel image-based methods. However, the existing GNN-based methods marginally accommodate structural design conditions and underperform in fulfilling practical engineering requirements. Specifically, these methods overlook influential factors such as the peak ground acceleration (PGA) of the design basis earthquake (DBE), characteristic ground period, and building height, all of which are crucial to the shear wall layout design. To address this research gap, this study proposes an innovative GNN-based design method that duly incorporates design conditionsˇŞincluding the PGA of the DBE, characteristic ground period, and building heightˇŞand rigorously evaluates its advantages over previous approaches. The findings confirm the efficiency and reliability of the proposed design-condition-informed method and highlight its capability to accurately correlate shear wall layouts with design conditions.
Keywords
graph neural network; design conditions; shear wall structure; intelligent shear wall layout design; deep learning
1. Introduction
Reinforced concrete shear wall structures represent a prominent high-rise category requiring diligent architectural and structural design considerations [1-3]. In the design process, the preliminary layout of the structure holds paramount significance [2-5], but its conventional design methods are time-consuming and heavily reliant on the expertise of engineers. In response to these challenges, automated and intelligent design methods have emerged [3, 6-9].
Intelligent design methods based on pixel images for shear wall structural layout [2, 10-14] face significant challenges in accurately representing complex structural forms [3]. Their reliance on high-resolution images leads to sparse critical component features, excessive model parameters, and substantial computing resource demand [3]. In addition, the pixel representation of different architectural and structural elements inadequately encapsulates their topological relationships. This inadequacy obstructs seamless integration with subsequent processes, such as modeling and analysis, often necessitating the development of compensational post-processing algorithms [3, 14-15].
Graph data, including graph nodes and edges, has the natural topological form and the potential to deal with structural problems [16-20]. Unlike the intelligent design methods that rely on pixel images, the graph neural network (GNN) approach utilizes graph data representing the topological features of elements [17, 21] and offers novel solutions for intelligent structural layout design [3, 22-24]. Zhao et al. [3] pioneered the representation of shear wall layouts based on the GNNs. Their results have demonstrated that the GNN-based methods outperform the pixel image-based ones in considering the topological characteristics of building components and the continuity of shear wall layouts. Despite the significant advantages of the GNN-based design method by Zhao et al. [3], certain limitations persist. The current GNN-based design method adopts coarse grouping, dividing the data into categories based on the seismic design intensity and building height for separate training. Consequently, it is challenging to fully account for the correlation between the shear wall layout and seismic design conditions. Crucial design conditions, such as the corresponding peak ground acceleration (PGA) of the design basis earthquake (DBE) with a 10% probability of exceedance in 50 years [25], characteristic ground period, and specific building height, are not adequately considered, resulting in difficulties meeting the design requirements of practical engineering.
Liao et al. [13] inspired embedding design conditions into the intelligent structural layout design. However, the research of Liao et al. [13] has several shortcomings: (1) it relies on pixel images, leading to an abundance of model parameters and the inability to consider the topological relationships between the building components [3]. (2) it only considered two types of seismic design intensities in the form of text (ˇ°sevenˇ± and ˇ°eight,ˇ± indicating that the corresponding PGAs of the DBE are 100 cm/s2 and 200 cm/s2, respectively) and grouping of three building heights (ˇ°H1,ˇ± ˇ°H2,ˇ± and ˇ°H1H2,ˇ± representing heights < 50 m, 50¨C150 m, and 0¨C150 m, respectively). The design conditions in discrete groups have significant limitations and cannot fully capture all practical design requirements. For example, a PGA of the DBE of 50 cm/s2 was beyond the scope of Liao et al. [13]ˇŻs research. In addition, the design of shear walls could not be accurately guided by a specific height because only rough height groupings were considered. (3) Liao et al. [13] overlooked the characteristic ground period; however, the characteristic ground period frequently collaborates with the PGA of the DBE and natural vibration period of the structure to guide the structural design [26]. To address these deficiencies, this study proposes a design-condition-guided method for shear wall layouts based on the GNNs. By leveraging the powerful topological feature processing capabilities of the GNNs and refining the consideration of three essential design conditions (i.e., the PGA of the DBE, characteristic ground period, and specific building height), this study aims to overcome the abovementioned limitations.
This study proposes a GNN-based design method for shear wall layouts that considers the design conditions. In Section 2, the proposed design method is introduced. Section 3 presents the GNN model and feature representations of the three crucial design conditions: the PGA of the DBE, characteristic ground period, and specific building height. Section 4 explores the effects of various combinations of design conditions. Section 5 presents the design effects of the proposed method using case studies.
2. Design Method
The proposed method for shear wall layout design, which incorporates design conditions using the GNN, consists of three parts: graph data preparation, GNN model training, and GNN-based design, as shown in Figure 1.
Zhao et al. [3] explored using graph data to represent the shear wall structure without considering the design conditions. Based on Zhao et al. [3]ˇŻs findings, this study introduces a novel approach that embeds the essential design conditions, namely, the PGA of the DBE, characteristic ground period, and building height, into the graph data.
First, the structural and nonstructural components, such as walls, doors, and windows, need to be represented in graph form. The graph edges are used to represent structural and nonstructural components, and the graph nodes are used to represent the connections between components. See Section 3.1 for details. It should be noted that the graph data of the shear wall structure can be obtained from the AutoCAD drawing, and it takes approximately 5 minutes. Specifically, the coordinates of structural and nonstructural components can be obtained from the AutoCAD drawings using the GANIO plug-in for AutoCAD [15]. Afterward, the graph node features and the graph edge features of the shear-wall-structure graph data need to be defined. The graph node features mainly include the location features of nodes, and the graph edge features include the location features of nodes at both ends, the length features of graph edges, and the category features of graph edges. See Section 3.1 for the detailed definition method. The three design conditions (the PGA of the DBE, characteristic ground period, and building height) that this research focuses on are also embedded in the features of graph nodes and edges. See Section 3.2 for details. Finally, all the data are divided into training and test sets for neural network training and testing. See Section 3.3 for details.
(2) GNN model training
This study proposes a design-condition-embedded graph representation method for the shear wall structure and trains the GNN models based on the prepared shear wall structure graph data. The primary objective of this study is to obtain a GNN model capable of designing shear wall layouts based on specific design conditions. The performance of these design-condition-informed GNN models is also thoroughly discussed. The core architecture of the GNN model used in this study is the GNN-EP-4 model proposed by Zhao et al. [3]. The model architecture, the data augmentation method adopted in the model training process, and the loss function are detailed in Section 3.3.
(3) GNN-based design
Based on a well-trained GNN model, this study can realize a shear wall layout design under various design conditions for the shear wall structures. When applying the well-trained GNN model for shear wall layout design, first, the shear wall structure to be designed and its corresponding design conditions need to be represented as graph data. After that, the graph data of the shear wall structure to be designed is input into the well-trained GNN model, and the design result of the shear wall layout can be obtained. The case studies are shown in Section 5.
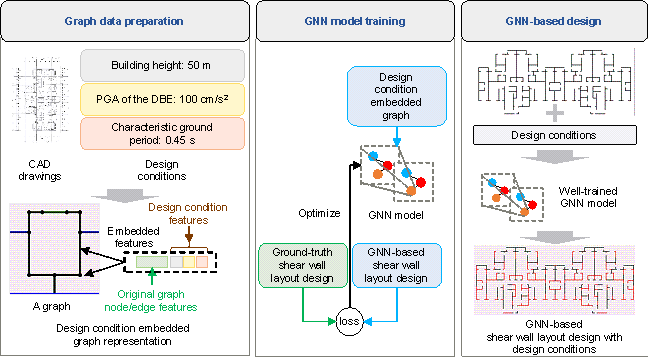
Figure 1 GNN-based shear wall layout design method embedded with design conditions.
3. Feature Representations of Design Conditions and GNN Models
3.1. Graph Representations for Shear Wall Structures
Zhao et al. [3] identified the graph edge representation method as an appropriate approach for representing the shear wall structures; thus, this study adopts the same method. In the graph edge representation method, graph edges represent structural and nonstructural components, such as the walls, doors, and windows in the shear wall structure, whereas graph nodes depict the connection relationships between these components. Following Zhao et al. [3], this study considers two types of walls.
(a) Partition walls (PWs): These walls serve solely for space separation and cannot be arranged as shear walls because of the building function or wall thickness.
(b) Potential shear walls (PSWs): These can be arranged as shear walls. Generally, all walls in a building other than PWs can be considered as PSWs. Architects can also utilize their expertise to identify PSWs.
This study adopted the graph edge representation method, which is consistent with that of Zhao et al. [3]. Four graph representations are considered, as shown in Figure 2.
Graph-PSW: Only PSWs in shear wall structures are considered.
Graph-PSW-DW: PSWs, doors, and windows in shear wall structures are considered.
Graph-PSW-PW: PSWs and PWs in shear wall structures are considered.
Graph-PSW-PW-DW: PSWs, PWs, doors, and windows in shear wall structures are considered.
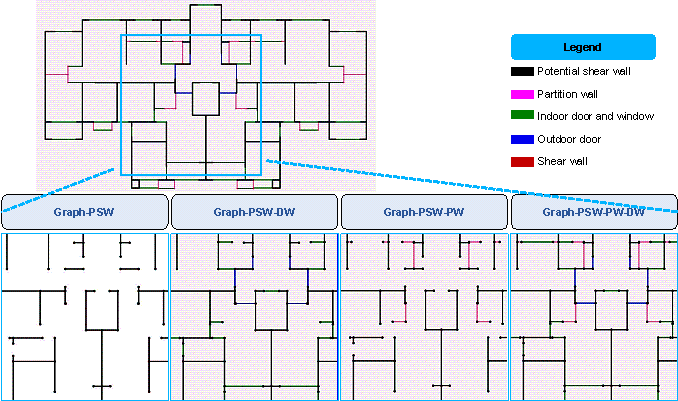
Figure 2 Graph representations for shear wall structures [3].
Similar to the study by Zhao et al. [3], in this study, the shear wall is represented by the ratio of the length of the shear wall at both ends of the PSW to the total length, as shown in Figure 3a. It should be noted that when the shear walls cover the entire PSW wall pier, this study uses ˇ°100 %ˇ± to represent the ratio of the length of the shear wall at both ends of the PSW to the total length instead of the ˇ°50 %ˇ± used by Zhao et al. [3]. This adjustment to ˇ°100 %ˇ± is intended to better address the interruption of the shear wall layout caused by the minor prediction errors, as illustrated in Figure 3b.
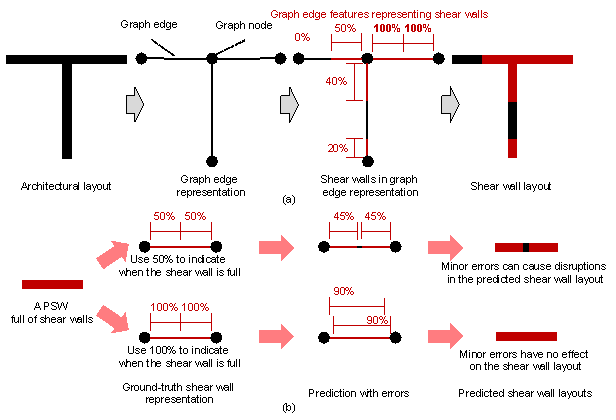
Figure 3 Shear wall representation:
(a) shear walls in graph edge representation methods, and (b) shear wall layout
when there are minor prediction errors.
In the graph representation method used in this study, the basic features of the graph edges and graph nodes are consistent with those in the research of Zhao et al. [3], as shown in Table 1, which is consistent with the data presented in Table 1 by Zhao et al. [3]. Moreover, all the coordinate and length values are normalized following the method presented in Equation (1) by Zhao et al. [3]:
Table 1 Node and edge features in graph representation methods [3]
|
Graph edge representation methods |
Node features |
Edge features |
|
Graph-PSW |
Node |
Edge of PSW |
|
[xn, yn] |
[xleft, yleft, xright, yright, length] |
|
|
Graph-PSW-DW |
Edge of PSW |
|
|
[1, 0, 0, xleft, yleft, xright, yright, length] |
||
|
Node |
Edge of indoor door and window |
|
|
[xn, yn] |
[0, 1, 0, xleft, yleft, xright, yright, length] |
|
|
Edge of outdoor door |
||
|
[0, 0, 1, xleft, yleft, xright, yright, length] |
||
|
Graph-PSW-PW |
Edge of PSW |
|
|
Node |
[1, 0, xleft, yleft, xright, yright, length] |
|
|
[xn, yn] |
Edge of PW |
|
|
[0, 1, xleft, yleft, xright, yright, length] |
||
|
Graph-PSW-PW-DW |
Edge of PSW |
|
|
[1, 0, 0, 0, xleft, yleft, xright, yright, length] |
||
|
Edge of PW |
||
|
Node |
[0, 1, 0, 0, xleft, yleft, xright, yright, length] |
|
|
[xn, yn] |
Edge of indoor door and window |
|
|
[0, 0, 1, 0, xleft, yleft, xright, yright, length] |
||
|
Edge of outdoor door |
||
|
[0, 0, 0, 1, xleft, yleft, xright, yright, length] |
Note: xn and yn represent the coordinates of a node; xleft and yleft denote the coordinates of one end of an edge; xright and yright denote the coordinates of the other end of the edge; length represents the edge length [3].
3.2. Feature Representations for Design Conditions
The PGA of the DBE, characteristic ground period, and building height are the three essential parameters affecting the structural design results in the Chinese code for seismic design of buildings [26]. Figure 4 presents an illustrative representation of the seismic design response spectrum in the Chinese code for seismic design of buildings [26]. In Figure 4, ¦Á represents the spectral acceleration; ¦Ámax denotes the maximum value of the spectral acceleration; Tg represents the characteristic ground period; and T represents the natural vibration period of the structure.
This study considers the Chinese code for seismic design of buildings [26] and insights by experienced engineers, emphasizing the significance of the three essential parameters (i.e., the PGA of the DBE, characteristic ground period, and building height) in structural seismic design. The shear wall is the main component that resists lateral force in the shear wall structure and is critical in the seismic design. Therefore, in the design of shear wall structures, the seismic requirement significantly influences the shear wall layouts. The seismic design response spectrum and the structural properties are the critical bases for the seismic design of the shear wall structure. The three design conditions (i.e., the PGA of the DBE, characteristic ground period, and building height) that this study focuses on are highly related to the seismic design response spectrum and the structural properties.
First, the PGA of the DBE directly affects the maximum value of the spectral acceleration ¦Ámax during the structural design. Second, the characteristic ground period, Tg, significantly affects the shape of the seismic design response spectrum during the structural design. Finally, the building height plays a crucial role in determining the natural vibration period T of the structure. These parameters are essential in structural seismic design because they form the foundation for establishing the natural vibration period of a structure and the seismic design response spectrum. The coupling of the three design conditions will directly determine the seismic lateral force suffered by the shear wall structure during the aseismic design, thus affecting the design result. Generally, the greater the seismic lateral force suffered by the shear wall structure in the seismic design, the more shear walls tend to be arranged in the structure so that the shear wall structure can meet design code requirements in the seismic response.
To consider their influence on the shear wall layout design, this study incorporates the PGA of the DBE, characteristic ground period, and building height into the node and edge features of the graph representation for shear wall structures.
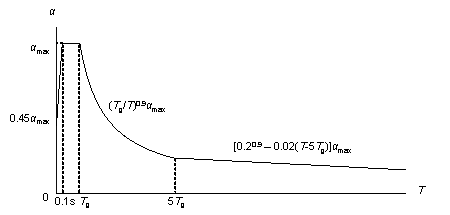
Figure 4 Seismic design response spectrum in Chinese code for seismic design of buildings at a damping ratio of 0.05 [26].
The PGA of the DBE is related to the seismic intensity. The shear wall structure data collected in this study include seismic intensities of 6ˇă, 7ˇă, 7.5ˇă, and 8ˇă, with corresponding PGAs of the DBE 50, 100, 150, and 200 cm/s2, respectively. Therefore, in this study, the PGA of the DBE is normalized by 200 cm/s2, as shown in Equation (1).
|
an = a / amax |
(1) |
where a represents the PGA of the DBE, an represents the normalized PGA of the DBE, and amax represents the reference value for normalization, which is taken as 200 cm/s2.
According to the Chinese code for seismic design of buildings [26], the characteristic ground period is related to the site category, magnitude, and epicentral distance of the design earthquake. The characteristic ground period of the data collected in this study includes six periods of 0.30, 0.35, 0.40, 0.45, 0.55, and 0.65 s. According to engineersˇŻ experience, most of the characteristic ground period faced by the shear wall residences, which are the focus of this study, is less than 0.65 s. Therefore, the characteristic ground period is normalized by 0.65 s in this study, as shown in Equation (2).
|
Tn = Tg / Tmax |
(2) |
where Tg represents the characteristic ground period, Tn represents the normalized characteristic ground period, and Tmax represents the reference value for normalization, which is taken as 0.65 s.
In the shear wall structure data collected in this study, all the building heights are less than 100 m. Therefore, the building height is normalized by 100 m, as shown in Equation (3).
|
Hn = H / Hmax |
(3) |
where H represents the building height, Hn represents the normalized building height, and Hmax represents the reference value for normalization, which is taken as 100 m.
The design conditions are considered by embedding the normalized an, Tn and Hn into the node and edge features, as listed in Table 1. Considering the graph representation Graph-PSW-PW-DW in Table 1 as an example, the original node and edge features are [xn, yn] and [1, 0, 0, 0, xleft, yleft, xright, yright, length], respectively, and the node and edge features after embedding the design conditions are [xn, yn, an, Tn, Hn] and [1, 0, 0, 0, xleft, yleft, xright, yright, length, an, Tn, Hn], respectively.
This study discusses the following four design condition combination scenarios. Notably, the training processes of these four scenarios are identical, with their distinctions arising from the extent, to which they considered the design conditions.
GNN-DC-0: Design conditions are not considered.
GNN-DC-1: Only the design condition of structure height is considered.
GNN-DC-2: Two design conditions of the structural height and PGA of the DBE are considered.
GNN-DC-3: All three design conditions (the PGA of the DBE, characteristic ground period, and building height) are considered.
3.3. GNN Model and Dataset
Zhao et al. [3] thoroughly examined various GNN model architectures suitable for the graph edge representation method and ultimately identified the GNN-EP-4 model as the top-performing option. Therefore, the GNN-EP-4 model proposed by Zhao et al. [3] is used as the fundamental neural network architecture, as shown in Figure 5. The meanings of the parameters within the neural network architecture shown in Figure 5 align with those outlined in Table 3 by Zhao et al. [3].
Furthermore, the arrangement of the shear walls in the structure is independent of the angle and position of the structure in the drawing. Therefore, a data augmentation method consistent with the research by Zhao et al. [3], which considers the rigid-body translation, flipping, and rotation of the shear wall structure, was adopted in this study. Specifically, the upside-down flipping (two cases), counterclockwise rotation with a modulus of 90ˇă (four cases), up or down translation with a modulus of 2 m and a range of 0¨C20 m (21 cases), and left or right translation with a modulus of 2 m and a range of 0¨C20 m (21 cases) are included in the data augmentation method, which is theoretically equivalent to expanding the data amount by 3528 times (2 ˇÁ 4 ˇÁ 21 ˇÁ 21 = 3528) [3]. The data augmentation method is embedded in the training process of the neural network. During each iteration of the neural-network training process, each data is randomly subjected to the above four transformations to achieve data augmentation.
The engineering goal of this study is to design shear wall layouts, which is consistent with that of the research by Zhao et al. [3]. Therefore, the L1 loss function (mean absolute error) [27] from Equation (3) by Zhao et al. [3] is adopted as the loss function for the neural network in this study. Appendix A compares the effects of three commonly used loss functions, and also shows that the L1 loss function is optimal.
The datasets of shear wall structures used in this study are collected from several well-known architectural design institutes in China, and all the designs are executed by experienced engineers. For this study, we employ the dataset from the study by Zhao et al. [3] as the foundation, supplemented with new additions. This study divides 338 shear wall structure data into a test set (comprising 50 data) and a training set (comprising 288 data). Among the test set, 30 data are identical to the 30 data in the test set by Zhao et al. [3], which belong to three different design groups. Retaining the same data in the test set allows for a convenient comparison between the shear wall layout design results obtained using the method proposed in this study and those derived from the method proposed by Zhao et al. [3].
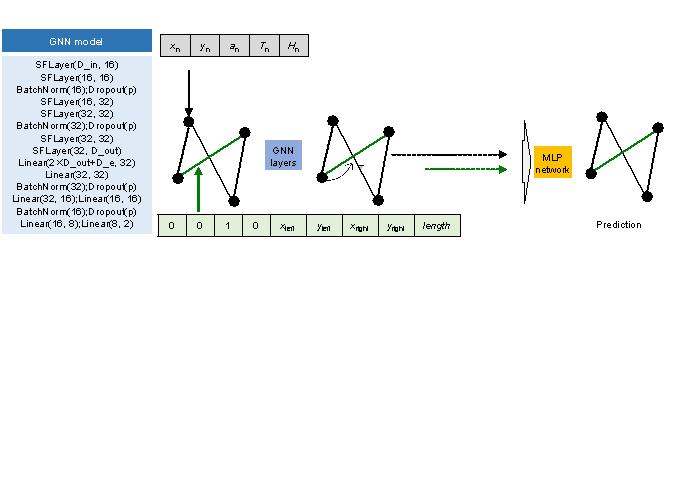
Figure 5 GNN model [3]:
(a) Architecture and schematic of the GNN model and (b) Definitions of parameters
in the GNN model.
4. Discussion
4.1. Evaluation Method
Liao et al. [2], Zhao et al. [3, 14, 28], and Fei et al. [15] showed that an intersection over union (IoU)-based indicator can better judge the similarity between the shear wall layout designed using the deep learning method and that designed by engineers. However, when it is necessary to comprehensively evaluate the influence of different PGAs of the DBE, characteristic ground periods, and building heights on the mechanical and economic characteristics of the shear wall design results, it is not sufficient to consider only the similarity based on the IoU. The IoU metric focuses on the similarity of the spatial distribution of the engineer-designed and neural-network-designed shear wall layouts. The shear wall ratio (i.e., the ratio of shear walls to total walls) is a critical indicator that reflects the mechanical and economic characteristics of the shear wall design results. Liao et al. [13] showed that the similarity evaluation index of shear wall layout considering the shear wall ratio can better evaluate the comprehensive performance of the structure and reflect the impact of different design conditions on the shear wall layout. Therefore, this study proposes a comprehensive evaluation index ScoreDC that considers the similarity of the spatial distribution of the shear wall layout and the similarity of the shear wall ratio, as shown in Equations (4)¨C(12).
The schematic diagram of ScoreDC is shown in Figure 6. The evaluation index ScoreDC used in this study is a comprehensive evaluation of the similarity of the shear wall layout and the similarity of the shear wall ratio. For the design results of the shear wall layout, the similarity of the shear wall layout and the similarity of the shear wall ratio are both important, so an index that combines the two similarities is necessary. ScoreDC is composed of two parts: the shear wall layout similarity index IoUSW and the weight coefficients of the shear wall ratio w1 and w2. IoUSW is the similarity of shear wall layout based on IoU (intersection over union). According to previous research [2, 3,14-15, 28], the IoU metric can be used to evaluate the spatial distribution similarity of the engineer-designed and neural-network-designed shear wall layouts. This study embeds design conditions in the GNN-based design method, and the considered design conditions are highly related to the seismic and lateral force resistance performance of the shear wall layout. The shear wall ratios in two orthogonal directions are convenient indicators to evaluate the lateral force resistance performance of the shear wall layout. The shear wall ratio is considered by weight coefficients w1 and w2, and Equation (4) obtains the comprehensive evaluation index ScoreDC that considers the similarity of the shear wall layout distribution and the similarity of the shear wall ratio by multiplying the weight coefficients of the shear wall ratio by IoUSW.
|
ScoreDC = IoUSW ˇÁ w1 ˇÁ w2 |
(4) |
|
|
w1 = 1 Ł |swgt1 Ł swpre1| / swgt1 |
(5) |
|
|
w2 = 1 Ł |swgt2 Ł swpre2| / swgt2 |
(6) |
|
|
swgt1 = PNsw_gt1 / PNwall |
(7) |
|
|
swgt2 = PNsw_gt2 / PNwall |
(8) |
|
|
swpre1 = PNsw_pre1 / PNwall |
(9) |
|
|
swpre2 = PNsw_pre2 / PNwall |
(10) |
|
|
IoUSW = PNSW_inter / PNSW_union |
(11) |
|
|
PNSW_union = PNSW_gt + PNSW_GNN − PNSW_inter |
(12) |
where ScoreDC is the comprehensive evaluation index; IoUSW is the IoU of the shear wall layout designed by the GNN model and that designed by engineers, which is calculated by projecting the design results on a pixel image with spatial resolution of 10 mm/pix, and the calculation method is consistent with that shown in Figure 6 in the study by Zhao et al. [3]; w1 and w2 are, respectively, the weight coefficients of the shear wall ratio in two orthogonal directions; swgt1 and swgt2 are, respectively, the shear wall ratios in the two orthogonal directions of the engineerˇŻs design results; swpre1 and swpre2 are, respectively, the shear wall ratios in the two orthogonal directions of the GNN modelˇŻs design results; PNsw_gt1 and PNsw_gt2 are, respectively, the pixel number of the shear walls in the two orthogonal directions of the engineerˇŻs design result; PNsw_pre1 and PNsw_pre2 are, respectively, the pixel number of the shear walls in the two orthogonal directions of the GNN modelˇŻs design result; PNwall is the pixel number of the PSW in the shear wall structure; PNSW_inter and PNSW_union are the intersection and union of the engineer-designed and GNN-designed shear wall layouts, respectively; and PNSW_gt and PNSW_GNN are the shear wall pixel numbers of the engineer-designed and GNN-designed shear wall layouts, respectively.
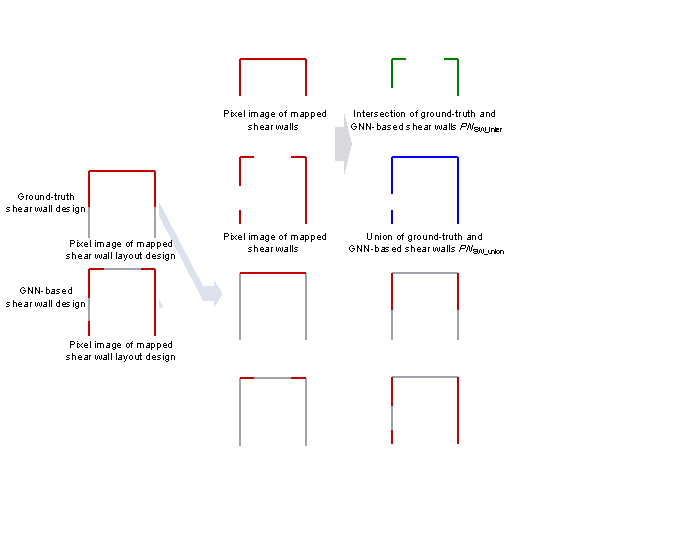
Figure 6 Schematic diagram of ScoreDC.
4.2. Evaluation of Test Set
4.2.1. Evaluation Results of Different Design Condition Combination Scenarios
Figure 7 displays the average ScoreDC of the test set for the four design condition combination scenarios (GNN-DC-0, GNN-DC-1, GNN-DC-2, and GNN-DC-3) and four graph edge representation methods (Graph-PSW, Graph-PSW-DW, Graph-PSW-PW, and Graph-PSW-PW-DW). As evident from Figure 7, for all the graph edge representation methods, GNN-DC-3 exhibits the best performance, whereas GNN-DC-0 fares the poorest. GNN-DC-0, GNN-DC-1, GNN-DC-2, and GNN-DC-3 exhibit a trend of progressive performance improvements. This trend indicates that the adequacy of the design conditions positively influences the ability of the GNN-based design method to capture the performance of the shear wall layout. In addition, the Graph-PSW-DW graph edge representation method has the best overall effect, consistent with the findings by Zhao et al. [3].
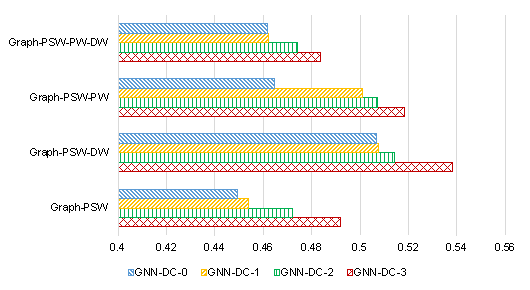
Figure 7 ScoreDC for different design condition combination scenarios.
4.2.2. Comparison with Individual Training by Design Condition Group
In Section 3.3, it is mentioned that the 30 data in the test set of this study are consistent with those used by Zhao et al. [3]. In Zhao et al. [3]ˇŻs study, the structural data with different seismic design intensities were pre-divided into three groups, namely G7H1, G7H2, and G8, and trained in separate groups. G7H1 and G7H2 indicate that the seismic design intensity is 7ˇă, and the PGA of the DBE is 100 cm/s2. G7H1 and G7H2 correspond to structure heights ˇÜ 50 m and > 50 m, respectively. G8 indicates that the seismic design intensity is 8ˇă, and the PGA of the DBE is 200 cm/s2. Unlike the group training approach in the study by Zhao et al. [3], this study trains all the shear wall data with different design conditions, considering the design condition as one of the data features. Figure 8 shows the difference in the average ScoreDC of the 30 test set data when comparing the proposed method with that of Zhao et al. [3]. For comparison, the design condition combination scenario GNN-DC-3 is used in this study, and GNN-Individual Training presents the training method used by Zhao et al. [3]. As shown in Figure 8, in most cases, the ScoreDC of the condition-informed design method proposed in this study is either better than or at par with the grouped training method used by Zhao et al. [3].
Zhao et al. [3] divided the data into G7H1, G7H2, and G8 groups. However, pre-grouping the data according to the design conditions often leads to a coarse grouping basis. Rough grouping limits the design conditions of the shear wall structure that the neural network can handle to the group categories, which may not align with the relatively flexible combinations of the design conditions required in practical design scenarios. Moreover, pre-grouping divides the data into several groups, reducing the amount available for individual training and thus impacting the neural networkˇŻs generalization ability. In contrast, the proposed design-condition-informed method for the shear wall layout design overcomes these limitations. Only one well-trained model is required to design the shear wall layout for any combination of design conditions. As a result, the proposed design method outperforms the pre-grouped training method in terms of convenience and flexibility when handling the various design condition combinations.
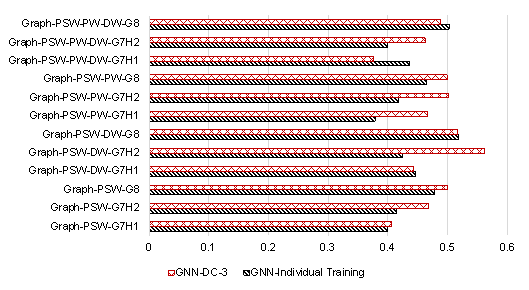
Figure 8 Differences in ScoreDC between this study and Zhao et al. [3]ˇŻs study on G7H1, G7H2, and G8 design groups.
4.2.3. Difference in Shear Wall Layouts Between Two Shear Wall Representation Methods
As depicted in Section 3.1 and Figure 3, a difference exists in the representation of the shear walls in the graph compared to that by Zhao et al. [3]. When a PSW is covered with shear walls, this study uses ˇ°100 %ˇ± as the proportion of shear walls at both ends of the PSW edge to represent the shear wall, while Zhao et al. [3] used ˇ°50 %ˇ±. Figure 9a shows the ScoreDC difference between the two shear wall representation methods under the design condition combination scenario GNN-DC-3, where GNN-DC-3-100%Wall uses ˇ°100 %ˇ± as the shear wall proportion at both ends of the PSW edge to represent the shear wall when a PSW is covered with shear walls, and GNN-DC-3-50%Wall uses ˇ°50 %ˇ±, which is same as the shear wall representation method by Zhao et al. [3]. It can be observed from Figure 9a that the proposed feature-representation method of shear walls exhibits a slightly better performance on ScoreDC than the feature-representation method by Zhao et al. [3]. Figure 9b shows an example from the test set, highlighting that the proposed method significantly reduces instances in which the shear wall layout prediction results in a small section of the partition walls separating the shear wall, as shown in Figure 3b.
In actual engineering, it is almost impossible for the shear wall layout to be interrupted by a very small segment of a partition wall, as shown in Figure 3b. This kind of shear wall interruption caused by minor prediction errors often means that there is a partition wall with a minimal length (even less than 200 mm) between two shear wall segments, which does not meet the engineering reality. Therefore, a method that can solve this shear-wall-layout problem shown in Figure 3b is necessary and has practical significance.
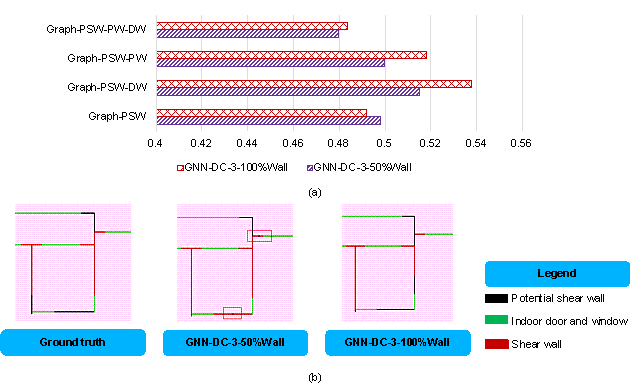
Figure 9 Difference in shear wall layouts between two shear wall representation methods: (a) ScoreDC of GNN-DC-3-100%Wall and GNN-DC-3-50%Wall , and (b) difference in shear wall layouts of a case.
4.2.4. Change of Shear Wall Ratio with Design Conditions and Sensitivity Analysis
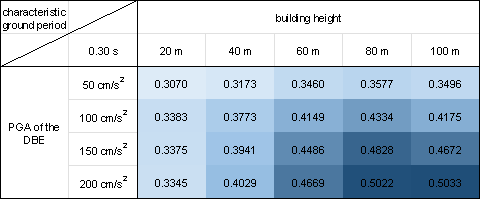
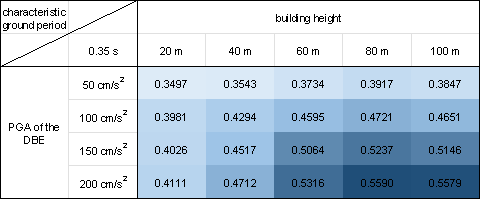
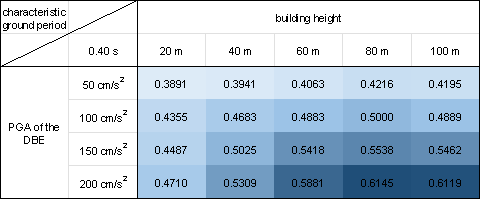
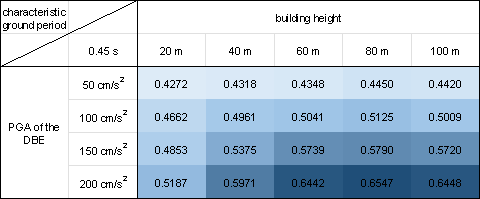
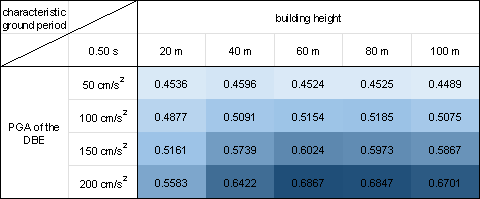
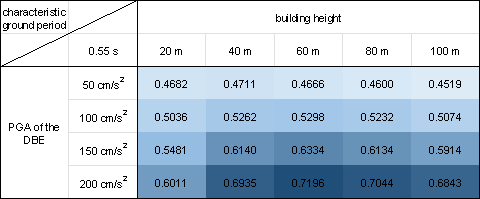
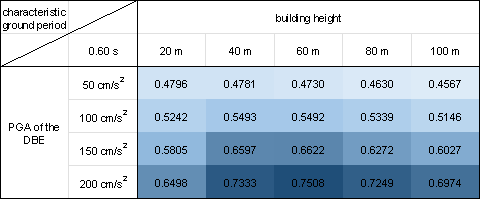
In this study, we conduct a statistical analysis of 50 test cases considering the various combinations of design conditions, which include five building heights (20, 40, 60, 80, and 100 m), four PGAs of the DBE (50, 100, 150, and 200 cm/s²), and four characteristic ground periods (0.35, 0.45, 0.55, and 0.65 s).
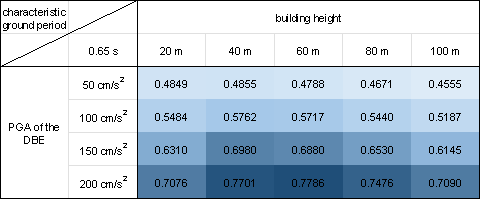
Figure 10 shows the mean value of the shear wall ratio swtotal for all the 50 test cases corresponding to each combination of the design conditions. The shear wall ratio swtotal is the ratio of the shear wall length to all the PSWs. Similar to Equations (7)¨C(10), the shear wall ratio swtotal is calculated by projecting the design results onto a pixel image with a spatial resolution of 10 mm/pix, employing Equation (13) for the calculation.
|
swtotal = PNsw / PNwall |
(13) |
where PNsw is the pixel number of the shear wall of the GNN-designed shear wall layout and PNwall is the pixel number of the PSWs in the shear wall structure.
Figure 10 demonstrates that the proposed design-condition-informed method enables a better understanding of the shear wall layout variations with respect to the design conditions. Specifically, under identical building heights and characteristic ground periods, the shear wall ratio tends to increase with an increase in the PGA values of the DBE. The PGA of the DBE directly influences the maximum value of the spectral acceleration during the shear wall structure design, consequently impacting the lateral load of the seismic design. Because the shear wall plays a vital role in resisting the lateral forces in a shear wall structure, an increase in the lateral load during seismic design results in more shear walls.
Under a constant PGA of the DBE, the shear wall ratio exhibits an initial increase, followed by a slight decrease with an increase in the building height. According to the Chinese code for seismic design of buildings [26], when the structural natural vibration period is greater than the characteristic ground period Tg, the spectral acceleration of the seismic design response spectrum gradually decreases, as shown in Figure 4. For the same architectural layout, an increase in height often corresponds to a longer natural vibration period. For lower structural heights, the period is smaller, and height increment results in an increased vertical load. Consequently, as the height increases, the shear wall ratio generally increases to withstand the vertical gravity load. However, when the structure is high, the horizontal load becomes the control load for the shear walls. A longer natural vibration period reduces the spectral acceleration of the seismic design response spectrum, thereby reducing the lateral seismic force. Consequently, the shear wall ratio decreases with a decrease in spectral acceleration.
As the characteristic ground period increases, the shear wall ratio increases. As the characteristic ground period increases, the corresponding period value (the characteristic ground period Tg at which the spectral acceleration value in the seismic design response spectrum decreases) increases, as shown in Figure 4. In scenes with longer characteristic ground periods, structures with the same natural vibration period are more likely to experience higher spectral acceleration than those with smaller characteristic ground periods. Consequently, when the characteristic ground period is extended, engineers tend to arrange more shear walls to enhance the seismic resistance.
(a)
(b)
(c)
(d)
(e)
(f)
(g)
(h)
Figure 10 Shear wall ratios under various combinations of design conditions with characteristic ground periods of (a) 0.30 s, (b) 0.35 s, (c) 0.40 s, (d) 0.45 s, (e) 0.50 s, (f) 0.55 s, (g) 0.60 s, and (h) 0.65 s.
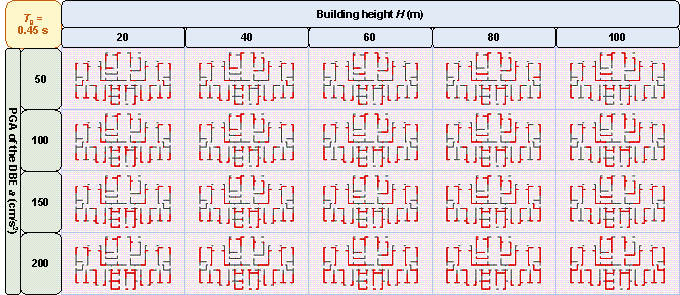
Figure 11 shows the GNN-based shear wall layouts under various combinations of design conditions corresponding to Figures 10c and 10d with specific cases. The results of shear wall layouts corresponding to the remaining cases in Figure 10 (Figures 10a-10b and Figures 10e-10h) are supplemented in Figure B.1 in Appendix B.

(a)
(b)
Figure 11 Shear wall layouts of one case under
various combinations of design conditions corresponding to
(a) Figure 10c and (b) Figure 10d.
Furthermore, Figure 12, taking 3 m as the change step of structure height, shows the influence of small changes in structure height on the average shear wall ratios of all test-set results under the scenario of the PGA of the DBE of 100 cm/s2 and the characteristic ground period of 0.45 s. In the case where the PGA of the DBE is 100 cm/s2 and the characteristic ground period is 0.45 s, the shear wall ratio increases with the increase of building height when the building height is less than 80 m, and the shear wall ratio decreases with the increase of building height when the building height is greater than 80 m. This trend is consistent with that shown in Figure 10d. Figures 10-12 and B.1 show that the shear wall layout designed by the proposed GNN-based method is highly related to the design conditions, and the quantitative characteristics of the shear wall layout can change sensitively with the design conditions.
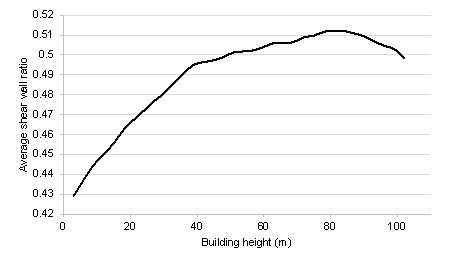
Figure 12 Variation of the average shear wall ratios of all test-set results with the structure height under the scenario of the PGA of the DBE of 100 cm/s2 and the characteristic ground period of 0.45 s.
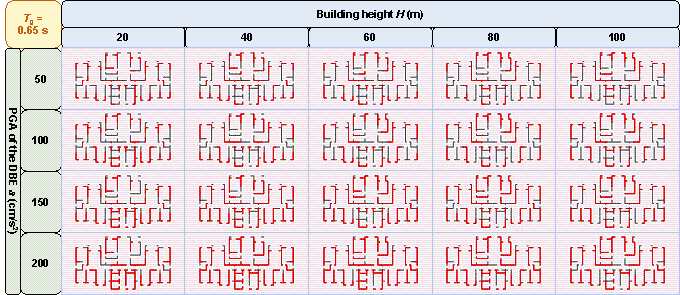
4.2.5. Design Results of Test-Set Cases
Figure 13 shows the design results of shear wall layouts for 10 cases in the test set, and the remaining 40 test-set cases are shown in Figure C.1 in Appendix C. It can be seen from Figure 13 and Figure C.1 that the test set includes a variety of architectural layouts and design condition combinations, and the proposed method in this study can better capture the shear wall layouts. Therefore, the proposed method is general to various architectural layouts and design condition combinations.
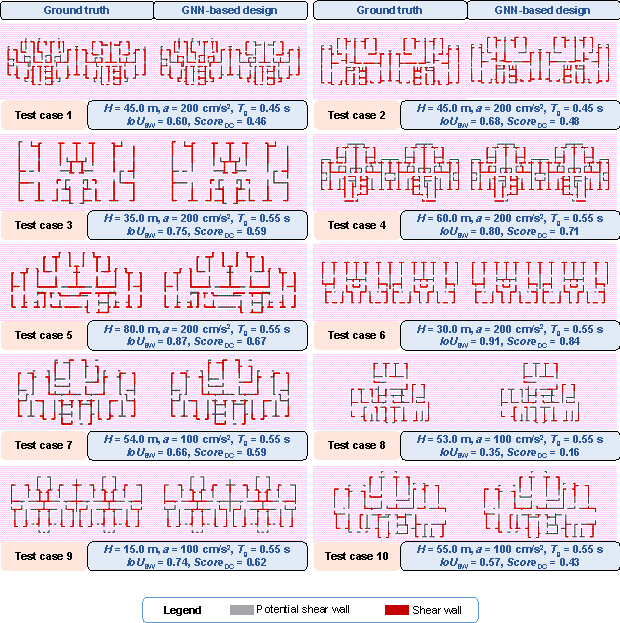
Figure 13 Design results of test cases 1¨C10.
5. Case Studies
Using a test case as an illustration, Figure 14 presents the shear wall layout design results for the same architectural configuration under different design conditions and the corresponding shear wall ratio (swtotal) values. For convenience, only the shear walls and PSWs are shown in Figure 14, wherein the number of shear walls in the layout exhibits substantial variations under different design conditions. Moreover, the variation pattern of the shear wall ratio swtotal is consistent with that shown in Figure 10.
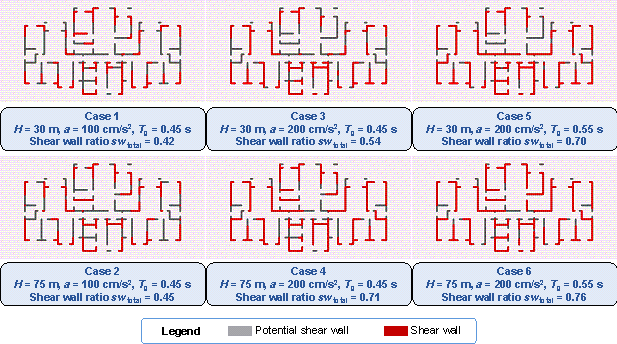
Figure 14 Shear wall layouts of one case under different design conditions.
The method proposed by Zhao et al. [28] is used to arrange the beam and slab of the shear wall structure, followed by mechanical analysis and preliminary design. The floor height is 3 m. Subsequently, this study analyses the inter-story drift ratios of the cases depicted in Figure 14 under earthquake action, as illustrated in Figure 15. Figure 16 shows the vertical displacements of the typical floor slabs of the cases under gravity load. Table 2 presents the natural vibration periods, torsional period ratio (the ratio of the first torsional natural vibration period and the first translational natural vibration period), maximum inter-story drift ratios, total masses, and concrete and steel material consumptions. Figure 15, Figure 16, and Table 2 show that the structural properties are highly related to the shear wall layout. Notably, all the design results exhibit maximum inter-story drift ratios below the design limit of 0.001 [26], thus fulfilling the design requirements of the specifications. The torsional period ratio is an important index to control the torsional effect of the structure, and Table 2 shows that the torsional period ratios of the cases are below the design limit of 0.9 [26, 29]. It can be observed from Cases 1, 3, and 5 presented in Table 2 that an increase in the shear wall ratio leads to increased total mass and material consumption, accompanied by a reduction in the natural vibration period. The same conclusion can be drawn from Cases 2, 4, and 6 presented in Table 2.
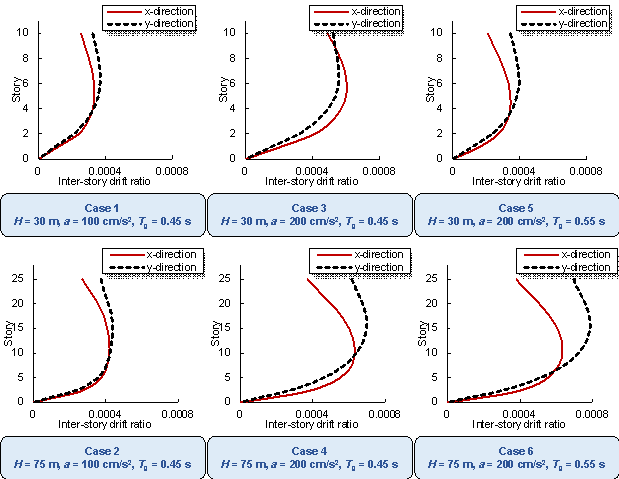
Figure 15 Inter-story drift ratios of cases under different design conditions.
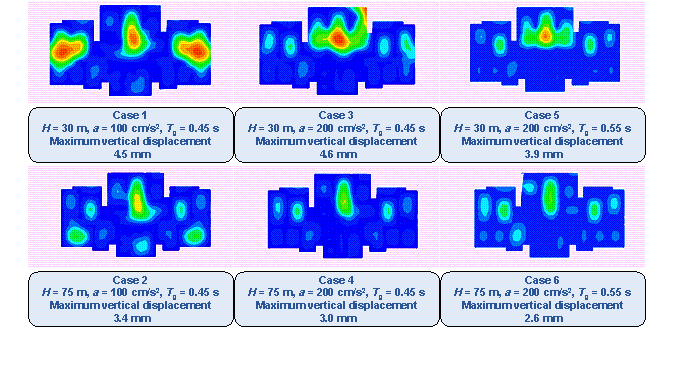
Figure 16 Vertical typical-floor-slab displacement cloud diagrams of cases under different design conditions.
Table 2 Some structural characteristics of cases under different design conditions
|
Structural characteristics |
Case 1 |
Case 2 |
Case 3 |
Case 4 |
Case 5 |
Case 6 |
|
|
Design conditions |
H (m) |
30 |
75 |
30 |
75 |
30 |
75 |
|
a (cm/s2) |
100 |
100 |
200 |
200 |
200 |
200 |
|
|
Tg (s) |
0.45 |
0.45 |
0.45 |
0.45 |
0.55 |
0.55 |
|
|
Mass and material consumption |
Total mass (ton) |
4980.7 |
13497.8 |
5222.8 |
16022.3 |
5625.7 |
16451.9 |
|
Concrete consumption (m3) |
1125.9 |
3242.8 |
1218.3 |
4238.3 |
1386.7 |
4408.8 |
|
|
Steel consumption (ton) |
116.3 |
299.6 |
117.2 |
377.9 |
123.7 |
385.9 |
|
|
Natural vibration periods |
1st period (s) |
0.70 |
1.93 |
0.56 |
1.37 |
0.38 |
1.33 |
|
2nd period (s) |
0.59 |
1.67 |
0.50 |
1.20 |
0.36 |
1.13 |
|
|
3rd period (s) |
0.56 |
1.44 |
0.40 |
0.89 |
0.29 |
0.82 |
|
|
Torsional period ratio |
0.80 |
0.75 |
0.71 |
0.65 |
0.76 |
0.62 |
|
|
Maximum inter-story drift ratios |
x direction |
0.00033 |
0.00042 |
0.00060 |
0.00063 |
0.00034 |
0.00063 |
|
y direction |
0.00037 |
0.00044 |
0.00056 |
0.00070 |
0.00040 |
0.00079 |
|
Although the GNN-designed shear wall layouts can meet some critical requirements of design codes (such as the maximum inter-story drift ratio and torsional period ratio), the current shear wall layout designed by the proposed method is a preliminary design of the structural layout scheme, and there are still some practical limitations and challenges in engineering applications. Real-world engineering projects often have complex architectural designs and regulatory constraints. However, the proposed method is aimed at the preliminary scheme design stage, and the design result of the proposed method still needs design development and construction documentation stages and further optimization before it can be applied to real-world engineering projects. In the future, we will further improve the proposed GNN-based design method and combine it with the optimization design method to improve the feasibility of the design results in practical engineering applications.
6. Conclusion
This study proposes a design-condition-informed method for the shear wall layout design based on GNNs. The shear wall layout design guided by the design conditions is realized by embedding three essential design conditions (the PGA of the DBE, characteristic ground period, and building height) into the graph node and edge features of the shear wall structure. The test cases demonstrate that the proposed method can capture the spatial distribution and shear wall ratio characteristics. Following are the conclusions.
(1) The influence of the adequacy of design conditions on the design results is investigated. As the adequacy of the design conditions increases, the GNN-based shear wall layout design method better captures the performance of the shear wall layout. Specifically, GNN-DC-3, which considers all three essential design conditions, exhibits the best performance.
(2) The scenario in which the design conditions are embedded in the graph data to guide the design of the shear wall structure, and the scenario, in which the data are pre-grouped for training are compared. Overall, the proposed design-condition-informed design method outperforms the pre-grouped design method. Moreover, the proposed method requires only one well-trained model to handle any combination of design conditions, which significantly enhances its practicality for engineering applications.
(3) The robustness of the proposed method is demonstrated by applying the shear wall layout design to the test cases under various combinations of design conditions. The proposed method can effectively capture the correlation between the three essential design conditions (the PGA of the DBE, characteristic ground period, and building height) and shear wall layout. Additionally, the case studies confirm that the proposed design method can grasp the relationship between the shear wall layout and design conditions while satisfying the code requirements for the fundamental mechanical indicators.
This study exploratorily embeds design conditions into the GNN-based design method for shear wall layout and shows feasibility; however, several improvements still need to be made. The following directions require further research:
(1) More types of GNN model architectures and model hyperparameters need to be further explored.
(2) Based on this study, it is feasible to embed additional design conditions into the neural network to guide the structural layout design.
(3) Combined with the engineering experience, the requirements of the mechanical properties of the structure, and the consumption of materials used in the engineering project, the optimization algorithm can be integrated with the GNN-based design method to improve the shear wall layout.
Declaration of Competing Interest
The authors declare that they have no known competing financial interests or personal relationships that could have appeared to influence the work reported in this paper.
Acknowledgments
Appendices
Appendix A. Comparison of Different Loss Functions
The L1 loss function is a commonly used loss function in the feature regression prediction problem of neural networks, and its reliability has been shown in the research of Zhao et al. [3]. The core architecture of the GNN model used in this study and the research goal of this study are consistent with those of Zhao et al. [3], so it is reliable to adopt the loss function consistent with that of Zhao et al. [3]. In addition to the L1 loss function, commonly used loss functions in the feature regression prediction problem include the L2 loss function (mean square error) [30] and the smooth L1 loss function [31-32].
Equations (A.1)¨C(A.4) show the calculation methods of the three loss functions (the L1, L2 and smooth L1 loss functions).
|
|
(A.1) |
|
|
|
(A.2) |
|
|
|
(A.3) |
|
|
|
(A.4) |
where lossL1 is the L1 loss; lossL2 is the L2 loss; losssmoothL1 is the smooth L1 loss; N is the edge sample number; yi is the ground-truth value of the ith sample; pi is the predicted value of the ith sample; zi is an intermediate variable [3, 27, 30-32].
Figure A.1 displays the average ScoreDC of the test set for the GNN-DC-3 scenario using three different loss functions (the L1, L2, and smooth L1 loss functions). It can be seen from Figure A.1 that the L1 loss function is better than the L2 loss function and the smooth L1 loss function.
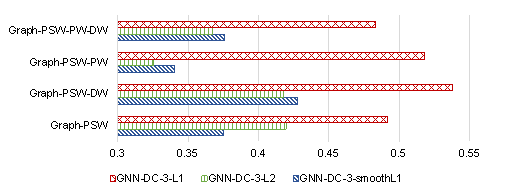
Figure A.1 Differences in ScoreDC between L1, L2, and smooth L1 loss functions.
Appendix B. Shear Wall Layouts of One Case Under Various Design Conditions
Figure B.1 shows the shear wall layouts of one case under various combinations of design conditions with characteristic ground periods of 0.30 s, 0.35 s, 0.50 s, 0.55 s, 0.60 s, and 0.65 s, as a supplement to Figure 11 in Section 4.2.4. Figure B.1 and Figure 11 show that the GNN-designed shear wall layout is highly related to the design conditions, and the characteristic that the number of shear wall layouts varies with design conditions is consistent with that described in Section 4.2.4.
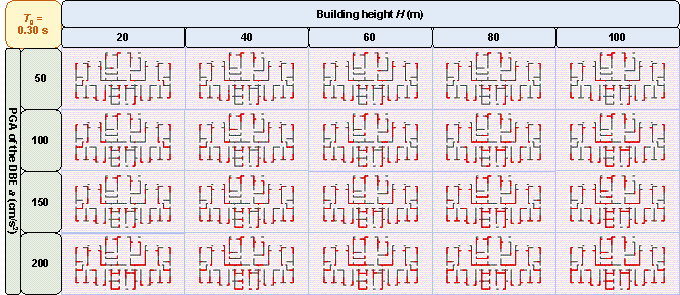
(a)
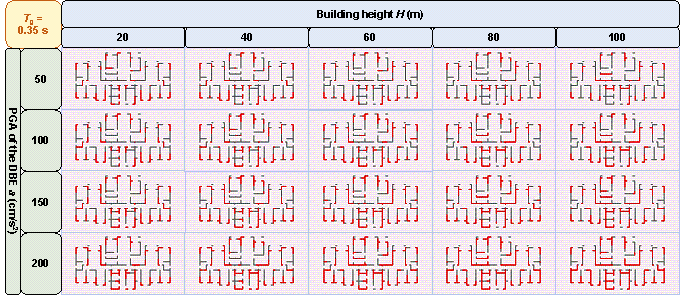
(b)
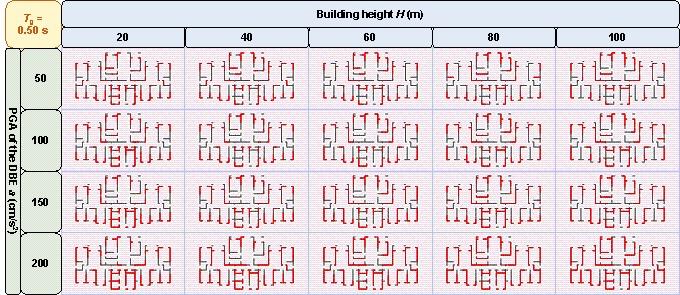
(c)
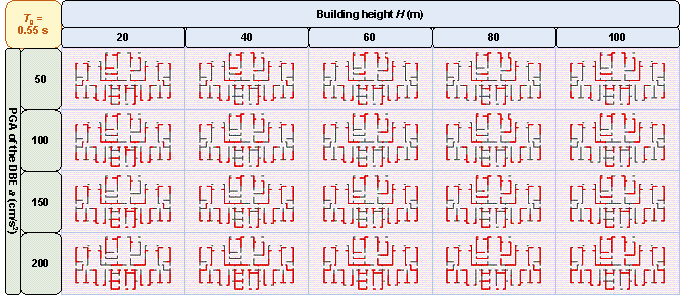
(d)
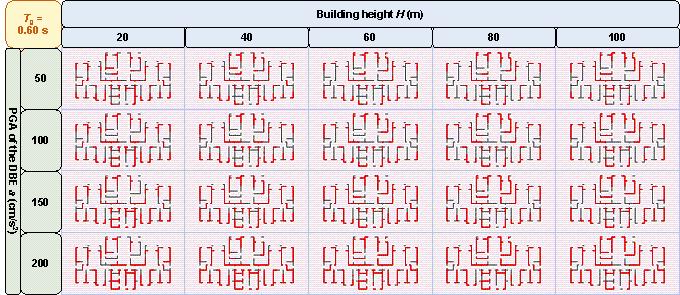
(e)
(f)
Figure B.1 Shear wall layouts of one case under various combinations of design conditions with characteristic ground periods of: (a) 0.30 s, (b) 0.35 s, (c) 0.50 s, (d) 0.55 s, (e) 0.60 s, and (f) 0.65 s.
Appendix C. Design Results of Test Cases
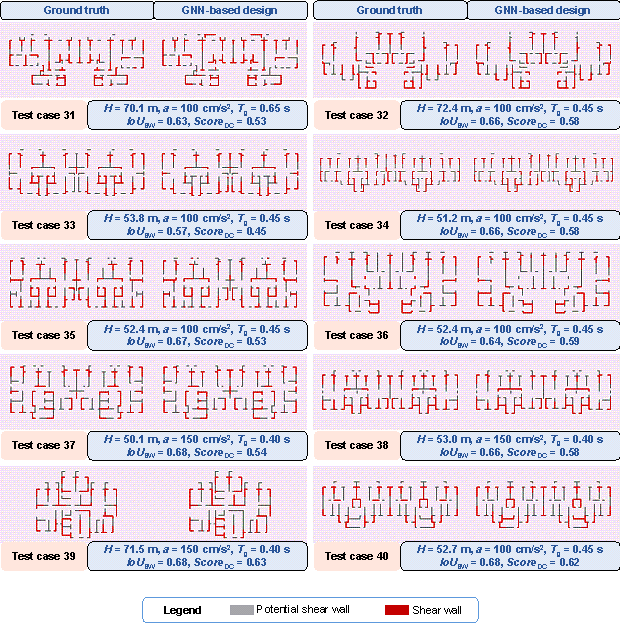
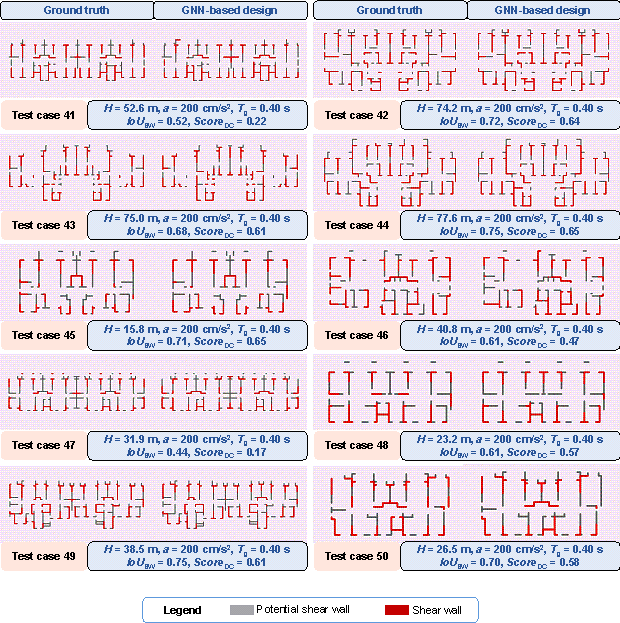
Figure C.1 shows the design results of shear wall layouts for cases 11¨C50 in the test set.
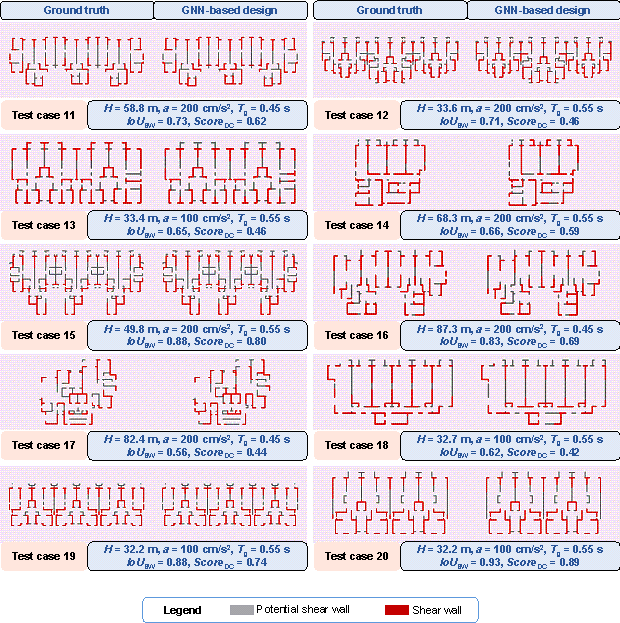
(a)
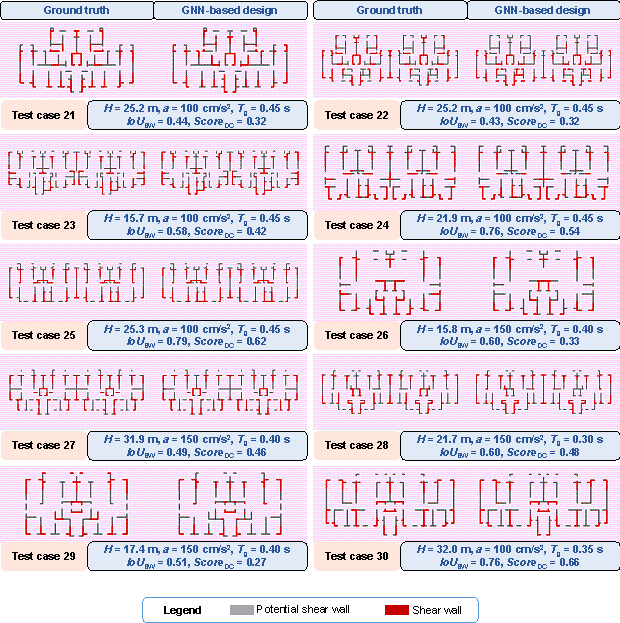
(b)
(c)
(d)
Figure C.1 Design results of test cases 11¨C50:
(a) test cases 11¨C20, (b) test cases 21¨C30, (c) test cases 31¨C40, and (d)
test cases 41¨C50.
References
[1] M.S. Barkhordari, M. Tehranizadeh, Response estimation of reinforced concrete shear walls using artificial neural network and simulated annealing algorithm, Structures 34 (2021) 1155¨C1168, https://doi.org/10.1016/j.istruc.2021.08.053
[2] W.J. Liao, X.Z. Lu, Y.L. Huang, Z. Zheng, Y.Q. Lin, Automated structural design of shear wall residential buildings using generative adversarial networks, Autom. Constr. 132 (2021) 103931, https://doi.org/10.1016/j.autcon.2021.103931
[3] P.J. Zhao, W.J. Liao, Y.L. Huang, X.Z. Lu, Intelligent design of shear wall layout based on graph neural networks, Adv. Eng. Inform. 55 (2023) 101886, https://doi.org/10.1016/j.aei.2023.101886
[4] J.R. Qian, Z.Z. Zhao, X.D. Ji, L.P. Ye, Design of tall building structures, Third Edition, China Architecture & Building Press, 2018, ISBN: 9787112216840 (in Chinese)
[5] P.S. Shen, Design of tall building structures, Third edition, China Architecture & Building Press, 2017, ISBN: 9787112210053 (in Chinese)
[6] D.P.H. Claessens, S. Boonstra, H. Hofmeyer, Spatial zoning for better structural topology design and performance, Adv. Eng. Inform. 46 (2020) 101162, https://doi.org/10.1016/j.aei.2020.101162
[7] B. Fu, Y. Gao, W. Wang, Dual generative adversarial networks for automated component layout design of steel frame-brace structures, Autom. Constr. 146 (2023) 104661, https://doi.org/10.1016/j.autcon.2022.104661
[8] Y.F. Fei, W.J. Liao, Y.L. Huang, X.Z. Lu, Knowledge-enhanced generative adversarial networks for schematic design of framed tube structures, Autom. Constr. 144 (2022) 104619, https://doi.org/10.1016/j.autcon.2022.104619
[9] X. Zhou, L. Wang, J. Liu, G. Cheng, D. Chen, P. Yu, Automated structural design of shear wall structures based on modified genetic algorithm and prior knowledge, Autom. Constr. 139 (2022) 104318, https://doi.org/10.1016/j.autcon.2022.104318
[10] P.N. Pizarro, L.M. Massone, F.R. Rojas, R.O. Ruiz, Use of convolutional networks in the conceptual structural design of shear wall buildings layout, Eng. Struct. 239 (2021) 112311, https://doi.org/10.1016/j.engstruct.2021.112311
[11] P.N. Pizarro, L.M. Massone, Structural design of reinforced concrete buildings based on deep neural networks, Eng. Struct. 241 (2021) 112377, https://doi.org/10.1016/j.engstruct.2021.112377
[12] X.Z. Lu, W.J. Liao, Y. Zhang, Y.L. Huang, Intelligent generative design of shear wall structures using physics-informed generative adversarial networks, Earthq. Eng. Struct. Dyn. 2022, https://doi.org/10.1002/eqe.3632
[13] W.J. Liao, Y.L. Huang, Z. Zheng, X.Z. Lu, Intelligent generative structural design method for shear wall building based on ˇ°fused-text-image-to-imageˇ± generative adversarial networks, Expert Syst. Appl. 210 (2022) 118530, https://doi.org/10.1016/j.eswa.2022.118530
[14] P.J. Zhao, W.J. Liao, Y.L. Huang, X.Z. Lu, Intelligent design of shear wall layout based on attention-enhanced generative adversarial network, Eng. Struct. 274 (2023) 115170, https://doi.org/10.1016/j.engstruct.2022.115170
[15] Y.F. Fei, W.J. Liao, S. Zhang, P.F. Yin, B. Han, P.J. Zhao, X.Y. Chen, X.Z. Lu, Integrated schematic design method for shear wall structures: a practical application of generative adversarial networks, Buildings 12 (2022) 1295, https://doi.org/10.3390/buildings12091295
[16] Y. Ma, J. Tang, Deep learning on graphs, Cambridge University Press, 2021, https://doi.org/10.1017/9781108924184
[17] W.L. Hamilton, Graph representation learning, synthesis lectures on artificial intelligence and machine learning, 14 (2020) 1¨C159, https://doi.org/10.2200/S01045ED1V01Y202009AIM046
[18] G. Ślusarczyk, Visual language and graph-based structures in conceptual design, Adv. Eng. Inform. 26 (2012) 267¨C279, https://doi.org/10.1016/j.aei.2011.10.005
[19] C. Langenhan, M. Weber, M. Liwicki, F. Petzold, A. Dengel, Graph-based retrieval of building information models for supporting the early design stages, Adv. Eng. Inform. 27 (2013), 413¨C426, https://doi.org/10.1016/j.aei.2013.04.005
[20] K. Hayashi, M. Ohsaki, Graph-based reinforcement learning for discrete cross-section optimization of planar steel frames, Adv. Eng. Inform. 51 (2022) 101512, https://doi.org/10.1016/j.aei.2021.101512
[21] S.J. Russell, P. Norvig, Artificial intelligence: a modern approach, Fourth Edition, Hoboken: Pearson, 2021, http://aima.cs.berkeley.edu/
[22] P.J. Zhao, W.J. Liao, Y.L. Huang, X.Z. Lu, Intelligent beam layout design for frame structure based on graph neural networks, J. Build. Eng. 63 (2023) 105499, https://doi.org/10.1016/j.jobe.2022.105499
[23] K.H. Chang, C.Y. Cheng, Learning to simulate and design for structural engineering, In: PMLR 119: Proceedings of the 37th International Conference on Machine Learning, 2020 Jul 13¨C18, Online, 2020, pp. 1426¨C1436, https://doi.org/10.48550/arXiv.2003.09103
[24] C. M¨˘laga-Chuquitaype, Machine learning in structural design: an opinionated review, Front. Built Environ. 8 (2022) 815717, https://doi.org/10.3389/fbuil.2022.815717
[25] M. Zaman, M.R. Ghayamghamian, Risk-adjusted design basis earthquake: a case study of Tehran megacity, Bull Earthquake Eng 17 (2019) 3777¨C3799, https://doi.org/10.1007/s10518-019-00625-0
[26] GB 50011¨C2010, Code for seismic design of buildings, China Architecture & Building Press, Beijing, 2016 (in Chinese)
[27] T. Chai, R.R. Draxler, Root mean square error (RMSE) or mean absolute error (MAE), Geoscientific Model Development Discussions 7 (2014) 1525-1534, https://doi.org/10.5194/gmdd-7-1525-2014
[28] P.J. Zhao, W.J. Liao, H.J. Xue, X.Z. Lu, Intelligent design method for beam and slab of shear wall structure based on deep learning, J. Build. Eng. 57 (2022) 104838, https://doi.org/10.1016/j.jobe.2022.104838
[29] JGJ3¨C2010, Code for seismic design of buildings, China Architecture & Building Press, Beijing, 2010 (in Chinese)
[30] P. Christoffersen, K. Jacobs, The importance of the loss function in option valuation, J. Financ. Econ. 72(2004) 291-318, https://doi.org/10.1016/j.jfineco.2003.02.001
[31] R. Girshick, Fast R-CNN, in: IEEE International Conference on Computer Vision (ICCV), 2015, https://doi.org/10.48550/arXiv.1504.08083
[32] PyTorch, https://pytorch.org/docs/stable/generated/torch.nn.SmoothL1Loss.html#torch.nn.SmoothL1Loss, 2023 (accessed 23 August 2023)