1 Introduction
In complex engineering challenges where obtaining analytical solutions becomes problematic, numerical methods such as the finite element (FE) method and computational fluid dynamics are frequently employed to obtain numerical solutions. Ensuring the accuracy of these numerical solutions typically necessitates the establishment of high-fidelity numerical models, which incurs substantial computational expenses 1 . In scenarios requiring hundreds or even thousands of calculation iterations, such as design optimization, sensitivity analysis, and uncertainty assessment, the utilization of high-fidelity numerical models is challenging 2 . For example, general-purpose FE software packages are extensively used in the seismic design of building structures because of their ability to formulate numerical models for each structural component, thus yielding precise and comprehensive outcomes. However, the computational time for a single design scheme typically extends to several minutes or longer, which renders these software packages inadequate for satisfying design optimization demands. This is primarily because design optimization entails the evaluation of hundreds of potential design schemes 3,4 . If a general-purpose FE software is employed, then seismic-performance evaluation alone will consume dozens of hours, which is unacceptable in practical design scenarios when time is a critical factor.
To reduce computational expenses, surrogate models for high-fidelity numerical models have been proposed for accomplishing tasks such as design optimization 5 , sensitivity analysis 6 , and uncertainty assessment 7 . These surrogate models can be classified into three categories 8 : (1) Physics-based models derived entirely from physical principles and mechanical theorems��These models are characterized by clear concepts and well-defined physical meanings but require numerous simplifications and assumptions, thus rendering parameter calibration challenging for complex problems; (2) Data-driven models grounded solely in statistical methods and induced from extensive data��These models do not require prior physical knowledge and can instead directly establish the relationship between inputs and outputs in an end-to-end manner. Large data-driven models (e.g., ChatGPT, Sora, etc.) can perform exceptionally well, but unlocking their full potential requires billions of data, which is unavailable in many tasks. (3) Hybrid models combining the two aforementioned model types��These models can overcome the shortcomings of the individual models. Hybrid models are comparatively simpler for parameter calibration and offer enhanced performance with less data, yet relevant studies are limited.
Shear-wall structures are a typical type of building structure that is frequently constructed in earthquake-prone regions for high-rise residential building projects. Project contractors impose stringent economic demands, thus requiring structural engineers to iteratively optimize structural configurations to economize on materials while adhering to mechanical prerequisites. Nevertheless, the computational intricacy of employing general-purpose FE software for analyses is overwhelming, thereby resulting in unduly prolonged design optimization durations and a practical demand for surrogate models. Based on an extensive review of relevant literature and a questionnaire survey administered to structural engineers, the most pivotal seismic response control factor within the context of shear-wall structure optimization design in China has been identified to be the maximum inter-story drift ratio (IDR) during design earthquakes 4,9 . Therefore, this study considers the IDR as the seismic response control factor, which is estimated using a surrogate model. For a specified structural design of a shear-wall structure (encompassing the planar layout and geometric dimensions of shear walls and beams) and the associated design conditions (comprising seismic acceleration, site, and height conditions), the maximum IDR under design earthquakes is ascertained. Note that an ideal surrogate model should be able to simultaneously consider the effects of both the seismic capacity (according to the structural design) and the seismic action (according to design conditions) on IDR. Most existing data-driven or hybrid approaches only focus on one of these two aspects, as detailed in Section 2.
The primary contribution of this study is to propose a hybrid surrogate model that combines both physics-based and data-driven models via task decomposition and output correction strategies for facilitating rapid estimation of building seismic responses. The effectiveness of the proposed method is demonstrated through an illustrative example on the IDRs of shear-wall structures. The remainder of this paper is structured as follows: Section 2 provides a review of existing surrogate models for estimating the seismic responses of building structures. Section 3 introduces the dataset and outlines data augmentation methods. Section 4 presents a novel hybrid surrogate model composed of data-driven and physics-based models. Sections 5 and 6 present the details of the numerical experiments performed in this study and a case study, respectively. Finally, Section 7 summarizes the conclusions of this study.
2 Review of current literature
2.1 Physics-based surrogate model
In recent decades, physics-based surrogate models have been investigated extensively to simulate the seismic responses of building structures. For example, Miranda and Reyes 10 proposed a flexural-shear model based on the continuum theory that simplifies building structures into flexural and shear beams connected by rigid links, representing flexural and shear deformations, respectively. However, this approach is limited to elastic analyses. Hence, Kuang & Huang 11 discretized a continuum model into a multi-degree-of-freedom (MDOF) model, thus enabling nonlinear analysis to be conducted. Nevertheless, the computational parameters of this model are difficult to calibrate. Xiong et al. 12 applied the MDOF model for regional seismic damage assessment and introduced a convenient parameter calibration method. Yet, this method primarily addresses statistical patterns required for regional analyses.
Similarly, based on the Timoshenko beam theory, Cheng & Heaton 13 simplified building structures into coupled flexural-shear beams. However, this approach does not facilitate parameter calibration. Shan et al. 14 proposed a parameter calibration method for Timoshenko beams using monitoring data. Nonetheless, this method is not applicable to design optimization tasks before a building is constructed and monitored. Recently, Pizarro et al. 15 developed a simplified shear-wall structure model for optimization. The essence of this model is the MDOF model, where parameter calibration is achieved by simplifying the shear-wall groups into beam elements.
In summary, existing physics-based methods do not readily satisfy the design optimization requirements of building structures owing to challenges pertaining to parameter calibration or excessive model simplification.
2.2 Data-driven surrogate model
Owing to the emergence of artificial intelligence technology, data-driven surrogate models for the seismic responses of building structures are receiving increasing attention. Machine learning or regression models are mostly employed. For instance, Zaker Esteghamati and Flint 16 used support vector machines to surrogate the expected seismic loss and environmental performance of mid-rise concrete office buildings. Meanwhile, Kyprioti and Taflanidis 17 adopted a Kriging model to surrogate the engineering demand parameters of a three-story concrete frame structure under seismic action. Most recently, Zhong et al. 18 applied probabilistic learning on manifolds to surrogate the IDRs and floor acceleration response of a 12-story concrete frame structure under seismic loading. Demertzis et al. 19 and Junda et al. 20 adopted explainable machine learning approach to estimate the seismic drifts of reinforced concrete buildings and cross-laminated timber walled structures, respectively.
Additionally, deep learning models have also been adopted by researchers. For example, Dang-Vu et al. 21 predicted the IDRs of irregular building structures during seismic events using deep artificial neural networks (ANNs). Lu et al. 22 employed convolutional neural networks (CNNs) to predict the IDRs of shear-wall structures under seismic conditions. Xu et al. 23 predicted the nonlinear displacement response of steel frame structures under seismic loading using long short-term memory neural networks.
The aforementioned methods are essentially statistical models that differ primarily in terms of the number of trainable parameters. Because of the limited training data available, all these models possess restricted capacity in handling complex input information, in contrast to their larger counterparts trained on billions of data (e.g., ChatGPT and Sora). Most existing data-driven models solely focus on either seismic actions 17,21,23 or structural design parameters 16,22 , whereas a few encompass both preliminary design parameters (e.g., number of stories and overall dimensions) and seismic actions 18�C20 . Nevertheless, simultaneous consideration of detailed design parameters (e.g., component layout and section sizes) and seismic actions, which are crucial in design optimization, has not been achieved so far. Therefore, existing data-driven models cannot readily satisfy the requirements of design optimization.
2.3 Hybrid surrogate model
Hybrid surrogate models combining both physics-based and data-driven models have been proposed for investigating the seismic responses of building structures. One such approach involves the embedment of prior knowledge (e.g., physical mechanisms) into data-driven models. Zhang et al. 24 introduced a physics-informed neural network that embeds structural dynamics equations into the loss function, thereby significantly improving the prediction accuracy of the seismic responses of building structures. Chou et al. 25 formulated a novel neural network that could simultaneously estimate the story drift and the remaining stiffness ratio of building structures through a physics-guided multi-target loss function. However, these methods are only applicable to specific building structures and are difficult to be applied to the optimization tasks involving variations in structural design. Similar approaches have been extensively investigated in the field of dynamical systems but have not been used widely for building structures 26 .
Another approach involves task decomposition, in which each model exerts its strengths in the physical or data domains. Guan et al. 8 proposed a hybrid model that calculates elastic drifts based on a physical structural model and predicts inelastic drifts using a machine learning model. Zahra et al. 27 developed a hybrid model that also performs physics-based analysis to generate intermediate results and uses them as inputs to machine learning models for the final target. Both methods feature an analysis stage-based task decomposition strategy. However, these methods are primarily suitable for low-dimensional problems and cannot accommodate high-dimensional design variable inputs in design optimization tasks. In contrast, Xu et al. 28 and Mokhtari and Imanpour 29 adopted a structural component-based task decomposition strategy, wherein well-understood components are modeled by physics-based approaches and complex or new components are modeled by data-driven methods. However, these methods are not suitable for optimization tasks where component sizes keep changing, necessitating numerous data-driven models.
Compared with physics-based models, hybrid ones offer ease of parameter calibration by predicting parameters based on the patterns found in the dataset. Compared with data-driven models, hybrid ones offer enhanced performance with limited data by using physical principles to reduce the reliance on data. However, existing hybrid models either fail to consider structural design parameters 24,25,28,29 or are only capable of considering preliminary ones (e.g., number of stories and overall dimensions) 8,27 . The urgent necessity for developing a novel hybrid model is highlighted due to a lack of proper consideration for detailed design parameters (e.g., component layout and section sizes), as required by the optimization tasks. In this study, the analysis stage-based task decomposition strategy is utilized to establish hybrid surrogate models.
3 Dataset and data augmentation
To establish data-driven models, design drawings of 283 shear-wall structures were collected from several leading design institutes in China. The structural designs of the shear-wall structures, including the planar layouts and geometric dimensions of the shear walls and beams, were extracted from the design drawings.
With reference to the Chinese seismic design code
30 , the seismic action on buildings (represented by the seismic influential
factor ![]() ) was determined based on the response spectrum, as depicted in Figure
1 (with a damping ratio of 0.05). The seismic action was primarily affected
by the maximum seismic influential factor
) was determined based on the response spectrum, as depicted in Figure
1 (with a damping ratio of 0.05). The seismic action was primarily affected
by the maximum seismic influential factor ![]() , site characteristic period
, site characteristic period ![]() , and structural natural period
, and structural natural period ![]() . Among these factors,
. Among these factors, ![]() is solely determined by the design seismic acceleration
is solely determined by the design seismic acceleration
![]() , whereas
, whereas ![]() is significantly affected by the number of stories
is significantly affected by the number of stories ![]() . Therefore, for the sake of interest in seismic response in this study
(i.e., the IDRs), the key design conditions are seismic acceleration, site,
and height conditions 31 , which can be represented by
. Therefore, for the sake of interest in seismic response in this study
(i.e., the IDRs), the key design conditions are seismic acceleration, site,
and height conditions 31 , which can be represented by ![]() ,
, ![]() , and
, and ![]() , respectively. These design conditions were extracted from the collected
design drawings.
, respectively. These design conditions were extracted from the collected
design drawings.
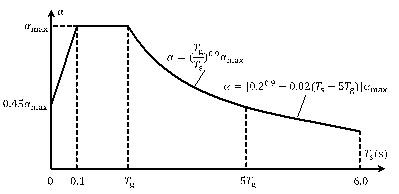
Figure 1 Response spectrum in Chinese seismic design code 30
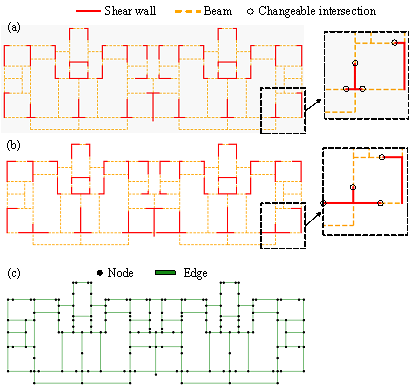
Figure 2 Typical shear-wall structure in the dataset. (a) Structural layout before data augmentation; (b) structural layout after data augmentation; (c) graph representation of structural layout.
To enhance the diversity of the dataset and thus improve
the generalization performance of data-driven models, a data augmentation
method encompassing two strategies was proposed. DA Strategy 1 (DA-S1) involves
modifying the structural design. First, the component intersections connecting
a pair of planar collinear shear wall and beam were designated as changeable
intersections. Subsequently, the changeable intersection was randomly relocated
to the original position of the collinear shear wall and beam. This alteration
changes the lengths of the shear walls and beams without affecting the shear
wall�Cbeam topological relationship. Figures 2(a) and (b) show the typical
structural designs before and after data augmentation, respectively. DA Strategy
2 (DA-S2) involves altering the design conditions by randomly generating seismic
acceleration, site, and height conditions to replace the original design conditions.
According to the Chinese seismic design code 30 , the allowable ranges for ![]() and
and ![]() are as follows:
are as follows: ![]() and
and ![]() . Additionally, buildings with fewer than five stories are predominantly
controlled by vertical loads, thus eliminating the necessity to adopt shear-wall
structures. Moreover, the Chinese design codes mandate special requirements
for buildings exceeding 100 m in height (equivalent to 33 stories with a typical
story height of 3 m). Therefore, shear-wall structures typically reach over
5 to 33 stories, i.e.,
. Additionally, buildings with fewer than five stories are predominantly
controlled by vertical loads, thus eliminating the necessity to adopt shear-wall
structures. Moreover, the Chinese design codes mandate special requirements
for buildings exceeding 100 m in height (equivalent to 33 stories with a typical
story height of 3 m). Therefore, shear-wall structures typically reach over
5 to 33 stories, i.e., ![]() .
.
Evidently, altering either the structural design or design conditions will affect the seismic response of the building. The following four scenarios were considered in data augmentation: 1) original dataset, 2) sole utilization of DA-S1, 3) sole utilization of DA-S2, and 4) the concurrent application of DA-S1 and DA-S2. Therefore, the shear-wall structure dataset was quadrupled from its original size, which resulted in 1132 samples. Note that data augmentation was performed only once in this study. However, theoretically, both DA-S1 and DA-S2 can be executed multiple times to yield larger datasets. Further augmentation of the dataset may yield enhanced performance of the data-driven model; however, this would inevitably increase training costs.
To automatically acquire the seismic responses of building structures,
a parametric modeling procedure was established, as depicted in Figure 3.
This procedure comprises five modules: parameter interpretation, structural
modeling, load definition, structural analysis, and result output. For each
shear-wall structure sample, a detailed 3D finite element model was established
and response spectrum analysis was performed. Details of the five modules
can be found in the previous work of the authors 32 . By adopting this parametric modeling procedure, the natural periods
and maximum IDRs under the design earthquakes were obtained for each sample.
According to the Chinese code, shear-wall structures are required to satisfy
![]() under design earthquakes 30 . Consequently, a few samples with highly unreasonable designs (i.e.,
under design earthquakes 30 . Consequently, a few samples with highly unreasonable designs (i.e.,
![]() ) were excluded from the dataset, which resulted in a final dataset
comprising 1056 shear-wall structure samples. Figure 4 illustrates the distribution
of the maximum IDRs in the dataset before and after data augmentation. Clearly,
the proposed data augmentation method not only increases the number of shear-wall
structure samples, but also expands the distribution range of seismic responses,
thus effectively enhancing the diversity of the dataset. Note that the overall
dimensions of the shear-wall structure samples are also diversified, whose
lengths range from 15 m to 70 m, widths range from 10 m to 30 m, and heights
range from 15 m to 99 m.
) were excluded from the dataset, which resulted in a final dataset
comprising 1056 shear-wall structure samples. Figure 4 illustrates the distribution
of the maximum IDRs in the dataset before and after data augmentation. Clearly,
the proposed data augmentation method not only increases the number of shear-wall
structure samples, but also expands the distribution range of seismic responses,
thus effectively enhancing the diversity of the dataset. Note that the overall
dimensions of the shear-wall structure samples are also diversified, whose
lengths range from 15 m to 70 m, widths range from 10 m to 30 m, and heights
range from 15 m to 99 m.
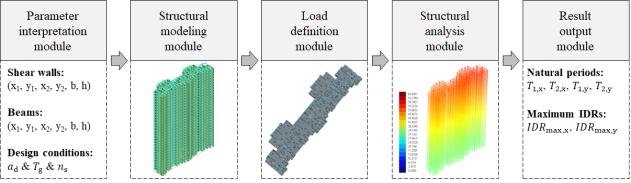
Figure 3 Parametric modeling procedure for automatic structural analysis
|
(a) Before data augmentation |
(b) After data augmentation |
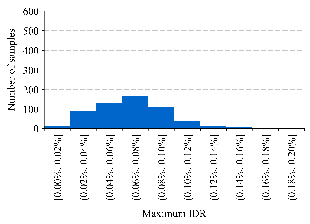
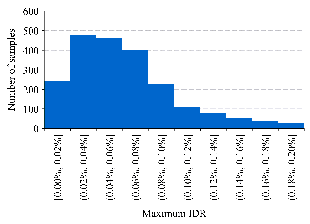
Figure 4 Comparison of seismic response distributions before and after data augmentation
The established shear-wall structure dataset is shown in Figure 5. The input data comprised the structural design and design conditions, whereas the label data (ground truth) refer to the seismic responses. To prevent information leakage, the dataset was partitioned into a training/validation set (80%, 845 samples) and a test set (20%, 211 samples) before data augmentation was conducted. Subsequently, the training/validation and test sets were utilized to train/validate and test the data-driven portion of the hybrid surrogate model, respectively, as detailed in Section 4.1.
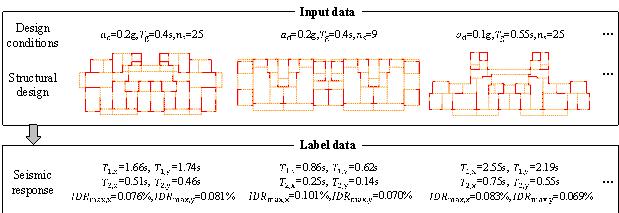
Figure 5 Established shear-wall structure dataset
4 Proposed hybrid surrogate model
A three-step computational process was proposed to estimate the maximum IDR of a building structure during earthquakes, as illustrated in Figure 6. Because the structural layout of typical shear-wall structures is generally regular, their lateral deformations can thus be decoupled along the X- and Y-directions, and torsional deformations can be negligible 33 . Hence, the following three steps are executed separately for the X- and Y-directions:
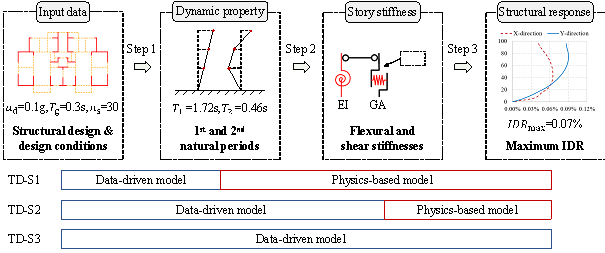
Figure 6 Three-step computational process to obtain the IDR and different task decomposition strategies
In Step 1, the dynamic properties of the building are determined, specifically the first and second natural periods. In Step 2, the story stiffnesses of the building are obtained, including both the flexural and shear stiffnesses. In Step 3, the seismic response of the building, i.e., the maximum IDR, is determined. At least three different task decomposition strategies are feasible to complete the three-step process through the cooperation of a data-driven model and a physics-based model, as illustrated in Figure 6.
Task decomposition strategy 1 (TD-S1): Step 1 is accomplished using a data-driven model (i.e., a graph neural network (GNN)) that predicts dynamic properties based on the input data. Steps 2 and 3 are executed using a physics-based model that determines the story stiffness from dynamic properties and establishes a flexural-shear model based on the story stiffness. Finally, a response spectrum analysis is performed via the flexural-shear model to obtain the IDR.
Task decomposition strategy 2 (TD-S2): The data-driven model (i.e., a GNN) addresses Steps 1 and 2 by directly predicting the story stiffness based on the input data while disregarding the intermediate dynamic properties. The physics-based model addressed Step 3 by building a flexural-shear model and performing a response spectrum analysis.
Task decomposition strategy 3 (TD-S3): The data-driven model (i.e., a GNN) accomplishes all three steps by directly predicting the IDRs based on the input data.
The merits and drawbacks of these three strategies are discussed in Section 5 based on numerical experiments. The remainder of this section describes the establishment of the GNN (Section 4.1), the flexural-shear model (Section 4.2), and the evolutionary algorithm required for Step 2 (Section 4.3).
4.1 Data-driven model��GNN
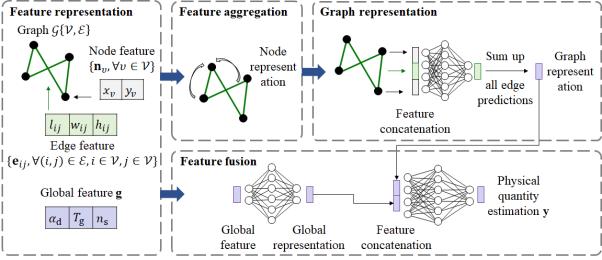
Figure 7 Architecture of Graph-GEN
To estimate the seismic responses of buildings, it is necessary to consider their structural layouts (topological information), component dimensions (geometric information), and design conditions (textual information). To fully integrate the assorted input data mentioned above, a recently proposed GNN named Graph-GEN 32 was employed. This approach incorporates feature representation, feature aggregation, graph representation, and feature fusion algorithms specifically designed for building structure-related tasks, as shown in Figure 7. Compared with other data-driven methods such as the ANN and CNN, Graph-GEN has proven to be a superior surrogate model for building structures 32 .
4.1.1 Feature representation
To accommodate the input format of a GNN, the structural design of shear-wall structures must be represented in the form of graphs. First, the intersections of the structural components (i.e., shear walls and beams) were represented as nodes and the structural components themselves were represented as edges. For example, the graph in Figure 2(c) represents the structural layout shown in Figure 2(a). This graph representation method exhibits a high level of scalability and can be similarly applied to other component types, such as columns and braces, which are also represented as edges. Additionally, the planar coordinates of the intersections were adopted as node features (two-dimensional vectors), and the geometric dimensions (i.e., length, width, and height) of the structural components were utilized as edge features (three-dimensional vectors), as listed in Table 1.
Design conditions significantly affect the seismic response
of buildings. The key design conditions elucidated in Section 3 (i.e., design
seismic acceleration ![]() , site characteristic period
, site characteristic period ![]() , and number of stories
, and number of stories ![]() ) are represented as a global feature (three-dimensional vector), as
presented in Table 1.
) are represented as a global feature (three-dimensional vector), as
presented in Table 1.
The physical quantities to be predicted are represented as vectors, as listed in Table 1. When employing TD-S1, a two-dimensional vector is used to represent the first and second natural periods. In the case of TD-S2, a two-dimensional vector represents the flexural and shear stiffnesses. When utilizing TD-S3, a one-dimensional vector is used to represent the maximum IDR. To facilitate the effective training of the GNN, the output data were normalized using Equation (1).
Table 1 Input and output variables of Graph-GEN
|
Variable |
Representation form |
|
|
Input |
Graph |
Node set |
|
Node features { |
|
|
|
Edge features { |
|
|
|
Global features
|
|
|
|
Output |
Vector representations
|
|
|
|
(1) |
where ![]() is the normalized label data;
is the normalized label data; ![]() is the original label data; and
is the original label data; and ![]() and
and ![]() denote the mean and standard deviation of all
denote the mean and standard deviation of all ![]() in the training/validation set, respectively.
in the training/validation set, respectively.
4.1.2 Output correction
Through its feature fusion mechanism, Graph-GEN can establish a mapping relationship between input and output data in a data-driven manner 32 . Because the physical quantities to be predicted (i.e., natural period, stiffness, and IDR) are inherently positive values, the loss function and output layer of Graph-GEN were modified to ensure that its predictions were 100% positive, as shown in Equations (2)�C(4).
|
|
(2) |
|
|
|
(3) |
|
|
|
(4) |
where ![]() is the loss function of Graph-GEN,
is the loss function of Graph-GEN, ![]() is the normalized prediction,
is the normalized prediction, ![]() is the prediction for application,
is the prediction for application, ![]() is the prediction directly output by Graph-GEN,
is the prediction directly output by Graph-GEN, ![]() is the mean square error loss function, and
is the mean square error loss function, and ![]() is the absolute function.
is the absolute function.
Although the aforementioned output correction strategy is simple, it is indispensable for the successful implementation of the proposed hybrid model. Purely data-driven models are susceptible to fundamental errors such as predicting natural period and stiffness as negative values. In such cases, physics-based models cannot proceed with the calculations, and the surrogate model cannot yield the desired IDR result. On the other hand, the output correction strategy proposed in this section can effectively resolve this issue.
4.2 Physics-based model��flexural-shear model
In this study, a physics-based flexural-shear model (as depicted in Figure 8) was used to accomplish two tasks. First, story stiffness is calculated based on dynamic properties (Section 4.2.1). Second, based on the story stiffness, an MDOF model is established and the IDR is obtained via response spectrum analysis (Section 4.2.2).
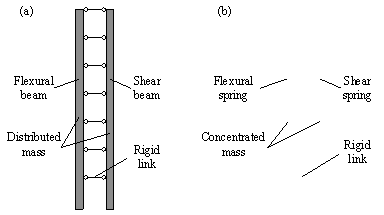
Figure 8 Flexural-shear models: (a) Continuum model; (b) MDOF model.
4.2.1 Stiffness inference based on continuum theory
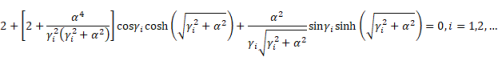
To calculate story stiffness based on dynamic properties, the continuum theory proposed by Miranda & Taghavi 33 was employed in this study. In their study, a building structure was represented as a flexural beam and a shear beam connected by rigid links, as illustrated in Figure 8(a). When the stiffness and mass of both the flexural and shear beams remain constant along the height, the relationship between natural periods and story stiffnesses can be derived, as shown in Equations (5) to (8) 33 .
|
|
(5) |
|
|
|
(6) |
where ![]() reflects the contribution of flexural and shear deformations,
as expressed in Equation (7).
reflects the contribution of flexural and shear deformations,
as expressed in Equation (7). ![]() represents a purely flexural model, whereas
represents a purely flexural model, whereas ![]() signifies a purely shear model.
signifies a purely shear model. ![]() and
and ![]() denote the first and second roots of Equation (6), respectively;
and
denote the first and second roots of Equation (6), respectively;
and ![]() and
and ![]() denote the first and second natural periods of the structure,
respectively.
denote the first and second natural periods of the structure,
respectively.
where H is the structural height; EI is the flexural stiffness of the flexural beam, as indicated in Equation (8); and GA is the shear stiffness of the shear beam.
|
|
(8) |
where ![]() denotes the mass per unit height of the structure.
denotes the mass per unit height of the structure.
Solving Equation (5) is computationally challenging; hence,
the relationship among ![]() ,
, ![]() , and
, and ![]() can be obtained in advance using a numerical method (e.g.,
the modified Powell method) 34 and saved locally, as depicted in Figure 9. In practical applications,
the following steps are undertaken: (1) For
can be obtained in advance using a numerical method (e.g.,
the modified Powell method) 34 and saved locally, as depicted in Figure 9. In practical applications,
the following steps are undertaken: (1) For ![]() , identify the corresponding
, identify the corresponding ![]() from Figure 9; (2) based on
from Figure 9; (2) based on ![]() , identify the corresponding
, identify the corresponding ![]() from Figure 9; (3) compute EI using Equation (8);
(4) calculate GA using Equation (7).
from Figure 9; (3) compute EI using Equation (8);
(4) calculate GA using Equation (7).
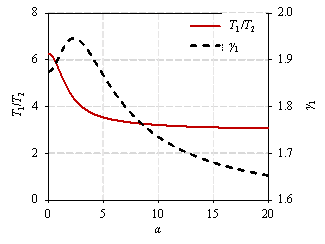
Figure 9 Relationship among ![]() ,
, ![]() , and
, and ![]()
4.2.2 Response spectrum analysis based on MDOF model
Although the continuum flexural-shear model described in Section 4.2.1 can provide a universal relationship between natural periods and story stiffness, this model is limited to elastic analysis and encounters constraints in engineering applications. To enhance the scalability of the hybrid model proposed here in this study, a discretized flexural-shear model, namely, the MDOF model, was employed to accomplish seismic analysis 11 . In this model, the mass of each story is concentrated at the location where the slab is positioned and connects each story with flexural and shear springs, as illustrated in Figure 8(b).
The mass matrix ![]() and stiffness matrix
and stiffness matrix ![]() for the i-th story (i.e., the i-th spring
element) of the MDOF model are expressed in Equations (9) and (10), respectively
22 . Disregarding the vertical displacement, each story (i.e., node) possesses
only two degrees of freedom (DOFs) (i.e., horizontal displacement and rotation),
thus resulting in four DOFs for each spring element.
for the i-th story (i.e., the i-th spring
element) of the MDOF model are expressed in Equations (9) and (10), respectively
22 . Disregarding the vertical displacement, each story (i.e., node) possesses
only two degrees of freedom (DOFs) (i.e., horizontal displacement and rotation),
thus resulting in four DOFs for each spring element.
|
|
(9) |
|
|
|
(10) |
where ![]() denotes the height of the i-th story; and
denotes the height of the i-th story; and ![]() and
and ![]() are the flexural and shear stiffnesses of the i-th
story, respectively, obtained using the method described in Section 4.2.1.
are the flexural and shear stiffnesses of the i-th
story, respectively, obtained using the method described in Section 4.2.1.
For the rotation, the mass matrix must account for the rotational inertial effects of the nodes. The static condensation method can be employed to combine stiffness matrix elements related to rotation with those related solely to the horizontal displacement, thus ensuring that the DOFs of the MDOF model align with the number of nodes 35 . Based on the aforementioned MDOF model, modal analysis can be conducted to obtain the natural periods and modal shapes. Further performing a response spectrum analysis yields the displacement responses under earthquakes, from which the maximum IDR can be calculated. The design spectrum shown in Figure 1, as specified in the Chinese code 30 , was adopted as the response spectrum.
Note that the performance of the MDOF model
has been validated on various building structures with 6, 15, 20, 31, and
42 stories 11,12,36,37 . When the
building has fewer stories, the shear deformation is dominant and
![]() becomes larger. When the building has more stories,
the flexural deformation is dominant and
becomes larger. When the building has more stories,
the flexural deformation is dominant and ![]() becomes smaller. Therefore, the MDOF model can properly
account for the flexural-shear interaction of shear-wall structures with 5
to 33 stories. Similarly, it is capable of simulating other structural systems
including frame structures, frame-shear wall structures, and frame-core tube
structures.
becomes smaller. Therefore, the MDOF model can properly
account for the flexural-shear interaction of shear-wall structures with 5
to 33 stories. Similarly, it is capable of simulating other structural systems
including frame structures, frame-shear wall structures, and frame-core tube
structures.
4.3 Evolutionary algorithm��simulated annealing
In Section 4.2.2, the story stiffnesses of the MDOF model were derived based on Equations (5)�C(8), under the assumption of constant stiffness and mass along the building height. However, this assumption is not applicable to MDOF models, where the masses are concentrated at the locations where the slabs are positioned. Therefore, the story stiffness must be adjusted such that the natural periods of the established MDOF model are aligned with the given natural periods that are used to infer the story stiffness in the first place.
By introducing a stiffness adjustment factor, ![]() , the story stiffness was adjusted to
, the story stiffness was adjusted to ![]() and
and ![]() . Subsequently, a simulated annealing algorithm was employed to identify
the optimal
. Subsequently, a simulated annealing algorithm was employed to identify
the optimal ![]() by minimizing the following objective function (Equation
11).
by minimizing the following objective function (Equation
11).
|
|
(11) |
where ![]() and
and ![]() represent the given first and second natural periods, respectively;
and
represent the given first and second natural periods, respectively;
and ![]() and
and ![]() denote the first and second natural periods obtained by
substituting
denote the first and second natural periods obtained by
substituting ![]() and
and ![]() into the MDOF model for trial calculations,
respectively.
into the MDOF model for trial calculations,
respectively.
The simulated annealing algorithm was implemented using
the Python library Scikit-opt 38 with the following parameter settings: initial value of the variable,
![]() ; variable range,
; variable range, ![]() ; maximum temperature,
; maximum temperature, ![]() ; minimum temperature,
; minimum temperature, ![]() ; and chain length,
; and chain length, ![]() . The effectiveness of the algorithm is discussed in Section 5.1.
. The effectiveness of the algorithm is discussed in Section 5.1.
5 Numerical experiments
Numerical experiments were conducted on a personal computer equipped with an NVIDIA GeForce RTX 3090 GPU and an Intel Core i7-10700K CPU@3.80 GHz. The parametric modeling procedure described in Section 3 was implemented using the structural design software YJK-GAMA 39 through secondary development. The Graph-GEN model, as detailed in Section 4.1, was implemented in the PyTorch deep-learning framework 40 and trained on the GPU. Graphs were created and processed using the Deep Graph Library 41 . Both the flexural-shear model presented in Section 4.2 and the evolutionary algorithm presented in Section 4.3 were implemented in Python, in which open-source libraries SciPy and Scikit-opt were utilized 34,38 .
The data-driven model, Graph-GEN, was subjected to training/validation and testing using the augmented training/validation set (845 samples) and test set (211 samples), respectively. The training/validation were performed via a five-fold cross-validation strategy. The Adam optimizer 42 was employed with a learning rate of 0.001 and a weight decay of 0.0001. The batch size was 8, and the training lasted 300 epochs. During the model prediction, the average IDR predictions of the five models from the five-fold cross-validation were used as the final results.
The widely adopted mean absolute percentage error (MAPE) was used as the evaluation metric for the hybrid surrogate model, which can be calculated using Equations (12) and (13).
|
|
(12) |
|
|
|
(13) |
where ![]() is the seismic response estimated using the surrogate model,
is the seismic response estimated using the surrogate model,
![]() is the actual (ground-truth) seismic response, and N
is the number of samples.
is the actual (ground-truth) seismic response, and N
is the number of samples.
As discussed in Section 4, the IDR estimation can be defined as a three-step process, during which errors might accumulate. Specifically, for TD-S1 and TD-S2, the natural periods or story stiffnesses are calculated or predicted, introducing a single-step error. Subsequently, the IDR is derived from these natural periods or story stiffnesses, thus resulting in accumulative errors. Therefore, single-step error analysis (Section 5.1) and accumulative error analysis (Section 5.2) are presented in the next subsections.
5.1 Single-step error analysis
Only TD-S1 fully executes the three-step process; therefore, TD-S1 is used as an example to examine the single-step errors of the three steps.
To validate the effectiveness of the GNN, the single-step errors of the natural periods predicted by the GNN (Step 1 in Figure 6) were investigated. Scenarios with and without output correction were compared, as shown in Table 2. The results indicate that for the scenario with output correction, the bidirectional average MAPEs for the first and second natural periods were 9.1%, and 9.2%, respectively, thus indicating its superiority over the scenario without output correction, with the bidirectional average MAPEs for the first and second natural periods both being 10.3%. Moreover, in the case without output correction, the natural periods were occasionally estimated as negative values, thus violating physical principles and preventing subsequent calculations by the physics-based model. Conversely, this issue was absent in the case with output correction.
Table 2 Single-step MAPE of GNN model on test set
|
Output correction |
Index |
Direction |
MAPE (%) |
Number of negative estimations |
|
Yes |
1st natural period |
X |
8.3 |
0 |
|
Y |
9.8 |
0 |
||
|
Averaged |
9.1 |
0 |
||
|
2nd natural period |
X |
8.1 |
0 |
|
|
Y |
10.2 |
0 |
||
|
Averaged |
9.2 |
0 |
||
|
No |
1st natural period |
X |
10.1 |
1 |
|
Y |
10.4 |
2 |
||
|
Averaged |
10.3 |
1.5 |
||
|
2nd natural period |
X |
10.1 |
1 |
|
|
Y |
10.5 |
0 |
||
|
Averaged |
10.3 |
0.5 |
Notably, for the case with output correction, the coefficients of determination (R2) for the first natural period in the X- and Y-directions were 0.96 and 0.97, respectively, which were significantly higher than those of a physics-based model recently proposed for the design optimization of shear-wall structures (0.68 and 0.76, respectively) 15 . Additionally, the linear correlation coefficient (r) for the largest natural period in both directions (i.e., the fundamental period) was 0.99, which was significantly higher than that of another recently proposed natural period predictive model for shear-wall structures (0.85) 43 . Hence, the estimation accuracy of the GNN adopted in this study is satisfactory, as shown in Table 3.
Table 3 Comparisons of natural period prediction accuracy of different methods
|
Index |
Proposed (TD-S1) |
Pizarro et al. 15 |
Wang et al. 43 |
|
1st natural period in X-direction |
R2=0.96 |
R2=0.68 |
N/A |
|
1st natural period in Y-direction |
R2=0.97 |
R2=0.76 |
N/A |
|
Fundamental period |
r=0.99 |
N/A |
r=0.85 |
Abbreviation: R2, coefficients of determination; r, linear correlation coefficient; N/A, not applicable.
Table 4 Single-step MAPE of MDOF model on test set
|
Scenario |
Index |
Direction |
MAPE (%) |
|
|
1st natural period |
X |
0.20 |
|
Y |
0.23 |
||
|
Averaged |
0.22 |
||
|
2nd natural period |
X |
2.00 |
|
|
Y |
1.52 |
||
|
Averaged |
1.76 |
||
|
|
Maximum IDR |
X |
4.98 |
|
Y |
9.09 |
||
|
Averaged |
7.04 |
To validate the effectiveness of the MDOF model and simulated
annealing algorithm, the single-step errors in Steps 2 and 3 in Figure 6 were
investigated under the assumption that the accurate natural periods
![]() , are provided.
, are provided. ![]() is calculated by detailed 3D finite element models in YJK
software, which is widely adopted in the building industry in China. Therefore,
is calculated by detailed 3D finite element models in YJK
software, which is widely adopted in the building industry in China. Therefore,
![]() is considered as ground truth. Note, however, that natural
periods must be predicted using the GNN when the proposed method is applied
to a new design case.
is considered as ground truth. Note, however, that natural
periods must be predicted using the GNN when the proposed method is applied
to a new design case.
In Step 2, the story stiffnesses were calculated based on
the real natural periods ![]() , and adjusted using the simulated annealing algorithm. The optimized
story stiffness values were used to establish an MDOF model. The natural periods
of the MDOF model,
, and adjusted using the simulated annealing algorithm. The optimized
story stiffness values were used to establish an MDOF model. The natural periods
of the MDOF model, ![]() , were obtained via modal analysis. The errors of
, were obtained via modal analysis. The errors of ![]() relative to
relative to ![]() are listed in Table 4, with the MAPEs of the first and
second natural periods ˂ 0.3%, and ˂ 2%. This indicates that the
MDOF model can effectively simulate the dynamic properties of a building structure.
are listed in Table 4, with the MAPEs of the first and
second natural periods ˂ 0.3%, and ˂ 2%. This indicates that the
MDOF model can effectively simulate the dynamic properties of a building structure.
In Step 3, the MDOF model performed response spectrum analysis
based on Step 2 to derive the maximum IDR. Table 4 presents the errors in
the single-step IDR calculation ( ![]() ) relative to the ground truth (
) relative to the ground truth ( ![]() ), i.e., a MAPE of ˂ 10%. This indicates that the MDOF model can
accurately calculate the seismic response of a building structure. Note that
the
), i.e., a MAPE of ˂ 10%. This indicates that the MDOF model can
accurately calculate the seismic response of a building structure. Note that
the ![]() is calculated using the detailed 3D finite element models
established through the parametric modeling procedure in Section 3.
is calculated using the detailed 3D finite element models
established through the parametric modeling procedure in Section 3.
5.2 Accumulative error analysis
In scenarios where the natural periods are unknown and required to be estimated, error accumulation occurs. This implies that the IDR error encompasses 1) period or stiffness errors and 2) errors in calculating the IDR based on a specified period or stiffness. Table 5 presents the accumulative errors in the test set for the three task decomposition strategies (TD-S1/2/3) described in Section 4. When a purely data-driven model (TD-S3) was used, the bidirectional average MAPE was 17.5%. Conversely, when the hybrid models were employed, TD-S1 and TD-S2 yielded the bidirectional average MAPE values of 14.8% and 12.4%, respectively. The errors of both TD-S1 and TD-S2 were lower than that of TD-S3, thereby demonstrating superior accuracy of the hybrid models over purely data-driven models. Furthermore, TD-S2 exhibited better estimation accuracy compared with TD-S1, thus indicating that utilizing story stiffness as an intermediate result between data-driven and physics-based models is more reasonable than using the natural period.
Table 5 Accumulative MAPE of different task decomposition strategies on test set
|
Direction |
TD-S1 |
TD-S2 |
TD-S3 |
|
X |
14.6% |
11.7% |
17.5% |
|
Y |
14.9% |
13.0% |
17.5% |
|
Averaged |
14.8% |
12.4% |
17.5% |
Figure 10 presents the specific estimation results of TD-S2 for the test set. Table 6 summaries the corresponding R2s. The R2 for the first natural period in the X- and Y-directions were 0.96 and 0.98, respectively. For the second natural period, the R2 values in the X- and Y-directions were both 0.97. Furthermore, the R2 values for the maximum IDR in the X- and Y-directions were both 0.93. These R2 values for the first natural periods (0.96 and 0.98) were significantly higher than those achieved using a recently proposed physics-based model (0.68 and 0.76) 15 , thus confirming the superiority of the hybrid model proposed herein.
Table 6 Coefficients of determination (R2) of estimation results
|
Index |
Direction |
Proposed (TD-S2) |
Pizarro et al. 15 |
|
1st natural period |
X |
0.96 |
0.68 |
|
Y |
0.98 |
0.76 |
|
|
2nd natural period |
X |
0.97 |
N/A |
|
Y |
0.97 |
N/A |
|
|
Maximum IDR |
X |
0.93 |
N/A |
|
Y |
0.93 |
N/A |
Abbreviation: N/A, not applicable.
|
(a) First natural period in X-direction |
(b) First natural period in Y-direction |
|
(c) Second natural period in X-direction |
(d) Second natural period in Y-direction |
|
(e) Maximum IDR in X-direction |
(f) Maximum IDR in Y-direction |
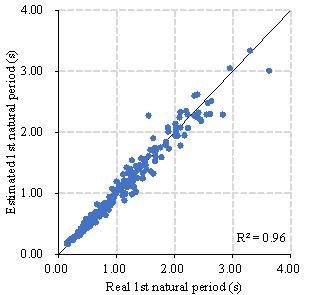
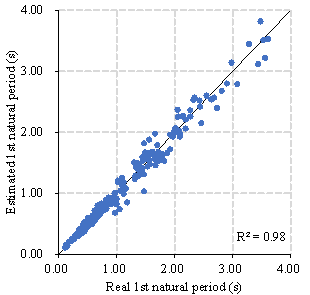
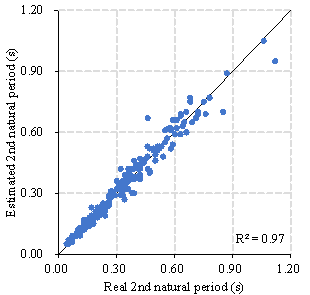
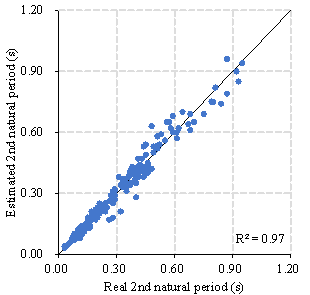
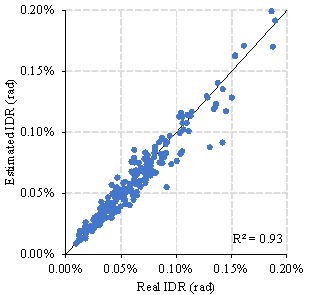
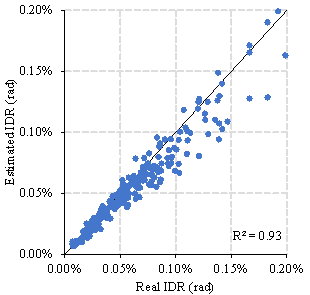
Figure 10 Estimation result of TD-S2 on test set
5.3 Comparison with existing surrogate models
The proposed hybrid surrogate model was compared with two
existing surrogate models to demonstrate its advantages. The first surrogate
model was a multilayer perceptron (MLP), which was also known as ANN and was
recently employed to estimate the maximum IDRs of frame-shear wall structures
21 . This method requires the manual selection of input features and involves
mapping the input feature vector to the output feature vector through several
fully connected layers. In this study, three fully connected layers were employed
and dropout and batch normalization strategies were applied. To satisfy the
design optimization requirements, nine input features were selected for the
MLP: the total length of the shear walls, average thickness of the shear walls,
total length of the beams, average height of the beams, story area, story
height, number of stories ( ![]() ), design seismic acceleration (
), design seismic acceleration ( ![]() ), and site characteristic period (
), and site characteristic period ( ![]() ).
).
The second surrogate model was ResNet18 44 , which was a classic and effective CNN utilized recently to evaluate
the maximum IDR of shear-wall structures 22 . In this method, the input data are three-dimensional matrices and
the model maps the input feature matrix to the output feature vector through
convolution operations and residual connections. To fulfill the design optimization
requirements, the structural design and design conditions of the shear-wall
structures were represented as a six-channel pixel image, i.e., a 512 �� 256
�� 6 input feature matrix 32 . For each channel (i.e., a 512 �� 256 matrix), nonzero matrix elements
indicate the presence of structural components, whereas zero matrix elements
indicate the opposite. For the six channels, the values of the nonzero matrix
elements represent the component width, component height, number of stories
( ![]() ), design seismic acceleration (
), design seismic acceleration ( ![]() ), site characteristic period (
), site characteristic period ( ![]() ), and scaling factor (used to scale the structural layout into a 512
�� 256 matrix).
), and scaling factor (used to scale the structural layout into a 512
�� 256 matrix).
The MLP and ResNet18 were trained, validated, and tested using the same dataset and training strategy as that for Graph-GEN. The estimation accuracies for the maximum IDR on the test set are listed in Table 7. The bidirectional average MAPEs of the MLP and ResNet18 were 48.3% and 28.1 %, respectively, which were significantly higher than that of the proposed method (12.4%). Note that the performance of the surrogate models is highly related to the feature representation approach. When the above-mentioned feature representation approaches are adopted, the MLP is less competitive in managing high-dimensional design variable inputs required for design optimization, and ResNet18 makes it difficult to effectively represent topological information (i.e., component connectivity) essential to structural design.
Table 7 MAPE of different surrogate models on test set
|
Direction |
MLP 21 |
ResNet18 22 |
Proposed (TD-S2) |
|
X |
45.7% |
26.0% |
11.7% |
|
Y |
50.8% |
30.1% |
13.0% |
|
Averaged |
48.3% |
28.1% |
12.4% |
5.4 Computational efficiency
Upon completing the training of Graph-GEN on the GPU, model inference can be conducted using the CPU, which entails low hardware requirements. Results from the test set indicate that TD-S2 (comprising both data-driven and physics-based models) required an average of 0.56 s for a single estimation. Notably, the inference process involved five Graph-GEN models obtained from the five-fold cross-validation. Although existing surrogate models (MLP requires 0.04s and ResNet18 requires 0.73s) demonstrate a computational efficiency higher than or close to the proposed TD-S2, their prediction accuracies are less competitive whereas the efficiency of TD-S2 can satisfactorily meet the demand of design optimization.
5.5 Generalization performance
Although the process of dataset generation
and model training can be somewhat time-consuming, the trained Graph-GEN model
is generalizable to many various design schemes (15 m �� length �� 70 m, 10 m �� width �� 30 m, 15 m �� height �� 99 m) and seismic actions (0.05 g �� ![]() �� 0.3 g, 0.25 s ��
�� 0.3 g, 0.25 s �� ![]() �� 0.9 s), and can be applied to numerous complex
shear-wall structure design tasks. Consequently, the proposed method demonstrates
efficiency advantages for long-term applications. Moreover, given the time
constraints typically associated with design tasks, the proposed method is
capable of completing the time-consuming processes in advance, helping to
meet project deadlines effectively. This has significant practical importance.
�� 0.9 s), and can be applied to numerous complex
shear-wall structure design tasks. Consequently, the proposed method demonstrates
efficiency advantages for long-term applications. Moreover, given the time
constraints typically associated with design tasks, the proposed method is
capable of completing the time-consuming processes in advance, helping to
meet project deadlines effectively. This has significant practical importance.
Purely physics-based models (e.g., MDOF model) have a better generalization performance. However, if only the MDOF model is used, parameter calibration is challenging due to a lack of information. Data-driven models extract information from datasets and predict story stiffness or natural period so that these parameters do not need manual calibration.
6 Case study
To validate the effectiveness of the proposed method visually, a hybrid surrogate model was applied to a residential building project that adopted a shear-wall structure. During the design optimization of shear-wall structures, engineers may employ heuristic algorithms to generate numerous design schemes. The seismic performance of these schemes must be evaluated to obtain an optimal design. In the case study, the proposed hybrid surrogate model and a typically used FE software, YJK 39 , were utilized to evaluate the maximum IDR under design earthquakes for the two selected design schemes of the project, thus providing reference for design optimization.
The residential building comprises 10 stories, with
![]() = 0.2 g and
= 0.2 g and ![]() = 0.55 s. The structural layouts of Schemes A and B are
shown in Figures 11(a) and (c), respectively, with Scheme B featuring longer
shear walls at highlighted positions than Scheme A. By employing the parametric
modeling procedure depicted in Figure 3, refined FE models of Schemes A and
B were established in YJK, as shown in Figures 11(b) and (d), respectively.
= 0.55 s. The structural layouts of Schemes A and B are
shown in Figures 11(a) and (c), respectively, with Scheme B featuring longer
shear walls at highlighted positions than Scheme A. By employing the parametric
modeling procedure depicted in Figure 3, refined FE models of Schemes A and
B were established in YJK, as shown in Figures 11(b) and (d), respectively.

Figure 11 Shear-wall structure project. (a) Structural layout of Scheme A; (b) refined FE model of Scheme A; (c) structural layout of Scheme B; (d) refined FE model of Scheme B.
Table 8 Comparisons of estimation result and time consumption
|
Scheme |
Method |
X-direction IDR |
Y-direction IDR |
Time |
|
Scheme A |
YJK |
0.105% |
0.109% |
56.2 s |
|
Proposed (TD-S2) |
0.112% |
0.104% |
0.57 s |
|
|
Percentage difference |
6.9% |
-4.37% |
-99.0% |
|
|
Scheme B |
YJK |
0.080% |
0.084% |
56.4 s |
|
Proposed (TD-S2) |
0.079% |
0.080% |
0.57 s |
|
|
Percentage difference |
-0.3% |
-5.25% |
-99.0% |
The maximum IDRs for the two design schemes were computed
using both YJK and the proposed hybrid surrogate models (TD-S2). The estimation
results, along with the required computational time, are listed in Table 8.
The errors of the surrogate model were within 7% compared to those of the
refined FE model, thus signifying its high level of accuracy. Furthermore,
the surrogate model accurately distinguished that Scheme A did not satisfy
the code requirements ( ![]() ), whereas Scheme B satisfied the requirements; hence, it passed the
compliance verification prerequisite for design optimization. The surrogate
model completed the estimation in 0.57 s, which was approximately 100 times
faster than that (i.e., 56.3 s) required by YJK, thus substantially enhancing
the evaluation efficiency.
), whereas Scheme B satisfied the requirements; hence, it passed the
compliance verification prerequisite for design optimization. The surrogate
model completed the estimation in 0.57 s, which was approximately 100 times
faster than that (i.e., 56.3 s) required by YJK, thus substantially enhancing
the evaluation efficiency.
7 Conclusions
In this study, a rapid estimation method for building seismic responses that combines both physics and data was proposed. Its application was demonstrated based on the outcomes of the IDR estimations of shear-wall structures. The following key innovations were highlighted: First, a data augmentation method and parametric modeling procedure were proposed to establish a dataset comprising 1056 samples of shear-wall structures. Second, a task decomposition strategy was proposed to accomplish a rational combination of a data-driven GNN and a physics-based flexural-shear model. Third, an output correction strategy was introduced to prevent the GNN from generating fundamental errors. The following conclusions were inferred from this study:
(1) The proposed data augmentation method significantly increased the number of samples for shear-wall structures and expanded the distribution range of seismic responses by randomly altering the structural designs and design conditions, thereby enhancing the dataset diversity.
(2) The proposed task decomposition strategy, which utilizes story stiffness as an intermediate result between data-driven and physics-based models, substantially improved the estimation accuracy compared with single-model approaches. The bidirectional average MAPE of the maximum IDR was 12.4%, which surpassed that of the purely data-driven model at 17.5%. Its R2 values for the first natural periods in the X- and Y-directions were 0.96 and 0.98, respectively, which were better than those of the purely physics-based model (0.68 and 0.76).
(3) The proposed output correction strategy, which involves modifications to the output layer and loss function of the GNN, improved the estimation accuracy of the GNN. Additionally, it ensured that the physical quantities predicted by the data-driven model were greater than zero such that the inputs of the subsequent physics-based model remained within the reasonable bounds.
(4) The case study revealed that the proposed hybrid surrogate model exhibited ~100 times improvement in terms of the estimation efficiency compared with the conventional FE software. The errors of the estimated maximum IDR were within ��7%, thus enabling an accurate judgment regarding the compliance of the design schemes with code requirements.
Acknowledgment
Data availability statement
The proposed hybrid surrogate model (including the trained GNN model) is deployed on an online server and an application programming interface (API) is developed to facilitate its application. The API, necessary document, and some data for demonstration can be found in the GitHub repository (https://github.com/YifanFEI/hybrid-drift-model).
Reference
1. Alizadeh R, Allen JK, Mistree F. Managing computational complexity using surrogate models: a critical review. Res Eng Design. 2020;31(3):275-298.
2. Kudela J, Matousek R. Recent advances and applications of surrogate models for finite element method computations: a review. Soft Comput. 2022;26(24):13709-13733.
3. Orhan T, Taşkın K. Automated topology design of high-rise diagrid buildings by genetic algorithm optimization. Struct Des Tall Spec Build. 2021;30(9):e1853.
4. Zhou X, Wang L, Liu J, Cheng G, Chen D, Yu P. Automated structural design of shear wall structures based on modified genetic algorithm and prior knowledge. Automat Constr. 2022;139:104318.
5. Stork J, Friese M, Zaefferer M, et al. Open issues in surrogate-assisted optimization. In: Bartz-Beielstein T, Filipič B, Korošec P, Talbi EG, eds. High-Performance Simulation-Based Optimization. Studies in Computational Intelligence. Springer International Publishing; 2020:225-244.
6. Ratto M, Castelletti A, Pagano A. Emulation techniques for the reduction and sensitivity analysis of complex environmental models. Environ Model Softw. 2012;34:1-4.
7. Dey S, Mukhopadhyay T, Adhikari S. Metamodel based high-fidelity stochastic analysis of composite laminates: a concise review with critical comparative assessment. Compos Struct. 2017;171:227-250.
9. Lou H, Gao B, Jin F, Wan Y, Wang Y. Shear wall layout optimization strategy for high-rise buildings based on conceptual design and data-driven tabu search. Comput Struct. 2021;250:106546.
10. Miranda E, Reyes CJ. Approximate lateral drift demands in multistory buildings with nonuniform stiffness. J Struct Eng. 2002;128(7):840-849.
12. Xiong C, Lu X, Guan H, Xu Z. A nonlinear computational model for regional seismic simulation of tall buildings. Bull Earthquake Eng. 2016;14(4):1047-1069.
13. Cheng MH, Heaton TH. Simulating building motions using ratios of the building��s natural frequencies and a Timoshenko beam model. Earthq Spectra. 2015;31(1):403-420.
14. Shan J, Zhuang C, Loong CN. Parametric identification of Timoshenko-beam model for shear-wall structures using monitoring data. Mech Syst Signal Process. 2023;189:110100.
15. Pizarro PN, Massone LM, Rojas FR. Simplified shear wall building model for design optimization. J Build Eng. 2023;76:107368.
16. Zaker Esteghamati M, Flint MM. Developing data-driven surrogate models for holistic performance-based assessment of mid-rise RC frame buildings at early design. Eng Struct. 2021;245:112971.
17. Kyprioti AP, Taflanidis AA. Kriging metamodeling for seismic response distribution estimation. Earthq Eng Struct Dyn. 2021;50(13):3550-3576.
18. Zhong K, Navarro JG, Govindjee S, Deierlein GG. Surrogate modeling of structural seismic response using probabilistic learning on manifolds. Earthq Eng Struct Dyn. 2023;52(8):2407-2428.
19. Demertzis K, Kostinakis K, Morfidis K, Iliadis L. An interpretable machine learning method for the prediction of R/C buildings�� seismic response. J Build Eng. 2023;63:105493.
20. Junda E, M��laga-Chuquitaype C, Chawgien K. Interpretable machine learning models for the estimation of seismic drifts in CLT buildings. J Build Eng. 2023;70:106365.
21. Dang-Vu H, Nguyen QD, Chung T, Shin J, Lee K. Frequency-based data-driven surrogate model for efficient prediction of irregular structure��s seismic responses. J Earthq Eng. 2022;26(14):7319-7336.
23. Xu Z, Chen J, Shen J, Xiang M. Recursive long short-term memory network for predicting nonlinear structural seismic response. Eng Struct. 2022;250:113406.
25. Chou JY, Liu CY, Chang CM. Story drift and damage level estimation of buildings using relative acceleration responses with multi-target deep learning models under seismic excitation. Earthq Eng Struct Dyn. 2023;52(8):2554-2571.
26. Wang R, Yu R. Physics-guided deep learning for dynamical systems: a survey. Published online February 28, 2023. doi:10.48550/arXiv.2107.01272
28. Xu Y, Fei Y, Huang Y, Tian Y, Lu X. Advanced corrective training strategy for surrogating complex hysteretic behavior. Struct. 2022;41:1792-1803.
29. Mokhtari F, Imanpour A. Hybrid data-driven and physics-based simulation technique for seismic analysis of steel structural systems. Comput Struct. 2024;295:107286.
30. MOHURD. Code for the Seismic Design of Buildings (GB 50011-2010). China Architecture & Building Press; 2016.
31. Zhao P, Fei Y, Huang Y, Feng Y, Liao W, Lu X. Design-condition-informed shear wall layout design based on graph neural networks. Adv Eng Inform. 2023;58:102190.
33. Miranda E, Taghavi S. Approximate floor acceleration demands in multistory buildings. I: formulation. J Struct Eng. 2005;131(2):203-211.
34. SciPy. SciPy Documentation. 2023. https://docs.scipy.org/doc/scipy/reference/generated/scipy.optimize.root.html
35. Pan P, Zhang Y, Ye L. Theory and Method of Seismic Design for Building Structures. Science Press; 2017.
37. Lai X, He Z, Wu Y. Elastic inter-story drift seismic demand estimate of super high-rise buildings using coupled flexural-shear model with mass and stiffness non-uniformities. Eng Struct. 2021;226:111378.
38. Scikit-opt. Scikit-Opt Documentation. 2023. https://scikit-opt.github.io/scikit-opt/#/en/README
39. YJK. YJK-GAMA secondary development guide. 2023. https://gitee.com/NonStructure/yjk-gama-secondary-development/
40. PyTorch. PyTorch documentation. 2023. https://pytorch.org/docs/stable/index.html
41. DGL. Deep Graph Library Tutorials and Documentation. 2023. https://docs.dgl.ai/
42. Kingma DP, Ba J. Adam: a method for stochastic optimization. In: Proceedings of the 3rd International Conference on Learning Representations, San Diego, California, USA. 2017.
43. Wang Z, Chen J, Shen J. Multi-factor and multi-level predictive models of building natural period. Eng Struct. 2021;242:112622.
44. He K, Zhang X, Ren S, Sun J. Deep residual learning for image recognition. In: 2016 IEEE Conference on Computer Vision and Pattern Recognition (CVPR), Las Vegas, NV. 2016:770-778.