1 Introduction
Shear wall structures are an essential type of high-rise building [1]. However, despite the accumulation of a substantial amount of design data in the field of structural design, effectively harnessing and learning from these data has been challenging owing to limitations in digitalization, automation, and intelligence. Consequently, the efficient transfer of accumulated data and experience has been hindered, posing obstacles to further improving the design efficiency. With the rapid development of artificial intelligence (AI), which can learn from existing data and knowledge, intelligent design has the potential to address these challenges and facilitate the transformation of engineering construction towards greater intelligence [2].
Generative artificial intelligence (AI) technology is an essential direction in deep learning, and designers can master design capabilities by learning existing structural design data and experience knowledge [3]. Among them, GANs and graph generative networks (GNN) with powerful generative capabilities can achieve robust end-to-end predictions. For instance, (1) Liao et al. [4], Pizarro et al. [5-6], Fei et al. [7], and Fu et al. [8] proposed intelligent design methods based on a GAN and convolutional neural networks for shear walls and steel frame brace structures. Design conditions are integrated into the input to overcome the limitations of existing methods that struggle to satisfy the constraints of both design specifications and architectural drawings [9-10]. Furthermore, Fei et al. [11], Liao et al. [12], and Lu et al. [13] embedded domain knowledge and physical rules into the generative model to enhance the effectiveness of the structural design. (2) Zhao et al. [14-16] and Chang et al. [17] employed a GNN to design and optimize shear walls and frame structures. In addition to research on structural layout design, numerous scholars have employed machine learning or deep learning algorithms for the design and optimization of structural cross-sectional size, including those of shear walls. Feng et al. [18] proposed an intelligent design method for shear wall cross-sectional size based on GANs. Lou et al. [19-20], Choi et al. [21], and Daryan et al. [22] utilized optimization algorithms to optimize component cross-sectional size. Furthermore, Pizarro et al. [23] have conducted research on AI-driven floor plan analysis and recognition, yielding promising outcomes. These advancements enable the expansion of the available dataset for model training in intelligent design through the digitization and reutilization of non-CAD drawings. Consequently, considerable progress has been achieved in the field of AI-based design and optimization for structures. However, due to the complexity of simultaneously designing shear wall layout and size, this study focuses on optimizing the intelligent design method for shear wall layout. Research on intelligent design for shear wall layout and steel-braced frame arrangement utilizing GANs has advanced rapidly. It enables the generation of corresponding structural designs based on architectural drawings, which is beneficial for improving the design efficiency of engineers and promoting the reuse of accumulated design data and experience [3].
This series of studies still has some issues that can be further improved, such as the most commonly used approach for representing architectural and structural elements is based on the RGB image feature space. However, the RGB image-based representation approach for architectural and structural design features struggles to reasonably reflect the correlations and differences between components, posing challenges for deep learning algorithms to comprehend and learn. Specifically, the intelligent design of shear wall structures typically processes computer-aided design (CAD) drawings into an RGB image feature space, where red, green, and blue represent shear walls, windows, and doors, respectively. Although this method extracts vital design components and structural layout information [4], it also introduces unreasonable prior information. Artificially stipulated RGB colors impose a potentially unreasonable elemental feature distance relationship, as illustrated in Section 2.1.1. Moreover, it captures only a subset of the features in drawings and inadequately conveys comprehensive prior knowledge of the design, such as seismic design intensity and structural height.
In cases of data scarcity, complex tasks, or high demands for model interpretability, feature-space-based image analysis methods can effectively facilitate the rapid and stable learning of models on input data [24]. The feature space refers to a multidimensional space consisting of features extracted from data, where each dimension typically corresponds to a feature that helps describe, differentiate, or classify the attributes or characteristics of a sample [25]. In machine learning, it is common to map images to a higher-dimensional feature space to better capture information and enable machine-learning algorithms to learn and classify more effectively [26-27]. Therefore, for the intelligent design of shear wall structures, exploring a more accurate feature space-based data representation method is essential.
Furthermore, existing intelligent design methods for shear wall structures can achieve overall consistency with engineer-designed structures; however, they are weaker in terms of local details, such as the spatial relationship between shear walls and partition walls [28]. Yang et al. [29], Yeh et al. [30], and Pathak et al. [31] augmented GAN with texture information, iterations, and context encoders to better adapt to image inpainting tasks to address the difficulty of generating local image details. Global and local discriminators were introduced to generate images that were consistent locally and globally [32]. Yu and Koltun [33] developed a local detail loss function by extracting the prediction results with positioning masks for different structural components. Therefore, this study refers to the existing methods and aims to further enhance the quality of local details in AI-generated shear wall designs using a local discriminator and positioning masks.
To address the challenges associated with the intelligent design of shear wall structures, with a specific emphasis on enhancing data feature representation and improving the local structural design, this study introduces the following innovative approaches:
(1) A more accurate component-based feature space representation method is proposed. It utilizes Boolean tensors to represent key design components and their corresponding positional information to address the issue of introducing unreasonable prior information caused by existing methods that represent drawings in the RGB color space.
(2) Feature masks were incorporated during model training to concentrate the optimization of the generative model in the key areas, enhancing the feature density. This approach addressed the challenge of extracting sparse effective data features in drawings where key target regions occupy a small proportion.
(3) The GAN was extended by introducing global and local discriminators. The global discriminator guided the generator to reasonably arrange the shear walls globally. Simultaneously, the local discriminator assists in focusing on the relative spatial relationship between the shear and partition walls at local positions.
The proposed innovative methods are described in detail in Section 2. Section 3 presents performance analysis experiments on the proposed methods and discusses their impact on the structural design generated by the model. Section 4 presents typical case studies to evaluate the effectiveness of these methods. Finally, Section 5 presents the conclusions of this study.
2 Methodology
2.1 Data representation and dataset construction
Figure 1 illustrates the proposed methods for component-based feature space representation and augmentation of drawings, which aim to represent drawings and design conditions effectively and expand the limited dataset simultaneously. First, the critical design components are extracted along with their corresponding positional information from the CAD drawings and mapped to the component-based feature space, as illustrated in Figure 1(a). The design conditions are then encoded and mapped to the feature space, as Figure 1(b) illustrates. The input tensors, mask tensors, and ground truth tensors composed of different feature tensors are obtained. Subsequently, the feature tensors are augmented to ensure the model's robustness and generalization, as illustrated in Figure 1(c). Table 1 lists the symbolic representations of all tensors used in this study.
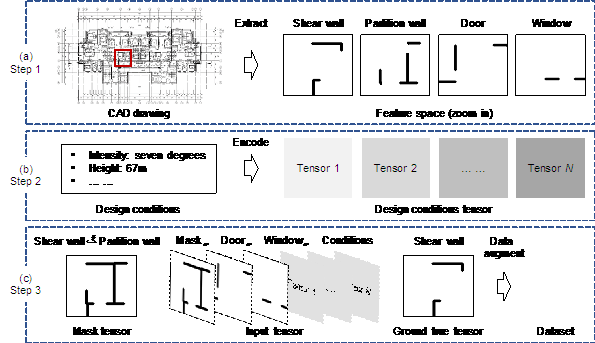
Figure 1 Method of feature space-based drawings representation and dataset construction
Table 1 Symbolic representations of component feature and design conditions tensors
|
Symbol |
Description |
|
|
Partition wall
feature tensor (2D). Where the location has a nonstructural partition
wall, the value of |
|
|
Shear wall feature
tensor (2D). Where the location has a structural shear wall, the value
of |
|
|
Door feature tensor
(2D). Where the location has an outdoor gate, the value of |
|
|
Window feature
tensor (2D). Where the location has an indoor window, the value of
|
|
|
Design condition tensor (3D). The tensor encodes the design conditions of the structure, including building height and seismic design intensity. |
|
|
Mask tensor (2D).
The tensor is the union of the |
|
|
Generator input
tensor (3D). The tensor concatenates |
|
|
Global discriminator input tensor (3D). |
|
|
Local discriminator input tensor (3D). |
|
|
Generator output tensor (2D). The tensor is the single-channel shear wall layout tensor outputted by the generator. |
|
|
Shear wall layout
tensor (2D). The tensor is obtained by applying |
|
|
Discriminator output tensor (1D). The tensor includes the influence of global discriminator and local discriminator. |
2.1.1 Feature space-based drawings representation
As a part of the data preprocessing in the existing intelligent design of shear wall structures, CAD drawings are commonly semantically mapped to the RGB color space by encoding various components with different RGB values. For instance, Liao et al. [4] reported that red (RGB=(255, 0, 0)), grey (RGB=(132, 132, 132)), green (RGB=(0, 255, 0)), and blue (RGB=(0, 0, 255)) represent the structural shear wall, nonstructural partition wall, indoor window, and outdoor gate, respectively. Although this approach extracts the structural components and spatial information from drawings, it introduces unreasonable prior information. Specifically, the generative model needs to predict the layout of the shear walls, that is, to determine whether a pixel's color in a structural drawing is red, using RGB-based feature representation. However, in the RGB color space, the Euclidean distance between the door and the partition wall was approximately 129.07. In contrast, the distance between the door and the shear wall was approximately 208.01, as shown in Figure 2. This resulted in the shear wall component being farther from the partition wall than from the door, potentially causing the generative model to make inaccurate predictions regarding their relationships. Therefore, it is necessary to establish a more precise representation method for CAD drawings to ensure an accurate description of the spatial relationship between shear walls and other components.
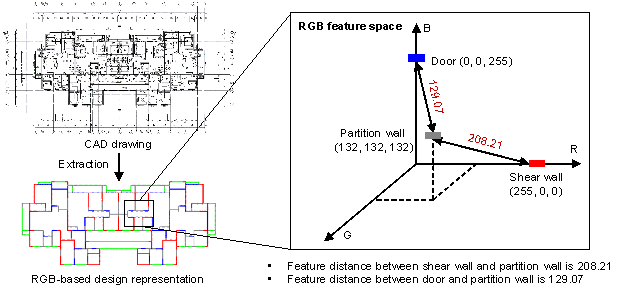
Figure 2 Example of structure component encoding and distance metric in RGB color space
This study proposes a more accurate component-based feature space representation method for CAD drawings that maps the positional information of each component in architectural and structural drawings to binary second-order component feature tensors. As illustrated in Figure 1(a), these feature tensors indicate whether the corresponding component occupies a specific position in a drawing. If a component is present, the value at that position in the corresponding feature tensor is 1 (black); otherwise, it is 0 (white). Symbolic representations of the second-order feature tensors for each component are presented in Table 1. This method allows the network to accurately capture the spatial relationships of each component in the drawings, thereby improving compatibility and rendering it suitable for various types of drawings.
The design conditions were encoded as computationally processable tensors to integrate the predictions for different design conditions into the same model. These tensors and second-order component feature tensors were input into the model to generate a structural layout that simultaneously satisfied the design specifications and architectural drawings. Specifically, ordered and continuous design conditions such as structural height were normalized and then replicated to expand the dimension to a condition tensor of the same size as the component feature tensors. Unordered and discrete design conditions, such as material type and seismic design intensity, were mapped to sparse tensors and replicated to expand the dimensions, resulting in condition tensors of the same size as the component feature tensors. Considering the design conditions available from the data of this study and the analysis by Lu et al. [13], the seismic design intensity and structural height were considered as parameters that significantly influenced the seismic response of the structures. Therefore, the design condition tensors used in this study encode the seismic design intensity and structural height, as listed in Table 1.
All feature vectors are initialized with the first two dimensions set to 256 �� 256. Specifically, data processing was undertaken to produce a 256 �� 256 tensor, which is padded with five blank tensor values around its perimeter to maximize the size of the drawings within. After processing, the scale factor��indicating how many pixels correspond to a certain area in meters��ranges approximately from 0.01 to 0.05. This implies that one tensor value equates to a physical length of 100 to 200 mm for the shear walls. Typically, the modulus of shear wall length adheres to increments of 100 to 200 mm [34]. Consequently, a single tensor value in the feature vector can adequately represent variations in the length of a shear wall, thereby minimizing information loss.
2.1.2 Construction of feature masks and dataset
Owing to the limited potential positions for shear walls compared with the total number of pixels in an image, the model may struggle to precisely locate the critical generation positions of shear walls, thereby excessively focusing on areas irrelevant to the task. Therefore, this study introduces a mask tensor to accurately locate the potential positions of shear walls in architectural drawings, concentrating the optimization of the generative model on the key areas to enhance the feature density. Furthermore, to prevent the shear walls generated by the model from encroaching on the functional and aesthetic requirements of the architecture, this study limits them from exceeding the range of the mask. The mask tensor was obtained using Equation (1):
|
|
(1) |
where ![]() denotes the union of the partition wall feature tensor
and the shear wall feature tensor.
denotes the union of the partition wall feature tensor
and the shear wall feature tensor.
Based on the component-based feature space representation of drawings and design conditions, the input tensor of the generator (xG), the input tensor of the global discriminator(xDG), and the input tensor of the local discriminator (xDL) are respectively expressed in Equations (2)‒(5):
|
|
(2) |
|
|
(3) |
|
|
(4) |
|
|
(5) |
where ![]() denotes the concatenate operator,
denotes the concatenate operator, ![]() denotes the Hadamard product operator. The component-based
feature space representation of drawings uses 0-1 binary tensors to represent
the layout of the shear walls. In contrast, the shear wall feature tensors
generated by the generator are continuous values ranging from zero to one.
In addition, shear walls can only be arranged within the scope of the partition
walls. Therefore, SG is set to 1 where G(xG)
is greater than 0.5, located within the feature mask, and the rest are set
to 0 to represent the shear wall layout generated by the model.
denotes the Hadamard product operator. The component-based
feature space representation of drawings uses 0-1 binary tensors to represent
the layout of the shear walls. In contrast, the shear wall feature tensors
generated by the generator are continuous values ranging from zero to one.
In addition, shear walls can only be arranged within the scope of the partition
walls. Therefore, SG is set to 1 where G(xG)
is greater than 0.5, located within the feature mask, and the rest are set
to 0 to represent the shear wall layout generated by the model.
2.1.3 Description and augmentation of dataset
This study collected 338 pairs of architectural�Cstructural designs from architectural design and research institutes in the nearby region to create a dataset, which was then divided into training, validation, and test sets. Typically, the design patterns of the same institute exhibit similarities. Therefore, to assess the generalizability of the model, this study introduced an additional test set comprising 18 pairs of architectural and structural designs from different institutes. Owing to the limited data available for this study, a larger portion was allocated to training, as shown in Table 2.
Table 2 Dataset for GAN
|
Dataset |
Number |
|
Train |
300 |
|
Validation |
20 |
|
Test A (the same design institute) |
18 |
|
Test B (different design institutes) |
18 |
Given the relatively small size of the dataset compared to the number of model parameters, this study employed data augmentation to augment the dataset, primarily involving horizontal flipping, vertical flipping, and translation transformations. Consequently, a dataset containing 62720 (= 320 �� 4 �� 7 �� 7) was obtained.
2.2 GANs with dual discriminators based on feature masks
To increase the density of data features and enhance the network's understanding of the relative spatial relationship between shear and partition walls, GANs with dual discriminators based on feature masks have been proposed. The network model is elaborated in Sections 2.2.1 and 2.2.2, which introduce the model's training process and the corresponding loss functions and hyperparameter settings.
2.2.1 Model architecture of GANs
The architecture of the GANs with dual discriminators based on feature masks is shown in Figure 3. Appendix A provides an overview of these networks. The generator adopted an encoder-decoder architecture. Because the features of the input data in the intelligent design task of shear wall structures are relatively simple, the encoder reduces the resolution by only two times without employing multiple downsamplings. In addition, dilated convolution layers were utilized to enhance the receptive field of the network and capture a broader range of contextual information while maintaining computational efficiency [33]. Additionally, it is important to note that the shear wall generated by the generator will be constrained within the input architectural wall area by the mask tensor.
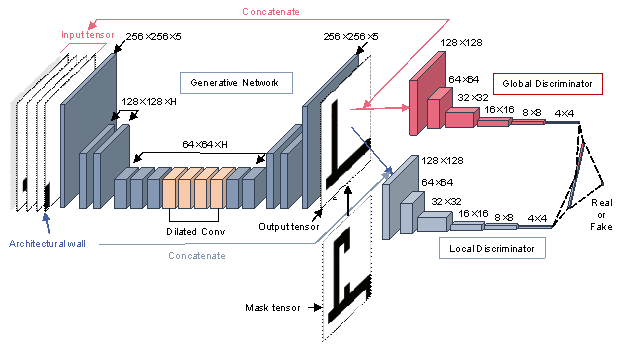
Figure 3 The architecture of GANs with dual discriminators based on feature masks
Existing intelligent design methods for shear wall structures can achieve overall consistency with engineers�� designs. However, they struggle to match the relative spatial relationship between shear walls and partition walls at local positions precisely. Therefore, based on the GAN, two CNN-based discriminators were introduced�Ca global discriminator and a local discriminator [32]. Both discriminators share the same architecture, the only difference being their input tensors. All convolutional layers employed 5 �� 5 convolutional kernels with 2 �� 2 strides, reducing the input resolution while increasing the feature quantity [32]. To focus the attention of discriminators on the key area, only the subset of the generator's output tensors (G(xG)) that are within the feature mask and have results greater than 0.5 are retained (SG) when feeding them into the discriminators. The input for the global discriminator is expressed in Equation (4), which concatenates SG with all input tensors, guiding the generator globally on the layout of the shear walls to ensure structural strength and stability. The input for the local discriminator is expressed in Equation (5), concatenating only the partition wall feature tensor with SG, which helps the generator focus on the relative spatial relationship between the shear and partition walls at local positions. The network's understanding of reasonable shear wall layouts within the overall structure is enhanced by employing global and local discriminators.
2.2.2 Loss function and model training
To ensure training stability, the training process is divided into three stages: 1) the generator network is trained for EG epochs using the mean squared error (MSE) loss from Equation (6); 2) the generator trains the discriminator from scratch for ED epochs using the loss from Equation (7); 3) jointly train the generator and discriminators for EJ epochs using the loss from Equation (10). The experiments indicated that training in the first stage is crucial for the stability of the model. Therefore, the impact of different epochs on model performance in the first stage is discussed in Section 3. In contrast, after tuning, the training epochs for the second and third stages were fixed at 1000 and 10000 epochs, respectively. This section describes the loss functions and hyperparameter settings for each training stage.
In the first stage, to optimize the generator in the key areas to enhance the feature density, a weighted MSE loss with feature masks was used [31]. The MSE loss of the generator is defined as follows:
|
|
(6) |
where ![]() is the Euclidean norm.
is the Euclidean norm.
In the second stage, the objective of the discriminators is to distinguish between real and generated samples; thus, the design of the loss function aims to minimize misclassification. This study introduced a global discriminator DG and a local discriminator DL based on convolutional neural networks, both of which output a 1024-dimensional feature tensor, and through a concatenation layer, they are combined to form a 2048-dimensional tensor. Finally, after processing using a single fully connected layer and applying a sigmoid transfer function, a continuous value in the range of [0, 1] was obtained, representing the probability that the input is real. Therefore, this process can be considered a joint discriminator DGL that comprehensively determines whether the shear wall layout is designed by engineers based on its global and local features. The output tensor of the joint discriminator (DGL) is represented as:
|
|
(7) |
where x represents the input tensors for the discriminator, which can be either the real data xSwall or the shear wall layout tensor SG generated by the generator. where FC() denotes the output of the fully connected layer.
Accordingly, the loss function of the discriminator can be defined as:
|
|
(8) |
In the third stage, to prevent mode collapse while ensuring the accuracy and diversity of the generated results, the MSE and GAN losses were employed together [35]. The GAN loss was utilized for adversarial training to evaluate the authenticity of the generator output through the discriminator. The discriminator aims to accurately distinguish between the samples generated by the model and the real data, whereas the generator seeks to deceive the discriminator, as expressed in Equation (9). This dynamic interplay involves a competitive process in which the generator and discriminator continuously strive to improve, gradually enhancing the generator's generative capacity.
|
|
(9) |
By combining the two loss functions, the optimization becomes:
|
|
(10) |

To balance the MSE loss with the GAN loss, a weighting hyperparameter
![]() is added. After tuning, all experiments uniformly set
is added. After tuning, all experiments uniformly set ![]() to 0.004. Notably, DGL comprises both
global and local discriminators. Consequently, the gradient flow initially
splits into dual discriminators and then merges into the generator network
during backpropagation.
to 0.004. Notably, DGL comprises both
global and local discriminators. Consequently, the gradient flow initially
splits into dual discriminators and then merges into the generator network
during backpropagation.
3 Experiments on the performance of models
Ten experiments were conducted to explore the impact of the component-based feature space representation method, feature mask, and dual discriminators on the model performance. The specific experimental settings are described in Section 3.1. The Intersection over Union (IoU) metric was used to evaluate the building structural designs generated, as illustrated in Section 3.2. Finally, the results and analysis of the experiments are presented in Section 3.3.
3.1 Experiment settings
The experimental IDs and corresponding parameter settings for the ablation experiments are listed in Table 3. In the ID column, which serves as the abbreviation for each experiment, the first letter represents the type of drawing representation, with ��F�� indicating a representation based on component-based feature space and ��C�� indicating a representation based on RGB color space. The second letter denotes whether a feature mask was employed during network training (��M��) or not (��G��). The third letter represents the model's discriminator configuration, with ��T�� denoting the model with both discriminators, ��G�� for only the global discriminator, ��L�� for only the local discriminator, and ��Z�� indicating the absence of any discriminator. The final number represents one-thousandth of the training epochs in the first stage.
Table 3 Experimental IDs and their corresponding parameter configurations
|
ID |
|
|
|
Feature space |
Mask |
Global discriminator |
Local discriminator |
|
FMT_3 |
3000 |
1000 |
10000 |
�� |
�� |
�� |
�� |
|
FMG_3 |
3000 |
1000 |
10000 |
�� |
�� |
�� |
‒ |
|
FML_3 |
3000 |
1000 |
10000 |
�� |
�� |
‒ |
�� |
|
FMZ_3 |
3000 |
‒ |
‒ |
�� |
�� |
‒ |
‒ |
|
FMZ_9 |
9000 |
‒ |
‒ |
�� |
�� |
‒ |
‒ |
|
FMZ_14 |
14000 |
‒ |
‒ |
�� |
�� |
‒ |
‒ |
|
FMZ_20 |
20000 |
‒ |
‒ |
�� |
�� |
‒ |
‒ |
|
FMT_9 |
9000 |
1000 |
10000 |
�� |
�� |
�� |
�� |
|
CMT_9 |
9000 |
1000 |
10000 |
‒ |
�� |
�� |
�� |
|
FGT_9 |
9000 |
1000 |
10000 |
�� |
‒ |
�� |
�� |
In addition to the parameters listed in Table 3, all other hyperparameters have been explored in previous studies [32] and are not discussed in this study. Fixed values, chosen to optimize the model's performance, were employed in the aforementioned experiments to minimize the number of experimental variables. Specifically, the batch size was set to 8, the weight decay of the discriminators was set to 0.01, and the validation error was computed every 1000 epochs. The model with the smallest validation error was saved for the subsequent overall structural design performance evaluation.
3.2 Evaluation metrics
According to [4], the structural design must account for the intricate interrelationships and influences of numerous complex factors. When assessing it using a single mechanically efficient index, this complexity poses a challenge. The dataset for this study consisted of structural designs from excellent Chinese design institutes, representing a high level of engineering design. Therefore, by referring to the evaluation method proposed by Liao et al. [4], this study conducted a rapid evaluation of the models by calculating the consistency between the generated shear wall layouts and engineer-designed structures. The IoU metric was employed for this evaluation, as expressed in Equation (11):
|
|
(11) |
where ![]() denotes the intersection
and
denotes the intersection
and ![]() denotes the union.
denotes the union.
3.3 Experiment results
Using the evaluation metric illustrated in Section 3.2, the ten ablation experiments outlined in Section 3.1 were evaluated. The performances of the models on the Test A set provided by the same design institute as the training set are presented in Table 4, whereas the performances on the Test B set provided by different design institutes from the training set are presented in Table 5. Owing to the instability of experimental outcomes when training "FGT_9" with various random seeds, the final row in Tables 4 and 5 showcases two markedly disparate results observed across numerous training sessions. This variability manifests even though identical hyperparameters are employed for "FGT_9", but with different random seeds, leading to one instance of a "performance ceiling" and another of a "performance floor."
Table 4 The performance of the ablation experiment models on Test A
|
ID |
Max IoU |
Min IoU |
Mean IoU |
Std IoU |
Median IoU |
|
|
FMT_3 |
0.998 |
0.907 |
0.958 |
0.023 |
0.964 |
|
|
FMG_3 |
0.985 |
0.625 |
0.944 |
0.063 |
0.955 |
|
|
FML_3 |
0.996 |
0.754 |
0.948 |
0.055 |
0.967 |
|
|
FMZ_3 |
0.960 |
0.390 |
0.801 |
0.135 |
0.835 |
|
|
FMZ_9 |
0.995 |
0.908 |
0.955 |
0.022 |
0.959 |
|
|
FMZ_14 |
0.989 |
0.765 |
0.965 |
0.053 |
0.939 |
|
|
FMZ_20 |
0.995 |
0.912 |
0.981 |
0.002 |
0.988 |
|
|
FMT_9 |
1.000 |
0.986 |
0.996 |
0.004 |
0.997 |
|
|
CMT_9 |
1.000 |
0.290 |
0.517 |
0.207 |
0.423 |
|
|
FGT_9 |
Performance ceiling |
0.952 |
0.571 |
0.826 |
0.104 |
0.853 |
|
Performance floor |
0.958 |
0.004 |
0.759 |
0.231 |
0.825 |
|
Table 5 The performance of the ablation experiment models on the Test B
|
ID |
Max IoU |
Min IoU |
Mean IoU |
Std IoU |
Median IoU |
|
|
FMT_3 |
0.570 |
0.400 |
0.470 |
0.044 |
0.468 |
|
|
FMG_3 |
0.529 |
0.343 |
0.436 |
0.046 |
0.438 |
|
|
FML_3 |
0.500 |
0.368 |
0.441 |
0.037 |
0.450 |
|
|
FMZ_3 |
0.528 |
0.171 |
0.414 |
0.095 |
0.431 |
|
|
FMZ_9 |
0.532 |
0.282 |
0.455 |
0.061 |
0.468 |
|
|
FMZ_14 |
0.539 |
0.256 |
0.449 |
0.073 |
0.461 |
|
|
FMZ_20 |
0.504 |
0.316 |
0.448 |
0.055 |
0.463 |
|
|
FMT_9 |
0.590 |
0.382 |
0.496 |
0.051 |
0.496 |
|
|
CMT_9 |
0.812 |
0.089 |
0.257 |
0.238 |
0.135 |
|
|
FGT_9 |
Performance ceiling |
0.599 |
0.350 |
0.495 |
0.076 |
0.516 |
|
Performance floor |
0.539 |
0 |
0.340 |
0.212 |
0.455 |
|
(1) Influence of training epochs in the first stage on the model performance
Comparing the results of ��FMZ_3,�� ��FMZ_9,�� ��FMZ_14,�� and ��FMZ_20,�� as illustrated in Tables 4 and 5, it can be found that as the epochs in the first phase increases, the performance of models gradually improves and then tends to saturate. In addition, by comparing Tables 4 and 5, it is evident that the models begin to overfit after more than 9000 epochs. Although the accuracy improved slightly in Test A, performance in Test B decreased. Therefore, it was considered that the generator was fully trained after 9000 epochs in the first phase, and this strategy was adopted in subsequent experiments.
(2) Effect of feature space-based drawing representation on model performance
Comparing the results of ��FMT_9�� and ��CMT_9�� as illustrated in Tables 4 and 5, it is evident that the SIoU score of the model with component-based feature space data representation is significantly higher than that of the model with RGB color space data representation. The typical prediction results from the two experiments are shown in Figure 4. It can be observed that ��CMT_9�� predicted more short-leg shear walls compared to ��FMT_9,�� which does not align with practical engineering. This indicates that compared with the RGB color space, the component-based feature space representation of drawings is more conducive to the model's understanding of shear wall layout tasks, aligning with the analysis in Section 2.1.1. Therefore, the component-based feature space data representation method was used in the subsequent analyses.
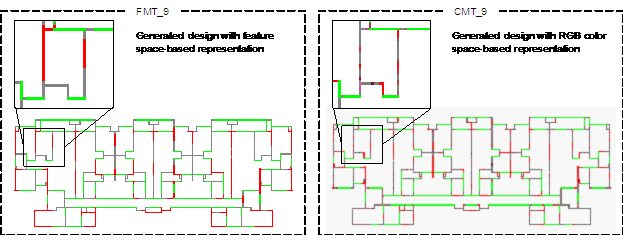
Figure 4 Typical case results of models with and without representation based on the feature space
(3) Influence of feature mask on model performance
The last row in Tables 4 and 5 presents two significantly different outcomes observed across multiple training times, utilizing the same hyperparameters but different random seeds of ��FGT_9,�� with one being good and the other poor. Although ��FGT_9�� with certain random seeds performs better than ��FMT_9,�� there is a potential for poor structural designs, leading to unstable training results. Observing the poorly performing models of ��FGT_9,�� it can be found that they primarily fail in predicting the drawings for 6-degree seismic intensities (i.e., the corresponding peak ground acceleration value of the design basis earthquake with 10% exceedance probability in 50 years is 50 cm/s2), often unable to predict shear walls as shown in Figure 5. This may be attributed to the limited data availability for 6-degree seismic intensities, resulting in inadequate learning of effective features for such drawings. However, comparing the results of ��FMT_9�� and ��FGT_9�� in Tables 4 and 5, it can be found that the model trained after introducing the feature mask has stabilized at a relatively high level of performance. This indicates that the feature masks can focus the attention of the model on key areas of the data, preventing it from overfocusing on irrelevant regions, thereby enhancing the understanding and learning efficiency of the model. Therefore, in the subsequent analyses, a model training approach incorporating a feature mask was utilized, which is consistent with the analysis in Section 2.1.2.
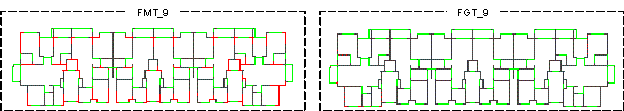
Figure 5 Typical case results of models with and without feature mask on a typical 6-degree seismic design
(4) Effect of dual discriminators on model performance
Comparing the results of ��FMT_3,�� ��FMG_3,�� ��FML_3,�� and ��FMZ_14,�� as illustrated in Tables 4 and 5, it can be found that the SIoU score of ��FMT_3�� on Test B is higher than those of ��FMG_3,�� ��FML_3,�� and ��FMZ_14.�� This indicates that introducing dual discriminators enhanced the model's performance. It is worth noting that to ensure the same epochs of training for models with and without discriminators, the strategy adopted was to train the model with discriminators in three phases: 3000, 1000, and 10000 epochs, whereas the model without discriminators was only trained for 14000 epochs in the first phase.
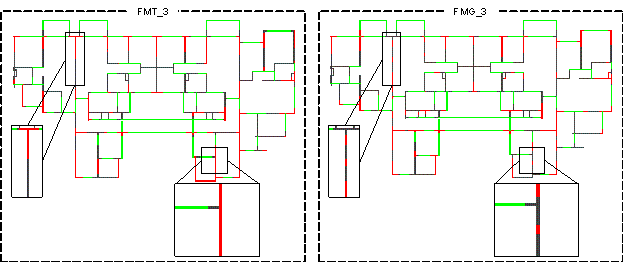
Figure 6 Typical case results of model with dual discriminators and model with only a global discriminator
Comparing the results of ��FMT_9,�� ��FMZ_9,�� ��FMZ_14,�� and ��FMZ_20,�� as illustrated in Tables 4 and 5, it can be observed that overfitting occurs when the epochs in the first phase exceed 9000. Although the accuracy improved slightly in Test A, the performance in Test B decreased as the number of epochs in the first phase increased. However, after introducing dual discriminators for joint training, the performance of the model continued to improve, indicating that it was advantageous for model learning, which is consistent with the analysis in Section 2.2.2. Furthermore, by observing typical cases of ��FMT_3�� and ��FMG_3�� (Figure 6), it can be found that after adding a local discriminator, the model has a better learning effect on the relative spatial of partition walls and shear walls, which enhances the network's understanding of reasonable layouts of shear walls within the overall building structure.
4 Case study
To validate the generalizability of the proposed model and the rationality and structural mechanics performance of the generated structural designs, this section selects three typical cases with different design conditions from Test B for a comparative analysis with the widely used StructGAN [4] and engineer-designed terms of plan layout, mechanical performance, and material consumption.
4.1 Basic information of the case
The three typical cases are denoted as Case-6d53m045s, Case-7d54m035s, and Case-8d80m040s, respectively, with their respective design conditions listed in Table 6. The naming rule for the cases is as follows: "6d" signifies that the seismic design intensity is 6 degrees, "53m" denotes a structural height of 53 meters, and "045s" represents a site characteristic period of 0.45 seconds; other designations follow a similar pattern. The structural design drawings for the three cases are shown in Figures 7-9. It should be noted that owing to the different data processing methods, the output of StructGAN has wider pixels [4].
Table 6 The design conditions of the three typical cases
|
structural |
stories above |
seismic design |
site characteristic |
|
|
Case-6d53m045s |
53 |
17 |
6 degrees |
0.45 |
|
Case-7d54m035s |
54 |
18 |
7 degrees |
0.35 |
|
Case-8d80m040s |
80 |
25 |
8 degrees |
0.40 |
The seismic design intensities of 6, 7, and 8 degrees correspond to peak ground accelerations of 50, 100, and 200 cm/s², respectively, for the design basis earthquake with a 10% exceedance probability in 50 years.
4.2 Case analysis result
(1) Plan drawing designs
To further explore the impact of the optimized data representation and understanding method proposed in this study on the performance of the GAN, both the proposed model and StructGAN were used to generate shear wall layouts for a typical case, and engineers were invited to conduct a detailed structural design. The results are presented in Figures 7-9.
The experimental results of the three typical cases showed that in the structural design generated by StructGAN, the shear walls that should have been continuous were interrupted by short distances in the middle. Furthermore, numerous short-leg shear walls were generated in the design, which deviated from the experience of engineers and regulatory requirements. In addition, StructGAN generated a considerably larger number of shear walls than those designed by engineers or the model proposed in this study. This excess of shear walls results in structural redundancy, impacting the economy and practicality of the design and hurting the overall structural performance. In contrast, the model proposed in this study performed excellently in addressing these issues, indicating that the proposed optimized method can effectively facilitate the comprehension of the relationships among various components in drawings.
|
(a) Architectural design |
(b) Designed by the model proposed in this study |
|
(c) StructGAN designs |
(d) Engineer designs |
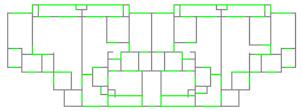
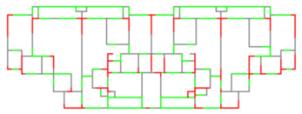
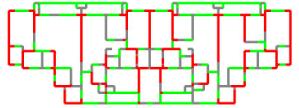
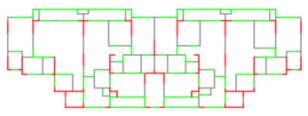
Figure 7 Case-6d53m045s design results by the proposed model, StructGAN, and engineer
|
(a) Architectural design |
(b) Designed by the model proposed in this study |
|
(c) StructGAN designs |
(d) Engineer designs |
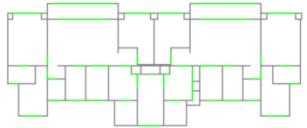
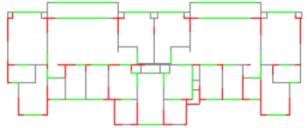
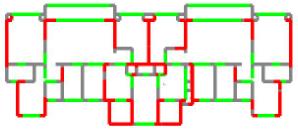
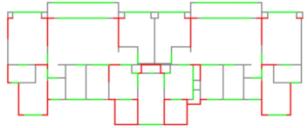
Figure 8 Case-7d54m035s design results by the proposed model, StructGAN, and engineer
|
(a) Architectural design |
(b) Designed by the model proposed in this study |
|
(c) StructGAN designs |
(d) Engineer designs |
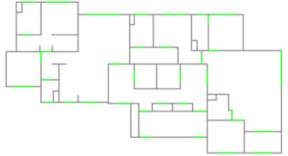
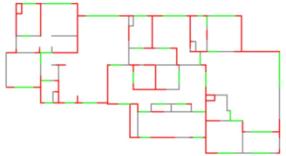
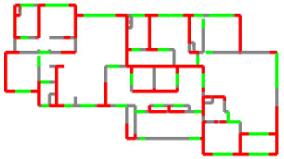
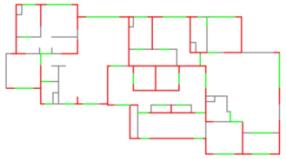
Figure 9 Case-8d80m040s design results by the proposed model, StructGAN, and engineer
Using Equation (11), the IoUs for the shear walls generated by the model in this study and StructGAN against engineers were calculated to evaluate the differences between the designs quantitatively. Table 7 presents the results of the three typical cases. Typically, an IoU greater than 0.5 indicates that the AI design has a high similarity to engineer-designed structures [4]. The experimental results show that the proposed model has a higher similarity to engineers and is significantly better than StructGAN.
Table 7 The performance of the model proposed in this study and StructGAN
|
This study |
StructGAN |
Difference |
|
|
Case-6d53m045s |
0.569 |
0.454 |
25% |
|
Case-7d54m035s |
0.485 |
0.398 |
22% |
|
Case-8d80m040s |
0.582 |
0.493 |
18% |
(2) Overall structural performance
Based on the automatic beam design method proposed by [7], the shear walls on the same axis were connected using beams while ensuring that the beams were positioned along the architectural axis and the ends were connected to shear walls or other beams. Beams were also arranged on doors, windows, and partition walls to achieve the layout of the beams. All the components uniformly used C30 concrete (with a cube strength of 30 MPa) and HPB400 steel reinforcements (with a yield strength of 400 MPa). The thicknesses of the shear walls were determined using the wall thickness regression equation proposed by Lu et al. [13]. The shear wall thicknesses for Case-6d53m045s, Case-7d54m035s, and Case-8d80m040s are calculated to be 200 mm, 200 mm, and 260 mm, respectively. The beam width was equal to the thickness of the shear walls, and the beam height was uniformly set to 500 mm.
A semi-automated modeling method based on the PKPM API established a structural analysis model. The same standard story was used for all stories, and necessary adjustments were made to a few components during the modeling process. For example, when a shear wall needs to accommodate doors, windows, or installations, or when the shear wall is an extra-long wall pier (exceeding 8m), openings are drilled [34]. In this study, the consideration of openings in shear walls during structural analysis is addressed by using coupling beams. In structural analysis, when the shear span-to-effective depth ratio of a beam between two shear walls is less than 2.5, the beam is analyzed as a coupling beam element [36]. In addition, the PKPM software can effectively analyze shear walls with openings. Subsequently, the structural dynamic characteristics and mechanical performance under seismic loading were analyzed, as the seismic effects have the potential to induce collapse in building structures [37-38]. The main results of the structural analysis are presented in Tables 8-10, and the inter-story drift ratio is shown in Figures 10-12.
As shown in Tables 8-10 and Figures 10-12, the structural designs generated by both models effectively met the design code requirements. Compared with StructGAN, the structural design generated by the proposed model exhibited significantly reduced differences from engineer-designed structures in most metrics. This demonstrates that the optimized data representation and understanding method proposed in this study enables the model to effectively capture the implicit engineering experience from the training set, thus generating shear wall layouts that align with practical experience and standards. Additionally, the structure generated by the model in this study exhibited similar structural stiffness in both the X and Y directions, with similar inter-story deformations. This indicates that the structure exhibits a balanced response to loads in both directions, contributing to the overall stability of the structure when subjected to external forces. This performance is even superior to the engineer's design in Case-6d53m045s and Case-8d80m040s.
Table 8 The results of structural dynamic characteristics and mechanical response analysis for Case-6d53m045s
|
Mechanical indicators |
Engineer |
This study |
StructGAN |
|||
|
Value |
Value |
Difference (AI v.s. Engineer) |
Value |
Difference (AI v.s. Engineer) |
||
|
Period (s) |
T1 |
1.8606 |
1.8041 |
-3% |
1.5406 |
-17% |
|
T2 |
1.5495 |
1.5606 |
1% |
1.0365 |
-33% |
|
|
T3 |
1.2606 |
1.2761 |
1% |
0.7972 |
-37% |
|
|
Period ratio |
0.6775 |
0.7073 |
4% |
0.5175 |
-24% |
|
|
Max story drift ratio (rad) |
x |
0.000373 |
0.000361 |
-3% |
0.000319 |
-14% |
|
y |
0.000304 |
0.000382 |
26% |
0.000264 |
-13% |
|
|
Wall thickness (mm) |
200 |
200 |
‒ |
200 |
‒ |
|
|
Weight (ton) |
10402.08 |
10500.05 |
1% |
11238.54 |
8% |
|
|
Average absolute difference |
‒ |
‒ |
6% |
‒ |
21% |
|
Table 9 The results of structural dynamic characteristics and mechanical response analysis for Case-7d54m035s
|
Mechanical indicators |
Engineer |
This study |
StructGAN |
|||
|
Value |
Value |
Difference (AI v.s. Engineer) |
Value |
Difference (AI v.s. Engineer) |
||
|
Period (s) |
T1 |
1.6623 |
1.7374 |
4% |
1.5847 |
-5% |
|
T2 |
1.3448 |
1.5593 |
16% |
1.1985 |
-11% |
|
|
T3 |
1.0996 |
1.2391 |
13% |
1.0152 |
-8% |
|
|
Period ratio |
0.6615 |
0.7132 |
8% |
0.6406 |
-3% |
|
|
Max story drift ratio (rad) |
x |
0.000522 |
0.000459 |
-12% |
0.000507 |
-3% |
|
y |
0.000520 |
0.000555 |
7% |
0.000373 |
-28% |
|
|
Wall thickness (mm) |
200 |
200 |
‒ |
200 |
‒ |
|
|
Weight (ton) |
6395.45 |
6527.47 |
2% |
6941.84 |
9% |
|
|
Average absolute difference |
‒ |
‒ |
9% |
‒ |
10% |
|
Table 10 The results of structural dynamic characteristics and mechanical response analysis for Case-8d80m040s
|
Mechanical indicators |
Engineer |
This study |
StructGAN |
|||
|
Value |
Value |
Difference (AI v.s. Engineer) |
Value |
Difference (AI v.s. Engineer) |
||
|
Period (s) |
T1 |
1.8337 |
1.7868 |
-3% |
2.1296 |
16% |
|
T2 |
1.5408 |
1.4731 |
-4% |
1.6430 |
7% |
|
|
T3 |
1.3163 |
1.1992 |
-9% |
1.4553 |
11% |
|
|
Period ratio |
0.7178 |
0.6811 |
-5% |
0.6834 |
-5% |
|
|
Max story drift ratio (rad) |
x |
0.000329 |
0.000332 |
1% |
0.000382 |
16% |
|
y |
0.000433 |
0.000389 |
-10% |
0.000579 |
34% |
|
|
Wall thickness (mm) |
260 |
260 |
‒ |
260 |
‒ |
|
|
Weight (ton) |
12258.89 |
12361.42 |
1% |
12564.57 |
3% |
|
|
Average absolute difference |
‒ |
‒ |
5% |
‒ |
13% |
|
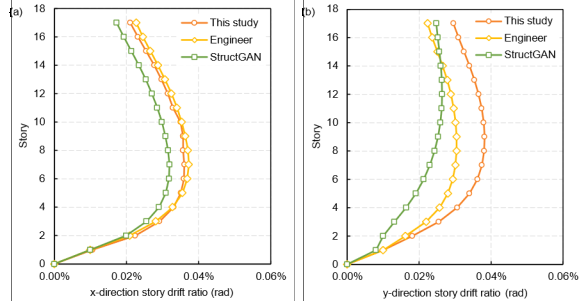
Figure 10 Envelopes of inter-story drift ratios of this study, StructGAN, and engineer design for Case-6d53m045s
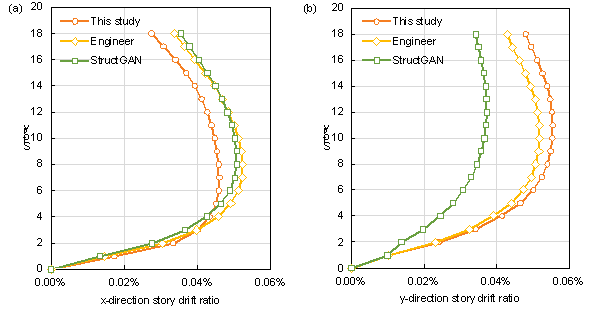
Figure 11 Envelopes of inter-story drift ratios of this study, StructGAN, and engineer design for Case-7d54m035s
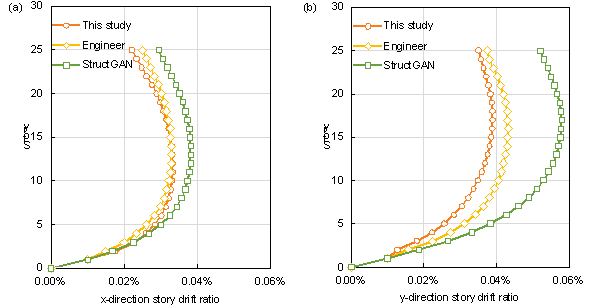
Figure 12 Envelopes of inter-story drift ratios of this study, StructGAN, and engineer design for Case-8d80m040s
(3) Material consumption comparison
The material consumption of these three structural designs was calculated based on the PKPM structural analysis model, as listed in Tables 11-13. The results show that the structural design generated by StructGAN uses significantly more concrete and steel reinforcement than the engineer's design in Case-6d53m045s and Case-7d54m035s, which is more conservative, as is evident in the plan drawings shown in Figures 7-8. In contrast, the material consumption of the shear wall layout generated by the model in this study is closer to that of engineer-designed structures, which can effectively satisfy the design code requirements while reducing material consumption.
Table 11 Material consumption in structural design and differences from engineer's design for Case-6d53m045s
|
Material |
Engineer |
This study |
StructGAN |
|||
|
Component |
Value |
Value |
Difference |
Value |
Difference |
|
|
Concrete (m3) |
Wall |
840.48 |
897.43 |
7% |
1171.64 |
39% |
|
Beam |
463.08 |
712.13 |
54% |
723.35 |
56% |
|
|
Slab |
713.83 |
445.23 |
-38% |
405.45 |
-43% |
|
|
Total |
2017.39 |
2054.79 |
2% |
2300.44 |
14% |
|
|
Steel reinforcement (ton) |
Wall |
153.61 |
166.55 |
8% |
181.35 |
18% |
|
Beam |
64.09 |
65.79 |
3% |
59.94 |
-6% |
|
|
Slab |
70.23 |
70.53 |
0% |
72.56 |
3% |
|
|
Total |
287.93 |
302.87 |
5% |
313.85 |
9% |
|
Table 12 Material consumption in structural design and differences from engineer's design for Case-7d54m035s
|
Material |
Engineer |
This study |
StructGAN |
|||
|
Component |
Value |
Value |
Difference |
Value |
Difference |
|
|
Concrete (m3) |
Wall |
715.32 |
681.48 |
-5% |
843.12 |
18% |
|
Beam |
218.88 |
262.26 |
20% |
221.94 |
1% |
|
|
Slab |
406.80 |
410.40 |
1% |
417.06 |
3% |
|
|
Total |
1341.00 |
1354.14 |
1% |
1482.12 |
11% |
|
|
Steel reinforcement (ton) |
Wall |
106.15 |
117.96 |
11% |
129.20 |
22% |
|
Beam |
34.84 |
39.45 |
13% |
34.43 |
-1% |
|
|
Slab |
70.23 |
38.11 |
-46% |
41.03 |
-42% |
|
|
Total |
180.24 |
195.52 |
8% |
204.66 |
14% |
|
Table 13 Material consumption in structural design and differences from engineer's design for Case-8d80m040s
|
Material |
Engineer |
This study |
StructGAN |
|||
|
Component |
Value |
Value |
Difference |
Value |
Difference |
|
|
Concrete (m3) |
Wall |
1608.75 |
1662.00 |
3% |
1594.5 |
-1% |
|
Beam |
360.00 |
352.75 |
-2% |
398.00 |
11% |
|
|
Slab |
718.00 |
719.75 |
0% |
725.25 |
1% |
|
|
Total |
2686.75 |
2734.50 |
2% |
2717.75 |
1% |
|
|
Steel reinforcement (ton) |
Wall |
300.58 |
297.15 |
-1% |
298.28 |
-1% |
|
Beam |
51.98 |
50.31 |
-3% |
59.18 |
13.85% |
|
|
Slab |
72.62 |
70.11 |
-3% |
69.94 |
-4% |
|
|
Total |
425.18 |
417.57 |
-2% |
427.41 |
1% |
|
5 Conclusions
In this study, an optimized data representation and understanding method was developed for the intelligent design of shear wall structures, effectively addressing the challenges faced by current methods in accurately capturing the correlations and differences between the components in drawings. Ablation experiments and typical case studies demonstrate the superiority of this method over existing models (such as StructGAN). The detailed conclusions are as follows:
(1) This study introduces a component-based feature space representation of drawings, addressing the issue of introducing unreasonable prior information in RGB-based feature representation, thereby facilitating the rapid and stable learning of the model from the input data. Furthermore, a feature mask was employed during model training, concentrating the optimization of the generative model on the key areas to enhance the feature density. Moreover, the feature representation method proposed in this study is versatile, making it applicable to subsequent research on intelligent design and related fields, especially methods based on image or image-like matrices.
(2) Ablation experiments were conducted to assess and analyze the effects of different data representation methods, the incorporation of feature masks during network training, and the use of local discriminators on AI performance. The results indicate that the optimized data representation and understanding method proposed in this study can significantly enhance the model's ability to comprehend the relationships between the components in drawings. Moreover, it effectively captures implicit engineering experience from datasets, leading to shear wall layouts that align better with practical experience and design code requirements.
(3) A typical case study compared the proposed model with the widely used StructGAN model and engineers. The results show that the structural design generated by the model in this study has an average difference of less than 10% from engineer-designed structures in terms of the shear wall layouts, mechanical performance, and material consumption. This difference is significantly lower than the discrepancy between the StructGAN and engineering designs, indicating that the proposed method significantly improves the quality of the GAN-driven shear wall structural design.
The method proposed in this study effectively improves AI designs but also has limitations. Firstly, this study focuses on the intelligent design of shear wall layout, while not encompassing the intelligent design of cross-sectional size. Future research could profitably investigate the integration of these two facets to produce more holistic design solutions. Secondly, the proposed intelligent structural design did not adequately consider the requirements of multi-disciplinary collaboration, such as architectural functionality and aesthetics. Future studies will consider multi-disciplinary factors that influence structural design. Finally, the method proposed in this study is theoretically generalizable to other similar structures, such as special plate shear walls (SPSWs). In the future, once a more extensive collection of structural design data has been collected, research will be conducted to generalize this method.
Acknowledgment
Appendix A
An overview of the GANs with dual discriminators based on feature masks is presented in Table A.1. Dilation refers to the dilation rate, which defines the spacing between values when the convolutional kernel processes the data. The dilatation rate of the regular convolutional layer was 1.
Table A.1 An overview of the networks
|
Generator Network |
||||
|
Type |
Kernel |
Dilation |
Stride |
Output channel |
|
Conv. |
|
1 |
|
64 |
|
Conv. |
|
1 |
|
128 |
|
Conv. |
|
1 |
|
128 |
|
Conv. |
|
1 |
|
256 |
|
Conv. |
|
1 |
|
256 |
|
Conv. |
|
1 |
|
256 |
|
Dilated conv. |
|
2 |
|
256 |
|
Dilated conv. |
|
4 |
|
256 |
|
Dilated conv. |
|
8 |
|
256 |
|
Dilated conv. |
|
16 |
|
256 |
|
Conv. |
|
1 |
|
256 |
|
Conv. |
|
1 |
|
256 |
|
Transpose conv. |
|
1 |
|
128 |
|
Conv. |
|
1 |
|
128 |
|
Transpose conv. |
|
1 |
|
64 |
|
Conv. |
|
1 |
|
32 |
|
Output |
|
1 |
|
1 |
|
Discriminator Network |
||||
|
Type |
Kernel |
Dilation |
Stride |
Output channel |
|
Conv. |
|
1 |
|
64 |
|
Conv. |
|
1 |
|
128 |
|
Conv. |
|
1 |
|
256 |
|
Conv. |
|
1 |
|
512 |
|
Conv. |
|
1 |
|
512 |
|
Conv. |
|
1 |
|
512 |
|
FC |
- |
- |
- |
1024 |
References
[1] Resmi, R., & Roja, S. Y. (2016). A review on performance of shear wall. International Journal of Applied Engineering Research, 11(3), 369-373.
[2] Y��ksel, N., Börkl��, H. R., Sezer, H. K., & Canyurt, O. E. (2023). Review of artificial intelligence applications in engineering design perspective. Engineering Applications of Artificial Intelligence, 118, 105697. https://doi.org/10.1016/j.engappai.2022.105697
[3] Liao, W. J., Lu, X. Z., Fei, Y. F., Gu, Y., & Huang, Y. L. (2024). Generative AI design for building structures. Automation in Construction, 157, 105187. https://doi.org/10.1016/j.autcon.2023.105187
[4] Liao, W. J., Lu, X. Z., Huang, Y. L., Zheng, Z., & Lin, Y. Q. (2021). Automated structural design of shear wall residential buildings using generative adversarial networks. Automation in Construction, 132, 103931. https://doi.org/10.1016/j.autcon.2021.103931
[5] Pizarro, P. N., & Massone, L. M. (2021). Structural design of reinforced concrete buildings based on deep neural networks. Engineering Structures, 241, 112377. https://doi.org/https://doi.org/10.1016/j.engstruct.2021.112377
[6] Pizarro, P. N., Massone, L. M., Rojas, F. R., & Ruiz, R. O. (2021). Use of convolutional networks in the conceptual structural design of shear wall buildings layout. Engineering Structures, 239, 112311. https://doi.org/https://doi.org/10.1016/j.engstruct.2021.112311
[7] Fei, Y. F., Liao, W. J., Zhang, S., Yin, P. F., Han, B., Zhao, P. J., et al. (2022). Integrated schematic design method for shear wall structures: a practical application of generative adversarial networks. Buildings, 12(9), 1295. https://doi.org/10.3390/buildings12091295
[8] Fu, B., Gao, Y., & Wang, W. (2023). Dual generative adversarial networks for automated component layout design of steel frame-brace structures. Automation in Construction, 146, 104661. https://doi.org/10.1016/j.autcon.2022.104661
[9] Liao, W. J., Huang, Y. L., Zheng, Z., & Lu, X. Z. (2022). Intelligent generative structural design method for shear wall building based on ��fused-text-image-to-image�� generative adversarial networks. Expert Systems with Applications, 210, 118530. https://doi.org/10.1016/j.eswa.2022.118530
[10] Zhao, P. J., Liao, W. J., Huang, Y. L., & Lu, X. Z. (2023). Intelligent design of shear wall layout based on attention-enhanced generative adversarial network. Engineering Structures, 274, 115170. https://doi.org/10.1016/j.engstruct.2022.115170
[11] Fei, Y. F., Liao, W. J., Huang, Y. L., & Lu, X. Z. (2022). Knowledge-enhanced generative adversarial networks for schematic design of framed tube structures. Automation in Construction, 144, 104619. https://doi.org/10.1016/j.autcon.2022.104619
[12] Liao, W. J., Wang, X. Y., Fei, Y. F., Huang, Y. L., Xie, L. L., & Lu, X. Z. (2023). Base-isolation design of shear wall structures using physics-rule-co-guided self-supervised generative adversarial networks. Earthquake Engineering & Structural Dynamics. https://doi.org/10.1002/eqe.3862
[13] Lu, X. Z., Liao, W. J., Zhang, Y., & Huang, Y. L. (2022). Intelligent structural design of shear wall residence using physics-enhanced generative adversarial networks. Earthquake Engineering & Structural Dynamics, 51(7), 1657-1676. https://doi.org/10.1002/eqe.3632
[14] Zhao, P. J., Liao, W. J., Huang, Y. L., & Lu, X. Z. (2023). Intelligent design of shear wall layout based on graph neural networks. Advanced Engineering Informatics, 55, 101886. https://doi.org/10.1016/j.aei.2023.101886
[15] Zhao, P. J., Fei, Y. F., Huang, Y. L., Feng, Y. T., Liao, W. J., & Lu, X. Z. (2023). Design-condition-informed shear wall layout design based on graph neural networks. Advanced Engineering Informatics, 58, 102190. https://doi.org/10.1016/j.aei.2023.102190
[16] Zhao, P. J., Liao, W. J., Huang, Y. L., & Lu, X. Z. (2023). Intelligent beam layout design for frame structure based on graph neural networks. Journal of Building Engineering, 63, 105499. https://doi.org/10.1016/j.jobe.2022.105499
[17] Chang, K. H., & Cheng, C. Y. (2020). Learning to simulate and design for structural engineering. In International Conference on Machine Learning (pp. 1426-1436). PMLR.
[18] Feng, Y. T., Fei, Y. F., Lin, Y. Q., Liao, W. J., & Lu, X. Z. (2023). Intelligent generative design for shear wall cross-sectional size using rule-embedded generative adversarial network. Journal of Structural Engineering, 149(11), 04023161. https://doi.org/10.1061/JSENDH.STENG-12206
[19] Lou, H., Xiao, Z., Wan, Y., Quan, G., Jin, F., Gao, B., & Lu, H. (2022). Size optimization design of members for shear wall high-rise buildings. Journal of Building Engineering, 61, 105292. https://doi.org/10.1016/j.jobe.2022.105292
[20] Lou, H., Xiao, Z., Wan, Y., Jin, F., Gao, B., & Li, C. (2022). A practical discrete sizing optimization methodology for the design of high-rise concrete buildings. Engineering Computations, 39(6), 2256-2283. https://doi.org/10.1108/EC-08-2021-0473
[21] Choi S W, Oh B K, Park H S. Design technology based on resizing method for reduction of costs and carbon dioxide emissions of high-rise buildings[J]. Energy and Buildings, 2017, 138: 612-620. https://doi.org/10.1016/j.enbuild.2016.12.095
[22] Daryan, A. S., Salari, M., Palizi, S., & Farhoudi, N. (2023, February). Size and layout optimum design of frames with steel plate shear walls by metaheuristic optimization algorithms. In Structures (Vol. 48, pp. 657-668). Elsevier. https://doi.org/10.1016/j.istruc.2022.11.118
[23] Pizarro P N, Hitschfeld N, Sipiran I, et al. Automatic floor plan analysis and recognition[J]. Automation in Construction, 2022, 140: 104348. https://doi.org/10.1016/j.autcon.2022.104348
[24] Dalal, N., & Triggs, B. (2005). Histograms of oriented gradients for human detection. In 2005 IEEE computer society conference on computer vision and pattern recognition (CVPR'05) (Vol. 1, pp. 886-893). Ieee. https://doi.org/10.1109/CVPR.2005.177
[25] Comaniciu, D., & Meer, P. (2002). Mean shift: A robust approach toward feature space analysis. IEEE Transactions on pattern analysis and machine intelligence, 24(5), 603-619. https://doi.org/10.1109/34.1000236
[26] Hadid, A., Pietikainen, M., & Ahonen, T. (2004). A discriminative feature space for detecting and recognizing faces. In Proceedings of the 2004 IEEE Computer Society Conference on Computer Vision and Pattern Recognition, 2004. CVPR 2004. (Vol. 2, pp. II-II). IEEE. https://doi.org/10.1109/CVPR.2004.1315246
[27] Lowe, D. G. (2004). Distinctive image features from scale-invariant keypoints. International journal of computer vision, 60, 91-110. https://doi.org/10.1023/B:VISI.0000029664.99615.94
[28] Lu, X. Z., Han, J., Han, B., Chen, S. W., & Liao, W. J. (2023). Intelligent structural design optimization for shear wall buildings based on machine learning and rule encoding. Journal of Southeast University (Natural Science Edition), 53 (06), 1199-1208. (In Chinese) https://doi.org/10.3969/j.issn.1001-0505.2023.06.027
[29] Yang, C., Lu, X., Lin, Z., Shechtman, E., Wang, O., & Li, H. (2017). High-resolution image inpainting using multi-scale neural patch synthesis. In Proceedings of the IEEE conference on computer vision and pattern recognition (pp. 6721-6729). https://doi.org/10.48550/arXiv.1611.09969
[30] Yeh, R. A., Chen, C., Yian Lim, T., Schwing, A. G., Hasegawa-Johnson, M., & Do, M. N. (2017). Semantic image inpainting with deep generative models. In Proceedings of the IEEE conference on computer vision and pattern recognition (pp. 5485-5493). https://doi.org/10.48550/arXiv.1607.07539
[31] Pathak, D., Krahenbuhl, P., Donahue, J., Darrell, T., & Efros, A. A. (2016). Context encoders: Feature learning by inpainting. In Proceedings of the IEEE conference on computer vision and pattern recognition (pp. 2536-2544). https://doi.org/10.1109/CVPR.2016.278
[32] Iizuka, S., Simo-Serra, E., & Ishikawa, H. (2017). Globally and locally consistent image completion. ACM Transactions on Graphics (ToG), 36(4), 1-14. https://doi.org/10.1145/3072959.3073659
[33] Yu, F., & Koltun, V. (2015). Multi-scale context aggregation by dilated convolutions. arXiv preprint arXiv:1511.07122. https://doi.org/10.48550/arXiv.1511.07122
[34] Technical Specification for Concrete Structures of Tall Building: JGJ 3-2010. [2010-10-21].
[35] Goodfellow, I., Pouget-Abadie, J., Mirza, M., Xu, B., Warde-Farley, D., Ozair, S., ... & Bengio, Y. (2014). Generative adversarial nets. Advances in neural information processing systems, 27. https://proceedings.neurips.cc/paper_files/paper/2014/file/5ca3e9b122f61f8f06494c97b1afccf3-Paper.pdf
[36] Code for Design of Concrete Structures: GB 50010-2010. [2011-7-1].
[37] Lu, X.Z., Xie, L.L., Guan, H., Huang, Y.L., & Lu, X. (2015). A shear wall element for nonlinear seismic analysis of super-tall buildings using OpenSees. Finite Elements in Analysis & Design, 98, 14-25. https://doi.org/10.1016/j.finel.2015.01.006
[38] Lu, X., Lu, X.Z., Guan, H., & Ye, L.P. (2013) Collapse simulation of reinforced concrete high-rise building induced by extreme earthquakes. Earthquake Engineering & Structural Dynamics, 42(5), 705-723. https://doi.org/10.1002/eqe.2240