Abstract
Beam placement in shear wall systems is crucial in transferring vertical loads from floors to shear walls, ensuring structural integrity and optimal performance. Existing solutions using deep generative algorithms rely on pixel images and involve many model parameters, resulting in high computational costs. To address this issue, this paper presents a method based on graph neural networks (GNNs) with robust topological feature extraction capabilities. The method generates potential beam layout scenarios by incorporating architectural layouts, devising scheme design inputs and leveraging engineering experience. Adopting the proposed approach reduces the number of beam layout scenarios and significantly improves computation efficiency. The efficacy is demonstrated through various test cases, suggesting that the beam layouts designed by the proposed method closely resemble those by engineers.
Keywords
graph neural network; graph representation methods; shear wall structure; beam layout design; deep learning
1. Introduction
Global urbanization has led to a surge in the construction of high-rise buildings [1-2]. Reinforced concrete shear wall structures are the most widely employed among various high-rise building systems. They require extensive design considerations [3]. In these shear wall systems, the beam system, consisting of coupling and framing beams, is the primary component for bearing and transmitting vertical loads. As a result, beam layout design becomes a critical task [3-4]. However, most structural design processes, especially during the scheme design stage, rely on manual intervention, leading to low efficiency. Consequently, there is a pressing need to develop automated methods in beam layout design, which include automated methods based on evolutionary algorithms and intelligent methods based on neural networks.
This study presents a method for designing the layout of beams in shear wall structures using GNNs. Section 2 describes the GNN-based beam layout design method in detail. Section 3 defines the potential beam layout scenarios and presents the GNN models. Section 4 discusses the impact of various potential beam layout scenarios and GNN models. Finally, Section 5 presents the case studies that illustrate the efficacy of the proposed method.
2. GNN-based Beam Layout Design Method for Shear Wall Structures
The proposed GNN-based beam layout design method for shear wall structures includes three steps, as shown in Figure 1.
(1) Data preparation: Generation of potential beam layout scenarios
A vast possibility of space is associated with directly predicting a beam layout with a free-overlapping form at any shear wall position. The volume of data is significant, and the impact of building components, such as partition walls, doors, and windows, as well as the design experience of engineers, cannot be fully considered. Hence, this study presents a method for generating potential beam layout scenarios incorporating the spatial layout of structural and architectural components and the engineer’s design experience. A detailed explanation of this method is provided in Section 3.
(2) Model training: Training GNN models
This study proposes a graph representation method for beam layout scenarios and GNN models. The GNN models were trained using preset potential beam layout data. This section aims to develop a GNN model that can accurately predict beam layout design outcomes, as described in Section 4.
(3) AI design: Beam layout prediction based on GNN models and rule-based post-processing correction.
The graph edge classification of potential beam layout scenarios is performed using a well-trained GNN model, and the structural beam layout can be predicted. In addition, this study offers a rule-based post-processing method based on engineering experience to improve the design quality of GNN-based beam layouts. Section 5 provides a detailed explanation of the post-processing method.
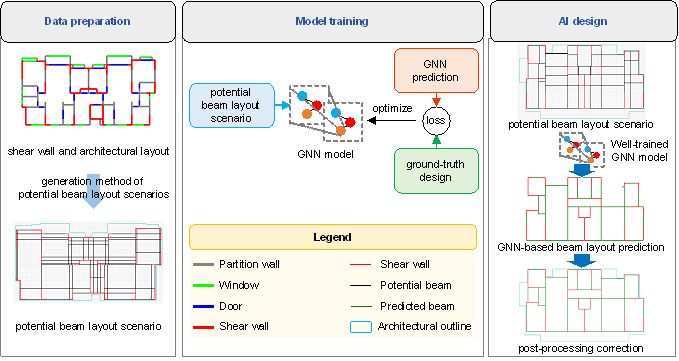
Figure 1 GNN-based beam layout design method for shear wall structures
3. Potential Beam Layout Scenarios and GNN Models
3.1. Graph representation and data augmentation methods
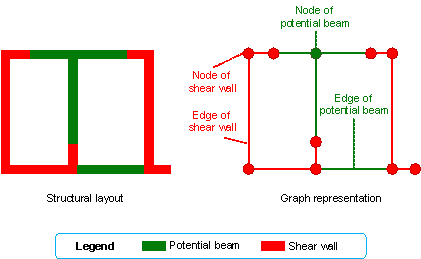
Figure 2 Graph representation schematic of potential beam layout scenarios
The graph data in this study consisted of node and edge features which were determined based on the approach described by Zhao et al. [15], and the graph feature representations for input are listed in Table 1. The edge features of the graph include the edge class, which is represented by one-hot encoding, positional features of the nodes at both ends of the edge (xone, yone, xtwo and ytwo), and length of the edge (ledge). The node features of the graph include the node class expressed in one-hot encoding and node location features (xn and yn). To normalize all coordinate features, LPlaneScale was utilized, as shown in Equation (1), and the coordinate normalization method is consistent with the approach of Zhao et al. [15].
|
cn = (co − ccenter) / LPlaneScale [15], |
(1) |
where cn represents the coordinate after normalization, co corresponds to the original coordinate. Furthermore, the center coordinate of the original shear wall layout graph is denoted as ccenter. Analysis of the dataset reveals that the majority of shear wall structures in this research possessed a plane span shorter than 60 m. Consequently, the value of LPlaneScale was set at 30 m, enabling the normalization of most structural coordinates within the range of [-1, 1].
The graph feature representations for output only have graph edge features, the categories of graph edges encoded by one-hot vectors. Specifically, [1, 0, 0] represents shear walls, [0, 1, 0] represents true beams, and [0, 0, 1] represents fake beams. If a potential beam is predicted to be a true beam, it means that the beam member will be placed at the location of this potential beam; otherwise, no beam will be placed.
Table 1 Node and edge features of graph data [15]
|
Node features |
Edge features |
|
Node of shear wall |
Edge of shear wall |
|
[1, 0, xn, yn] |
[1, 0, xone, yone, xtwo, ytwo, ledge] |
|
Node of potential beam |
Edge of potential beam |
|
[0, 1, xn, yn] |
[0, 1, xone, yone, xtwo, ytwo, ledge] |
Data augmentation is a commonly adopted technique to enhance the generalizability of machine learning models [16]. In this study, a data augmentation method that was consistent with the approach of Zhao et al. [15] was adopted for the beam layout of shear wall structures. This data augmentation method is appropriate because the beam layout is independent of the rigid body displacement, position, and angle of the structure during drawing. We applied four types of transformations: vertical flipping (two cases), counterclockwise rotation with an angle modulus of 90° (four cases), vertical translation between 0 and 20 m with a modulus of 2 m (21 cases), and horizontal translation between 0 and 20 m with a modulus of 2 m (21 cases). The data augmentation method was integrated into the GNN training process and increased the data volume by a factor of 3528 (2 × 4 × 21 × 21).
3.2. Potential Beam Layout Scenarios
As mentioned in Section 2, generating potential beam layout scenarios is a fundamental aspect of this study. The primary objective of this section is to introduce the methods used to generate these scenarios. In practical engineering applications, the beam layout in shear wall structures is typically associated with the layout of the shear walls and architectural components such as partition walls, doors, and windows. Therefore, this study primarily refers to the layouts of shear walls and architectural components when generating potential beam layout scenarios. Additionally, the expertise of an engineer is crucial for the design of the beam layout. Thus, this study provides rules that can enhance the feasibility of the beam layout when generating potential beam layout scenarios.
When generating potential primary beam layout scenarios, this study followed the following process:
Step 1: The basic axes are determined based on the endpoint and direction of the shear wall piers. For beam layout scenarios with architectural layout background, the basic axes are determined based on the endpoint and direction of the shear wall piers and nonstructural elements.
Step 2: The shear wall graph nodes are determined based on the intersections of the basic axes with the shear walls.
Step 3: The presence of potential primary beams between any pair of shear wall graph nodes is evaluated individually according to the proposed rules.
When generating the potential secondary beam layout scenarios, the subsequent steps are:
Step 4: Based on the potential primary beam layout scenario, the beam graph nodes are determined based on the intersections of the basic axes with potential primary beams and the intersections between potential primary beams.
Step 5: The presence of a potential secondary beam between one shear wall graph node and one beam graph node is assessed individually according to the proposed rules.
No conflict among the rules was observed in our methodology for deriving the potential beam layout scenarios. To illustrate using Scenario-NB-1, if the connection line between the two shear wall graph nodes does not meet the criteria of Rules 1–7, there is no potential primary beam between them. Consequently, for Scenario-NB-1, Rules 1–7 share equal precedence.
3.2.1. Primary beam layout scenarios without architectural layout background
The present study uses the term “architectural layout background” to denote the nonstructural elements in a building, including partition walls, doors, and windows, which demarcate interior spaces and affect the arrangement of structural beams. Beam layout scenarios without an architectural layout background signify that the potential layouts of the beams are generated solely based on the shear wall layout, and they do not consider the impact of the partition walls, doors, and windows.
This study provided 11 rules for potential beam layout scenarios, as illustrated in Figure 3. It should be noted that these rules may not be applied concurrently. This study explored the impact of various rule combinations on the beam layout.
Rule 1: Primary beams are those with both ends supported on shear walls.
Rule 2: Beams should fall within the architectural outline.
Rule 3: Inclined or curved beams are not considered; thus, the beams of interest are limited to horizontal and vertical beams.
Rule 4: The beam length must be within the range Lbmin to Lbmax. The Chinese technical specification for concrete structures of tall buildings [35] and the research conducted by Qian et al. [3] and Zhao et al. [24] indicate that the span-to-height ratio of frame beams in shear wall structures is typically between 10 and 18, and the height of frame beams is generally not less than 0.4 m. Therefore, a value of 8 m is considered reasonable for Lbmax in this study. Furthermore, based on the analysis of the shear wall structure data used in this study, the length of all beam segments is greater than 0.2 m, and therefore, Lbmin is set to 0.2 m.
Rule 5: Beams should not intersect the shear wall except at the ends.
Rule 6: Placing L-shaped cantilever beams at the ends of independent piers that are adjacent to the architectural outline is permissible. As illustrated in Figure 3a, this rule specifically applies to the corners of architectural outlines.
Rule 7: Both ends of a beam are not considered to be positioned simultaneously in the middle of a shear wall pier. Allowing such an arrangement would result in theoretically infinite number of beam layout scenarios.
Rule 8: There should be no shear walls on either side of the beam within the distance Ldist perpendicular to the beam, as shown in Figure 3b. Based on the shear wall structure data analyzed in this study, it was observed that over 98% of the beams were located at a side distance greater than 1.0 m from the shear wall. Hence, a value of 1.0 m was selected as the appropriate Ldist value for this study. Rule 8 states that arranging the beams adjacent to the shear wall to transfer the load is unnecessary if a shear wall already exists within a small range.
Rule 9: When the shear walls at both ends of a potential beam are perpendicular to the beam, and one side is the end of a very short independent wall pier (length less than Lwall, which is considered 0.2 m in this study), the beam will not be arranged. A very short shear wall pier is typically either the end portion of a long-wall pier or a protruding columnar structure that enhances wall stability. According to engineering experience, at the end of a very short wall pier, the beams are more likely to be arranged along the short pier rather than perpendicular to it, as illustrated in Figure 3c.
Rule 10: As shown in Figure 3d, in an actual engineering beam layout, two parallel independent wall piers often belong to the two sides of a room. It is often inappropriate for beams to separate architectural spaces. Therefore, when one end of the beam was placed in the middle of the shear wall pier and the other end was at the end of the independent shear wall pier, the beam should not be perpendicular to the independent shear wall pier.
Rule 11: Similar to Rule 10, when both ends of the independent wall piers are parallel and complete spatial integrity is considered, the beams should not be preset, as shown in Figure 3e.
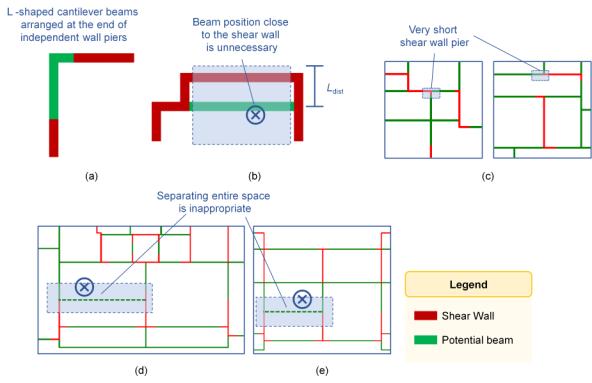
Figure 3 Schematic of potential beam layout rules: (a) Rule 6, (b) Rule 8, (c) Rule 9, (d) Rule 10, and (e) Rule 11
This study investigated three potential beam layout scenarios without an architectural layout background, which are named Scenario-NBs (No Background):
Scenario-NB-1: Rules 1–7 are considered.
Scenario-NB-2: Rules 1–9 are considered.
Scenario-NB-3: Rules 1–11 are considered.
Figure 4 illustrates the variations among the three scenarios for the same case.
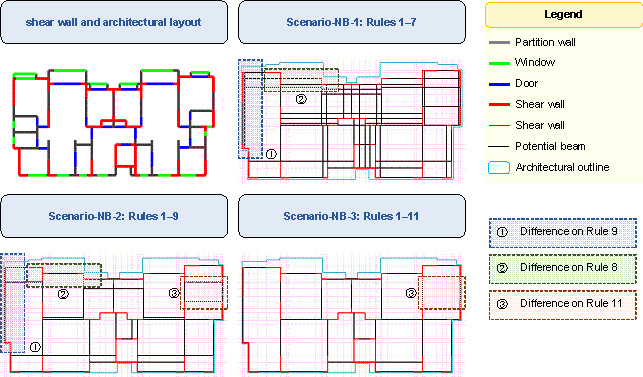
Figure 4 Three potential-beam-layout schematics of Scenario-NBs
3.2.2. Primary beam layout scenarios with architectural layout background
This section focuses on arranging the beams according to the background of the architectural layout. Specifically, it pertains to placing beams solely at the locations of nonstructural components, such as partition walls, doors, and windows. This process of arranging the beams involved the eight rules specified below: Seven of these rules are consistent with Rules 1–6 and Rule 8 in Section 3.2.1. The remaining rule was Rule 12.
Rule 12: All beams must be positioned only at locations where nonstructural components exist, such as partition walls, doors, and windows.
In this study, determining whether a potential beam should be preset was based on the proportion of the length of the architectural layout background to the length of the beam. If the proportion was less than Ratiolimit, no beams were arranged.
Two potential beam layout scenarios with architectural layout backgrounds were considered: Scenario-WB (“With Background”):
Scenario-WB-1: Rules 1–6 and Rule 12 are considered, and Ratiolimit = 0.1.
Scenario-WB-2: Rules 1–6, Rule 8, and Rule 12 are considered, and Ratiolimit = 0.4.
Figure 5 shows the differences between the two scenarios for the same case as in Figure 4. The shear wall layout, architectural layout, and legend shown in Figure 5 are consistent with those shown in Figure 4.
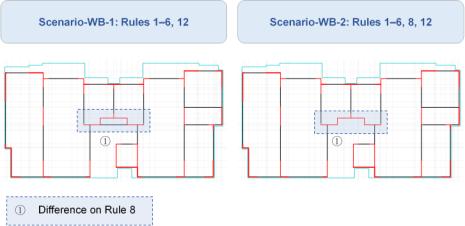
Figure 5 Two potential-beam-layout schematics of Scenario-WBs
3.2.3. Primary beam layout scenarios with hybrid rules
The arrangement of beams was investigated using hybrid rules that consider both shear wall layouts and nonstructural components such as partition walls, doors, and windows. The hybrid rules are necessary for two reasons, as illustrated in Figure 6. First, considering only the shear wall layout and no architectural component layout, it becomes exceedingly difficult to accurately place beams whose two ends are lapped in the middle of the shear wall piers, owing to the numerous possibilities, as demonstrated in ① in Figure 6. Second, solely arranging beams based on nonstructural components may result in situations where beams require placement. However, no architectural layout background is available, as shown in ② in Figure 6.
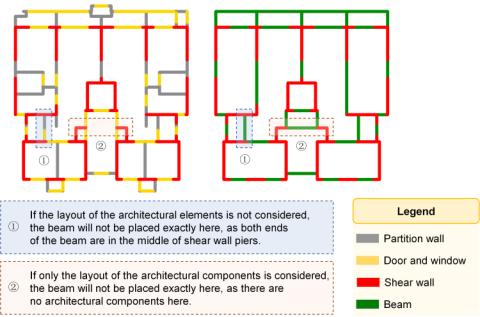
Figure 6 Structural and architectural layouts of structural case
Three potential beam layout scenarios with hybrid rules were considered: scenario-HRs (Hybrid Rules):
Scenario-HR-1: Scenario-NB-1 + Scenario-WB-1, that is, Rules 1–7 and Rule 12 are considered, and Ratiolimit is 0.1.
Scenario-HR-2: Scenario-NB-2 + Scenario-WB-2, that is, Rules 1–9 and Rule 12 are considered, and Ratiolimit is 0.4.
Scenario-HR-3: Scenario-NB-3 + Scenario-WB-2, that is, Rules 1–12 are considered, and Ratiolimit is 0.4.
Figure 7 depicts the variations among the three Scenario-HRs, which share the same case as in Figure 4. The shear wall and architectural layouts, as well as the legend, remain consistent with those presented in Figure 4.
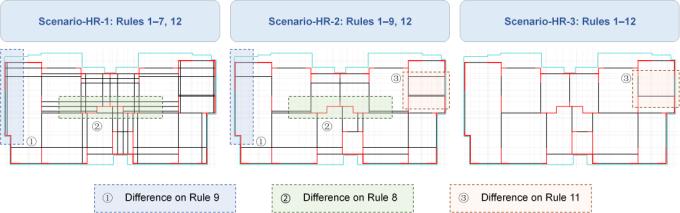
Figure 7 Three potential-beam-layout schematics of Scenario-HRs
3.2.4. Secondary beam layout scenarios
The secondary beam is crucial for the beam layout of shear wall structures. This study considered a secondary beam layout to enhance the quality of potential beam layout scenarios. When both ends of the secondary beam overlapped in the middle of the primary beam, the load was transferred entirely to the primary beam. The structural load transmission of such a beam was relatively less critical than that of a secondary beam with one end lapped by a shear-wall pier. Theoretically, a secondary beam with both ends lapped in the middle of the primary beam has a large possible space, resulting in a significant increase in the complexity of the graph data. Consequently, as a supplement to the primary beam layout scenario, the potential beam layout scenarios only consider secondary beams with one end supported on the shear wall and the other end supported on the primary beam. Secondary beams at both ends of the primary beam were not included.
The following rules are provided in this study, and a schematic is presented in Figure 8:
Rule 13: One end of the secondary beam is a shear wall, and the other is the primary beam. In Scenario-NB, the shear wall end of the secondary beam was not allowed to be in the middle of the shear wall pier.
Rule 14: Secondary beams do not intersect with shear walls or primary beams, except at the ends.
Rule 15: No shear walls or primary beams should be on either side of the secondary beam within the distance Ldist perpendicular to the secondary beam, as shown in Figures 8a and 8b. Similar to Rule 8, the value of Ldist is 1.0 m in this study. According to Rule 15, if there are already shear walls or primary beams in a close neighborhood, arranging the secondary beams next to the shear walls or primary beams is unnecessary for transferring the load.
Rule 16: As shown in Figure 8c, primary beams are often arranged along an independent shear wall pier. Supposing that the secondary beam is perpendicular to the independent shear wall pier, the entire architectural space is separated, which is inappropriate. Therefore, when the shear-wall end of the secondary beam is at the end of an independent shear-wall pier, the secondary beam should not be perpendicular to the independent shear-wall pier.
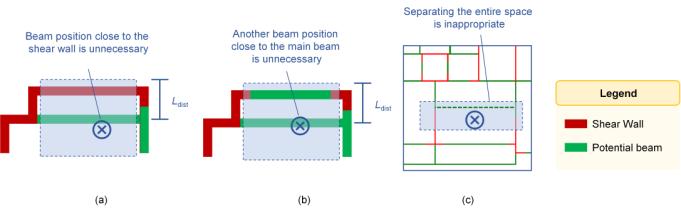
Figure 8 Schematic of potential beam layout rules for secondary beam layout scenarios
Two potential beam layout scenarios with secondary beams were considered, which are named Scenario-SB (Secondary Beam):
Scenario-SB-1: Rules 13–15 are considered.
Scenario-SB-2: Rules 13–16 are considered.
Based on a combination of the secondary beam and primary beam layouts, 24 potential beam layout scenarios were considered in this study, as listed in Table 2.
Table 2 Potential beam layout scenarios
|
No secondary beam |
Scenario-SB-1 |
Scenario-SB-2 |
|
|
Potential |
Scenario-NB-1 |
Scenario-NB-1-SB-1 |
Scenario-NB-1-SB-2 |
|
Scenario-NB-2 |
Scenario-NB-2-SB-1 |
Scenario-NB-2-SB-2 |
|
|
Scenario-NB-3 |
Scenario-NB-3-SB-1 |
Scenario-NB-3-SB-2 |
|
|
Scenario-WB-1 |
Scenario-WB-1-SB-1 |
Scenario-WB-1-SB-2 |
|
|
Scenario-WB-2 |
Scenario-WB-2-SB-1 |
Scenario-WB-2-SB-2 |
|
|
Scenario-HR-1 |
Scenario-HR-1-SB-1 |
Scenario-HR-1-SB-2 |
|
|
Scenario-HR-2 |
Scenario-HR-2-SB-1 |
Scenario-HR-2-SB-2 |
|
|
Scenario-HR-3 |
Scenario-HR-3-SB-1 |
Scenario-HR-3-SB-2 |
Figure 9 shows the difference in the structural case where the primary beam layout under Scenario-HR-3 is combined with different secondary beam layout scenarios.
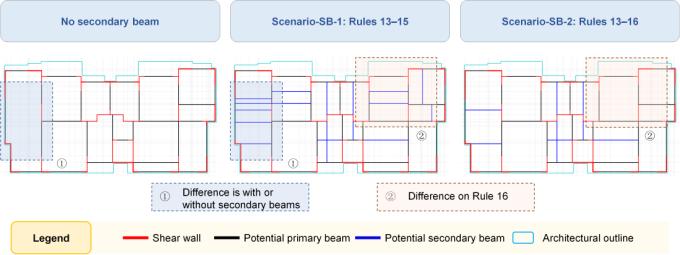
Figure 9 Schematics of different secondary beam layout scenarios
3.3. GNN Models
The GNN model proposed by Zhao et al. [15] performs well in the edge feature prediction task of shear wall structures and has the potential to handle the graph task of the shear wall structure. The task of the beam layout design for the shear wall structure in this study corresponded to graph-edge classification. Based on the GNN model proposed by Zhao et al. [15], three GNN models are discussed, as shown in Figure 10. The parameter definitions of the GNN models in Figure 10 are listed in Table 3 and are consistent with the results of Zhao et al. [15]. While the architecture of the proposed GNN model mirrors that of Zhao et al. [15], it possesses distinctive hyperparameter values. In this study, the dimension of the graph edge feature for output is set to 3, leading to an output dimension of 3 at the final layer of the GNN model. In contrast, the GNN model described by Zhao et al. [15] has an output dimension of 2.
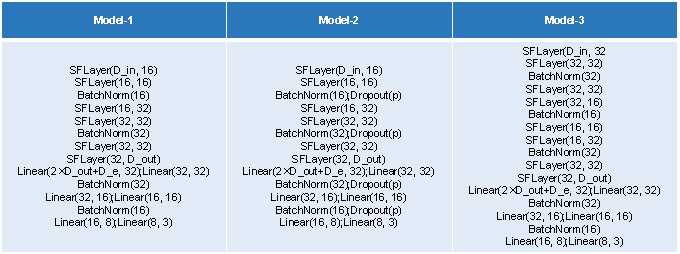
Figure 10 GNN models
Table 3 Parameter definitions GNN models [15]
|
Symbol |
Meaning |
|
SFLayer() |
GNN layer of Graph-SF model [29] |
|
Linear() |
MLP network layer, i.e., fully connected layer |
|
BatchNorm() |
Batch normalization layer |
|
Dropout() |
Dropout layer |
|
p |
Dropout rate, taken as 0.25 in the developed method |
|
D_in |
Dimensions of graph node features |
|
D_out |
Dimensions of graph node features output by GNN part, taken as 32 in the developed method |
|
D_e |
Dimensions of graph edge features |
For the edge classification problem of the GNN in this study, the cross-entropy loss function [15, 36] was adopted, as shown in Equation (2).
|
|
(2) |
where Nclass represents the number of classes for the edges, and Nsample signifies the total number of edge samples. The variable yjc is assigned a value of 1 when the true class of the j-th sample is equal to c; conversely, yjc is set to 0. Additionally, pjc denotes the predicted probability of the j-th sample belonging to class c [15, 36].
The hyperparameters of a neural network model have a direct impact on its performance [16, 21]. Therefore, this study considers two hyperparameters: batch size and learning rate. Specifically, three batch sizes of 32, 64, and 128 and three learning rates of 0.005, 0.001, and 0.0005 were discussed. In addition, k-fold cross-validation is a common method for selecting and comparing model effects [15-16]. This study used five-fold cross-validation.
4. Discussion of Potential Beam Layout Scenarios
4.1. Evaluation Method for Design Results
This study employed various potential beam layout scenarios. However, their accuracies could not be directly compared. This is because the graph data corresponding to different potential beam layout scenarios in this study are different, and the calculation of accuracy relies on the preset graph data. Therefore, an evaluation index that can be used to assess different potential beam layout scenarios is required. The core of the evaluation index used in this study was to compare the beam layout results designed using the GNN-based method with the ground truth results designed by engineers to calculate their similarity.
Several recent studies by Zhao et al. [15, 24-25] and Liao et al. [21] demonstrated that the similarity in the layout of the structural design corresponds directly to the similarity in the structural performance. The pixel-based intersection over union (IoU) index has a clear physical meaning and measures the similarity between the designs of AI and engineers [15]. Hence, this study employs the IoU index of the beam layout designed by the GNN and that designed by the engineer as the evaluation criteria (IoUbeam), following the approach described by Zhao et al. [15].
4.2. Results of Potential Beam Layout Scenarios
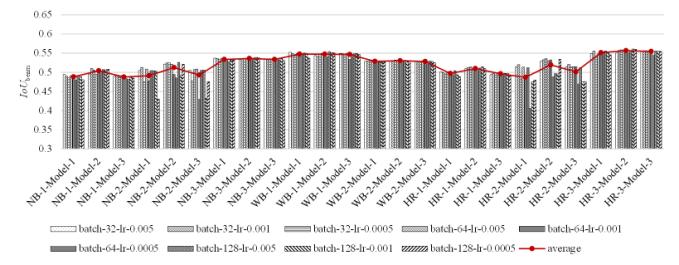
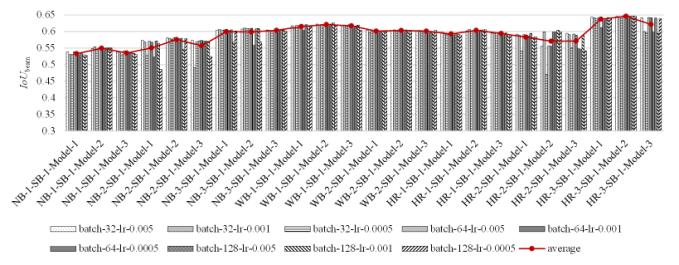
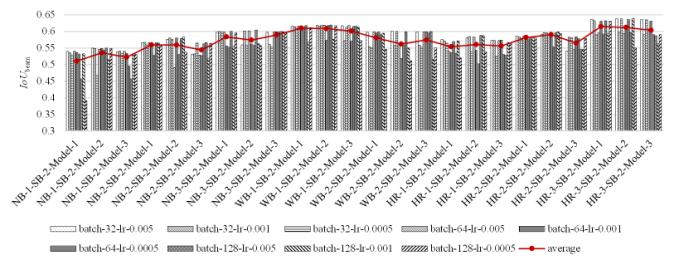
Figures 11a, 11b, and 11c illustrate the evaluation results for three different beam layout schemes: No secondary beam, Scenario-SB-1, and Scenario-SB-2, presented in Table 2. Figure 11 shows the IoUbeam indicators corresponding to the different GNN models and model hyperparameters for each potential beam layout scenario. The IoUbeam values shown in Figure 11 were calculated as the average of five-fold cross-validation results for each case.
(a)
(b)
(c)
Figure 11 Results of potential beam layout scenarios: (a) No secondary beam, (b) Scenario-SB-1, and (c) Scenario-SB-2
The findings presented in Figure 11 indicate that among the range of possible beam layout scenarios, Scenario-HR-3-SB-1-Model-2 yields the most favorable outcome. Consequently, Scenario-HR-3-SB-1 and Model-2 were chosen as the optimal beam layout scenario and GNN model for subsequent case studies.
The scenario with hybrid rules, Scenario-HR-3, is particularly effective. This surpasses both Scenario-NB and Scenario-WB, which ignore and only partially consider the architectural layout background, respectively. This is because both Scenario-NB and Scenario-WB possess a one-sided view of the impact of architecture and structural layout, leading to the defects highlighted in Figure 6. Moreover, Scenario-HR-3 employs more complex rule constraints than Scenario-HR-1 and Scenario-HR-2, indicating that the beam layout rules and their combinations established in this study are reasonable. The rule constraints of Scenario-HR-3 result in a significant decrease in the complexity of the graph data for beam layout scenarios and enhance the rationality of potential beam layout scenarios. Consequently, this is conducive to predicting the beam layout using GNN models.
The results obtained by considering the secondary beam were superior to those obtained without the secondary beam. Specifically, Scenario-SB-1 yields slightly better results compared to Scenario-SB-2. Scenario-SB-1 imposes fewer restrictions, thereby providing opportunities for arranging secondary beams.
Based on the average results of the nine hyperparameter conditions for each scenario presented in Figure 11, Model-2 outperforms Model-1 and Model-3 in most cases. This is because Model-2 incorporates both the batch normalization and dropout methods. For the data characteristics of this study, the simultaneous application of batch normalization and dropout methods can effectively prevent gradient explosion or gradient disappearance, speed up model convergence, and enhance training stability compared with Model-1 and Model-3. Additionally, Model-2 contains fewer GNN layers than Model-3, and this helps avoid overfitting when the shear wall samples are limited. This conclusion is supported by a study by Zhao et al. [15].
The scenarios sensitive to the batch size and learning rate include Scenario-SB-2, Scenario-NB-2, Scenario-HR-2, Scenario-NB-2-SB-1, and Scenario-HR-2-SB-1. In these scenarios, the histogram results exhibit greater fluctuations. Conversely, in other scenarios, the batch size and learning rate had minimal impact on the model’s effectiveness.
This study provides additional insights into the impact of information adequacy on the beam layout results, as depicted in Figure 12. The figure shows the optimal IoUbeam among Scenario-NB, WB, and HR for three scenarios: No secondary beam, Scenario-SB-1, and Scenario-SB-2. The findings in Figure 12 are consistent with those of prior research, with Scenario-HR outperforming Scenario-WB and NB. This outcome can be attributed to the careful consideration of both architectural and structural layout information, which addresses the limitations presented in Figure 6, when only one type of layout impact is considered. Moreover, Scenario-SB-1 yields better results than Scenario-SB-2 with no secondary beam owing to Scenario-SB-1 having lighter constraints, which enable a larger possibility space for the secondary beam layout than in Scenario-SB-2.
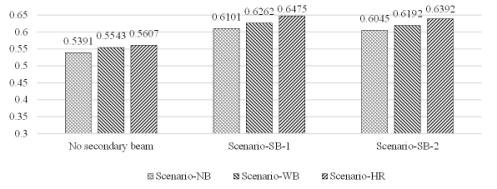
Figure 12 Impact of adequacy of information according to results
5. Case Studies
5.1. Case Results
Scenario-HR-3-SB-1-Model-2, which had the best effect, was adopted to study 30 engineering cases in the test set. As shown in Figure 11b, the batch size and learning rate do not have a significant impact on the performance of Scenario-HR-3-SB-1-Model-2. Therefore, in this study, these values are 64 and 0.001, respectively. Table 4 lists the mean and standard deviation of IoUbeam for the 30 test case design results directly generated by the GNN model. According to Liao et al. [21] and Zhao et al. [15], an IoU index greater than 0.5 indicates that the design results of AI and engineers are highly similar. In this study, the average value of IoUbeam reached 0.7864, illustrating the high similarity between the beam layout designed by the GNN and the engineer’s design. Figure 13 shows typical cases, and Appendix A shows the results of the test set. It can be observed from Table 4, Figure 13, and Appendix A that the GNN can generate a relatively perfect beam layout that is highly similar to an engineer’s design.
Table 4 Mean value and standard deviation of IoUbeam of GNN-based beam layout design
|
GNN-based beam layout design |
|
|
Mean |
0.7864 |
|
Standard deviation |
0.0867 |

Figure 13 Test case results of GNN-based design
5.2. Post-processing Optimization
Although the beam layout generated by the GNN is highly similar to that of the engineer’s design, there are still obvious defects in some cases, as illustrated in Figure 14. These deficiencies may occur concurrently and can take the following form:
(1) The connection is missing at the edge of the architectural outline, which is often a corner-shaped beam, as shown in ①, ②, and ③ in Figure 14.
(2) There are cantilever beams, as shown in ④ in Figure 14.
(3) There are shear wall ends where beams are not arranged, as shown in ①, ②, ③, and ④ in Figure 14.
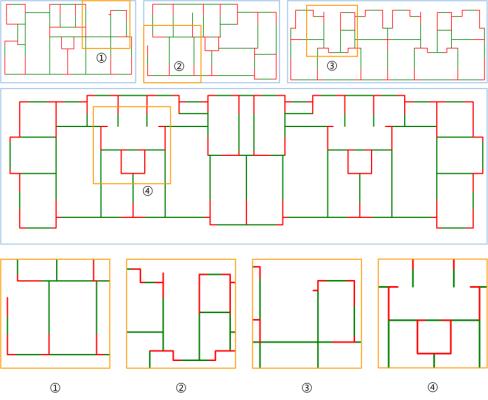
Figure 14 Defects in beam layout generated by GNN models
Specifically, this study proposes post-processing correction methods:
(1) The potential beams situated on the edge of the architectural outline and those not predicted as beams by the GNN as beam layouts are corrected. The beams were specifically arranged at the ends of independent shear wall piers located on the edge of the architectural outline.
(2) The cantilever beam is removed.
(3) Beams are extended along the shear wall piers without lapped beams until they intersect with the shear walls or beams, ensuring that they meet the beam length requirements as per Rule 4.
Table 5 shows the IoUbeam average after post-processing the design results directly generated by the GNN model. Furthermore, Figure 15 shows the post-processing results for the case depicted in Figure 14. It can be observed from Table 5 and Figure 15 that IoUbeam has improved, and the defects mentioned in Figure 14 have been corrected. Appendix A provides a comprehensive overview of the test-set results.
Table 5 Mean value and standard deviation of IoUbeam of post-processing correction after GNN-based design
|
Post-processing correction after GNN-based design |
|
|
Mean |
0.7919 |
|
Standard deviation |
0.0997 |

Figure 15 Post-processing correction after GNN-based design
5.3. Mechanical Performance
Two test-set structures (Case 1 and Case 4 in Appendix A) are used as cases for mechanical analysis. The seismic design intensity of Case 1 is 8° (the PGA of the design basis earthquake is 200 cm/s2), and the height of Case 1 is 75 m. The seismic design intensity of Case 4 is 7° (the PGA of the design basis earthquake is 100 cm/s2), and the height of Case 1 is 39 m. Their floor heights are all 3 m. Case 1 – Engineer and Case 4 – Engineer represent the beam layout results designed by the engineers of Case 1 and Case 4, respectively. Case 1 – GNN and Case 4 – GNN represent the beam layout results designed by the proposed GNN method of Case 1 and Case 4, respectively. Figure 16 illustrates the inter-story drift ratios of the cases designed by the engineer and the proposed GNN method. Figure 17 shows the vertical displacements of the typical floor slabs of the cases under gravity load.
As can be seen from Figure 16, the inter-story drift ratio of the engineers’ design result is highly similar to that of the GNN’s design result. Figure 17 shows that the vertical typical-floor-slab displacement of the engineers’ design result is close to that of the GNN’s design result, and the difference in their maximum vertical displacements is less than 1 mm. Therefore, the case study shows that the mechanical properties of the design results of the proposed GNN method are similar to the engineers’ design results.
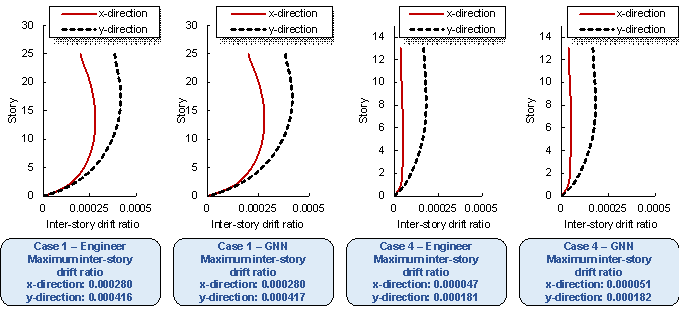
Figure 16 Inter-story drift ratios of cases designed by the engineer and the proposed GNN method

Figure 17 Vertical typical-floor-slab displacement cloud diagrams of cases designed by the engineer and the proposed GNN method
6. Conclusions
This paper introduced a GNN model and a generation method for potential beam layout scenarios that consider architectural and structural component layouts, as well as the experience of engineers. Using the GNN model, the graph edge classification of potential beam layout scenarios was performed to achieve a beam layout design for shear wall structures. The test cases demonstrated that the GNN-based design method presented in this paper produces beam layout designs that highly resemble those created by engineers.
(1) This study thoroughly explored the potential beam layout scenarios for shear wall structures. Three different scenarios were discussed. A hybrid consideration of architectural and structural component layouts can provide a more comprehensive potential beam layout scenario than solely considering architectural or structural component layouts.
(2) Three potential secondary beam-layout schemes are presented as supplements to the primary beam-layout scheme. The inclusion of secondary beams enhances the completeness of the potential beam layout.
(3) Three GNN models and their corresponding hyperparameters were explored. The optimal result was achieved based on a combination of Scenario-HR-3-SB-1 and Model-2, outperforming the other scenarios and models. Scenario-HR-3-SB-1 is a fusion of Scenario-HR-3, which comprehensively considers the layout of the shear walls, partition walls, doors, and windows, and Scenario-SB-1, which supplements the layout of the secondary beams. Meanwhile, Model-2 provides a more stable model training process and avoids overfitting.
(4) A post-processing correction method was proposed to enhance the beam layout design results generated by the GNNs. The case study demonstrates that this correction method can improve the feasibility of the GNN-generated beam layouts and increase the average IoUbeam values of the test cases.
This paper presents a GNN-based beam layout design method for shear wall structures and shows feasibility. However, the proposed method still has some limitations, and several improvements still need to be made:
(1) The proposed approach does not factor in cantilever beams at balconies. The generation of cantilever beams at balconies needs to be further improved.
(2) The rules for generating layout scenarios of potential primary and secondary beams could benefit from further refinement and enhancement.
Declaration of Competing Interest
The authors declare that they have no known competing financial interests or personal relationships that could have appeared to influence the work reported in this paper.
Acknowledgments
References
[1] CTBUH, Tall buildings in 2019: another record year for supertall completions, CTBUH Research, 2019. https://www.skyscrapercenter.com/research/CTBUH_ResearchReport_2019YearInReview.pdf
[2] R. Perez, A. Carballal, J.R. Rabuñal, M.D. García-Vidaurrázaga, O.A. Mures, Using AI to simulate urban vertical growth, CTBUH Journal, Issue III, 2019. https://global.ctbuh.org/resources/papers/download/4212-using-ai-to-simulate-urban-vertical-growth.pdf
[3] J.R. Qian, Z.Z. Zhao, X.D. Ji, L.P. Ye, Design of tall building structures, Third Edition, China Architecture & Building Press, 2018, ISBN: 9787112216840 (in Chinese)
[4] P.S. Shen, Design of tall building structures, Third edition, China Architecture & Building Press, 2017, ISBN: 9787112210053 (in Chinese)
[5] A. Nimtawat, P. Nanakorn, Automated layout design of beam-slab floors using a genetic algorithm, Computers & Structures 87 (2009) 1308–1330, https://doi.org/10.1016/j.compstruc.2009.06.007
[6] A. Nimtawat, P. Nanakorn, A genetic algorithm for beam–slab layout design of rectilinear floors, Engineering Structures 32 (2010) 3488–3500, https://doi.org/10.1016/j.engstruct.2010.07.018
[7] C.M. Herr, T. Fischer, A notation to aid column and beam layout design for reinforced concrete construction in China, In: CAADRIA 2014: Proceedings of the 19th International Conference on Computer-Aided Architectural Design Research in Asia, 2021 Jun 20–25, Hong Kong, China, pp. 399–408, https://doi.org/10.52842/conf.caadria.2014.399
[8] C.M. Herr, R.C. Ford, Cellular automata in architectural design: from generic systems to specific design tools, Automation in Construction 72 (2016) 39–45, https://doi.org/10.1016/j.autcon.2016.07.005
[9] Y. Zhang, C. Mueller, Shear wall layout optimization for conceptual design of tall buildings, Engineering Structures 140 (2017) 225–240, https://doi.org/10.1016/j.engstruct.2017.02.059
[10] M. Mangal, J.C.P. Cheng, Automated optimization of steel reinforcement in RC building frames using building information modeling and hybrid genetic algorithm, Automation in Construction 90 (2018) 39–57, https://doi.org/10.1016/j.autcon.2018.01.013
[11] S. Tafraout, N. Bourahla, Y. Bourahla, A. Mebarki, Automatic structural design of RC wall-slab buildings using a genetic algorithm with application in BIM environment, Automation in Construction 106 (2019) 102901, https://doi.org/10.1016/j.autcon.2019.102901
[12] S. Sotiropoulos, G. Kazakis, N.D. Lagaros, Conceptual design of structural systems based on topology optimization and prefabricated components, Computers & Structures 226 (2020) 106136, http://doi.org/10.1016/J.COMPSTRUC.2019.106136
[13] J. Liu, S. Li, C. Xu, Z. Wu, N. Ao, F. Chen, Automatic and optimal rebar layout in reinforced concrete structure by decomposed optimization algorithms, Automation in Construction 126 (2021) 103655, https://doi.org/10.1016/j.autcon.2021.103655
[14] X. Zhou, L. Wang, J. Liu, G. Cheng, D. Chen, P. Yu, Automated structural design of shear wall structures based on modified genetic algorithm and prior knowledge, Automation in Construction 139 (2022) 104318, https://doi.org/10.1016/j.autcon.2022.104318
[15] P.J. Zhao, W.J. Liao, Y.L. Huang, X.Z. Lu, Intelligent design of shear wall layout based on graph neural networks, Advanced Engineering Informatics 55 (2023) 101886, https://doi.org/10.1016/j.aei.2023.101886
[16] S.J. Russell, P. Norvig, Artificial intelligence: a modern approach, Fourth Edition, Hoboken: Pearson, 2021, http://aima.cs.berkeley.edu/
[17] C. Xiong, Q.S. Li, X.Z. Lu, Automated regional seismic damage assessment of buildings using an unmanned aerial vehicle and a convolutional neural network, Automation in Construction 109 (2020) 102994, https://doi.org/10.1016/j.autcon.2019.102994
[18] Y.F. Fei, W.J. Liao, Y.L. Huang, X.Z. Lu, Knowledge-enhanced generative adversarial networks for schematic design of framed tube structures, Automation in Construction 144 (2022) 104619, https://doi.org/10.1016/j.autcon.2022.104619
[19] P.N. Pizarro, L.M. Massone, F.R. Rojas, R.O. Ruiz, Use of convolutional networks in the conceptual structural design of shear wall buildings layout, Engineering Structures 239 (2021) 112311, https://doi.org/10.1016/j.engstruct.2021.112311
[20] P.N. Pizarro, L.M. Massone, Structural design of reinforced concrete buildings based on deep neural networks, Engineering Structures 241 (2021) 112377, https://doi.org/10.1016/j.engstruct.2021.112377
[21] W.J. Liao, X.Z. Lu, Y.L. Huang, Z. Zheng, Y.Q. Lin, Automated structural design of shear wall residential buildings using generative adversarial networks, Automation in Construction 132 (2021) 103931, https://doi.org/10.1016/j.autcon.2021.103931
[22] X.Z. Lu, W.J. Liao, Y. Zhang, Y.L. Huang, Intelligent generative design of shear wall structures using physics-informed generative adversarial networks, Earthquake Engineering & Structural Dynamics 2022, https://doi.org/10.1002/eqe.3632
[23] W.J. Liao, Y.L. Huang, Z. Zheng, X.Z. Lu, Intelligent generative structural design method for shear wall building based on “fused-text-image-to-image” generative adversarial networks, Expert Systems with Applications 210 (2022) 118530, https://doi.org/10.1016/j.eswa.2022.118530
[24] P.J. Zhao, W.J. Liao, H.J. Xue, X.Z. Lu, Intelligent design method for beam and slab of shear wall structure based on deep learning, Journal of Building Engineering 57 (2022) 104838, https://doi.org/10.1016/j.jobe.2022.104838
[25] P.J. Zhao, W.J. Liao, Y.L. Huang, X.Z. Lu, Intelligent design of shear wall layout based on attention-enhanced generative adversarial network, Engineering Structures 274 (2023) 115170, https://doi.org/10.1016/j.engstruct.2022.115170
[26] W.L. Hamilton, Graph representation learning, synthesis lectures on artificial intelligence and machine learning, 14 (2020) 1–159, https://doi.org/10.2200/S01045ED1V01Y202009AIM046
[27] Y. Ma, J. Tang, Deep learning on graphs, Cambridge University Press, 2021, https://doi.org/10.1017/9781108924184
[28] K.H. Chang, C.Y. Cheng, Learning to simulate and design for structural engineering, In: PMLR 119: Proceedings of the 37th International Conference on Machine Learning, 2020 Jul 13–18, Online, 2020, pp. 1426–1436, https://doi.org/10.48550/arXiv.2003.09103
[29] P.J. Zhao, W.J. Liao, Y.L. Huang, X.Z. Lu, Intelligent beam layout design for frame structure based on graph neural networks, Journal of Building Engineering 63 (2023) 105499, https://doi.org/10.1016/j.jobe.2022.105499
[30] N. Nauata, K.H. Chang, C.Y. Cheng, G. Mori, Y. Furukawa, House-GAN: Relational generative adversarial networks for graph-constrained house layout generation, In: ECCV 2020: 16th European Conference on Computer Vision, 2020 Aug 23–28, Glasgow, UK, Cham: Springer, 2020, pp. 162–177, https://doi.org/10.1007/978-3-030-58452-8_10
[31] N. Nauata, S. Hosseini, K.H. Chang, H. Chu, C.Y. Cheng, Y. Furukawa, House-GAN++: Generative adversarial layout refinement network towards intelligent computational agent for professional architects, In: CVPR 2021: Proceedings of the IEEE/CVF Conference on Computer Vision and Pattern Recognition, 2021 Jun 20–25, Nashville, TN, USA, IEEE, 2021, pp. 13632–13641, https://doi.org/10.1109/CVPR46437.2021.01342
[32] K. Hayashi, M. Ohsaki, Graph-based reinforcement learning for discrete cross-section optimization of planar steel frames, Advanced Engineering Informatics 51 (2022) 101512, https://doi.org/10.1016/j.aei.2021.101512
[33] P. Hawkins, F. Maire, S. Denman, M. Baktashmotlagh, Modular construction planning using graph neural network heuristic search, Australasian Joint Conference on Artificial Intelligence, Springer, Cham, 2022: 228–239, https://doi.org/10.1007/978-3-030-97546-3_19
[34] T. Ma, Grpah neural networks: Fundamentals and frontiers, Beijing: Publishing House of Electronics Industry, 2021, ISBN: 9787121405020 (in Chinese)
[35] JGJ3–2010, Technical specification for concrete structures of tall building, China Architecture & Building Press, Beijing, 2010 (in Chinese)
[36] C. Szegedy, V. Vanhoucke, S. Ioffe, J. Shlens, Rethinking the inception architecture for computer vision, Proceedings of the IEEE conference on computer vision and pattern recognition, 2016: 2818–2826, https://doi.org/10.1109/CVPR.2016.308
Appendices
Appendix A. All Results of Case Studies
Figure A.1 shows a comparison of the designs of the engineer and GNN, and the results of post-processing corrections to the GNN design for all 30 test cases.
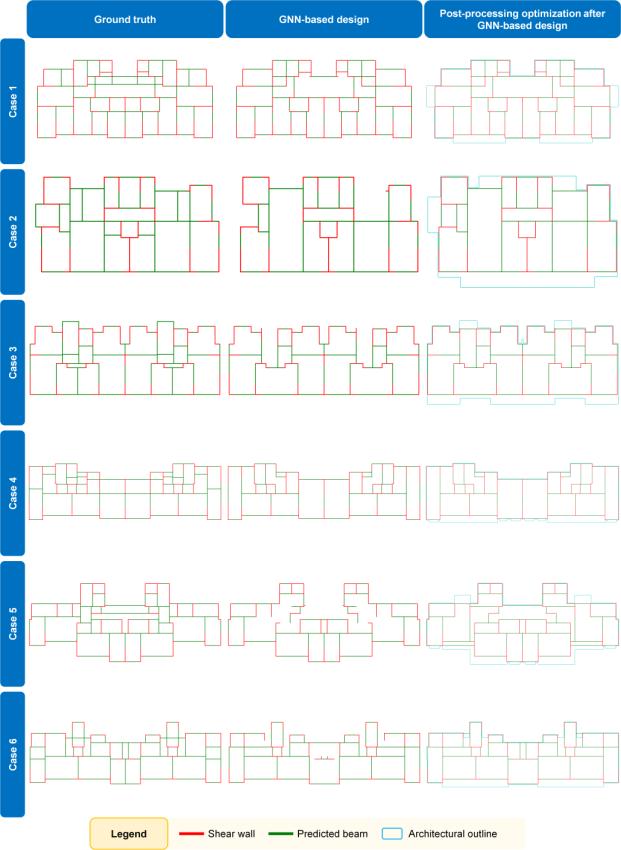
(a)

(b)

(c)
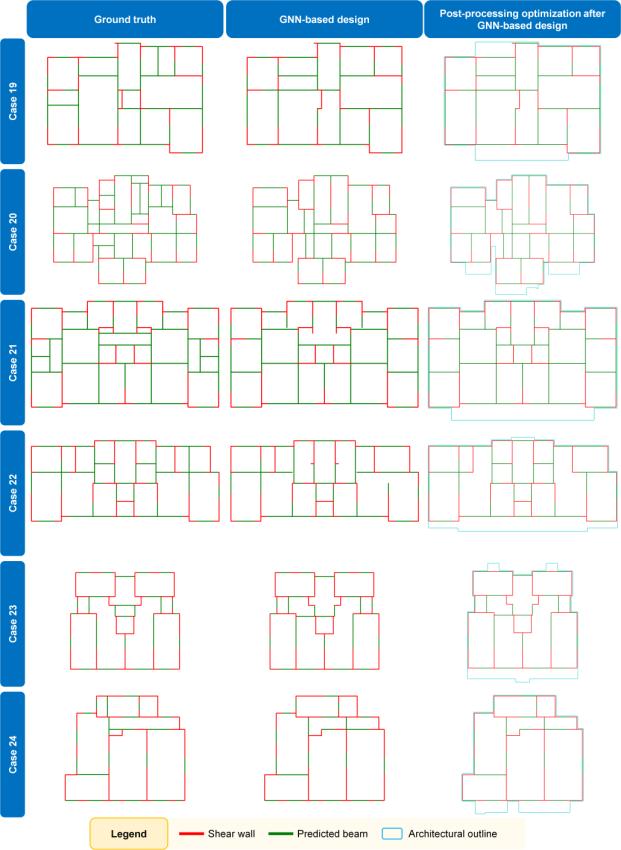
(d)
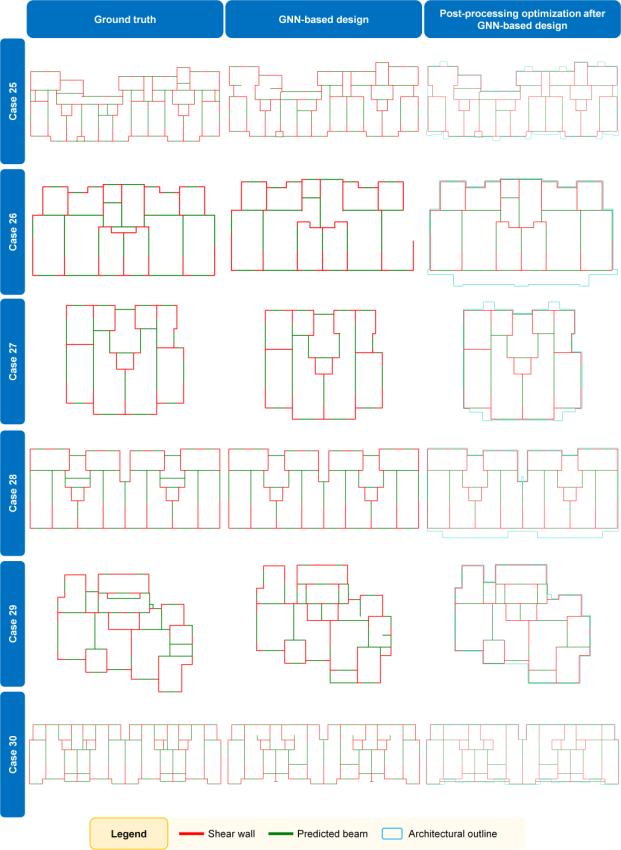
(e)
Figure A.1 GNN-based design and post-processing correction after GNN-based design of all test cases. (a) Cases 1–6. (b) Cases 7–12. (c) Cases 13–18. (d) Cases 19–24. (e) Cases 25–30