1 Introduction
Reinforced concrete (RC) frames, commonly used to resist vertical and horizontal loads, have traditionally been designed through extensive engineering experience and iterative verification processes involving labor-intensive calculations and analyses. This conventional approach, while robust, tends to be time-consuming and highly dependent on engineering expertise. Recent advancements in artificial intelligence (AI) offer transformative opportunities for civil engineering [1�C3] , harnessing existing data to learn from past designs and efficiently determine optimal structural dimensions that meet specifications. Therefore, this study aims to efficiently and accurately achieve component size design for RC frame structures.
The intelligent design of RC frame sections primarily employs two approaches: optimization and generative AI designs. Optimization design aims to refine component sizes based on inherently slow evaluation of mechanical performance and material consumption [4] . In contrast, generative AI design learns from existing drawings, identifies design patterns, and quickly determines appropriate section sizes [5] .
(1) Existing studies have explored optimization techniques, initially using gradient [6,7] or Lagrange multipliers [8,9] approaches and later incorporating heuristic algorithms such as evolutionary algorithms [10,11] , particle swarm optimization [12,13] , and harmony search [14] . These methods, which involve evaluating the structural performance under seismic and gravity loads [15�C17] , are precise but often inefficient, potentially taking hours. Recent developments have integrated neural networks with surrogate models to accelerate the optimization process [18] , though still time-consuming, taking 2 to 4 minutes, and prone to localized design flaws due to fictional structural design datasets, making it challenging to learn fundamental project design rules. Since engineers often desire WYSIWYG (what you see is what you get) and real-time design feedback, some researchers have proposed generative AI design methods.
(2) Generative AI design simplifies the process by eliminating the complex optimization stages inherent in traditional optimization-based methods. By learning from existing designs, AI can consistently perform design tasks, minimizing biases associated with subjective optimization constraints and objective functions. However, to achieve the design of RC frame structures, a high-quality dataset that includes design conditions, structural layout, and component sizes from real-world engineering cases is needed. Currently, there is a lack of such datasets. Chang et al. [19] constructed a virtual dataset for RC frame structures through random sampling and optimization. They used graph neural networks (GNNs) to predict sizes, demonstrating the feasibility of generative AI. However, due to the fictitious nature of the data, this method still exhibits significant discrepancies from actual engineering design results, not fully aligning with real design experience. Despite the challenges of the limited availability of high-quality datasets of RC frames, successful applications in many other structures have showcased the potential of generative AI design. For instance, Liao et al. [20] developed an intelligent design method for shear wall structure layouts using generative adversarial networks (GANs). This was followed by enhancement through embedding domain knowledge [21] , physical rules [22] , and attention mechanisms [23] . Building on these foundations, Fei et al. [24] proposed a method for the component sizes of core tube frame structures, while Feng et al. [25] applied the approach to the component sizes of shear wall structures. Nevertheless, all these methods are based on pixel-based images and have the following limitations: (a) It treats the structural plan as a whole input, focusing more on the overall structure information and making it difficult to consider the relationships between different components. In the size design of RC frame structures, the sizes of components are determined not only by global information but also closely related to the surrounding components. (b) The pixel-based method can only input two-dimensional plans and is unable to account for vertical connections between components. (c) Since slabs occupy a large proportion of the structural plan, the pixel-based method tends to overemphasize the role of slabs while neglecting the design of beams and columns. (d) Each pixel in the pixel-based method is unstructured, making it challenging to reflect the topology of beams, columns, and slabs based on the information within the pixels.
Considering the complex nature of frame topologies, it is logical to employ GNNs and develop graph-based representations of frame structures. Existing studies have adopted graph-based approaches. For example, HouseGAN and HouseGAN++ used graph nodes to represent rooms within a building [26,27] and predict architectural layouts. Chang et al. [19] represented beams and columns in RC frame structures as nodes with identical feature dimensions, differentiating them by a unique characteristic. Zhao et al. [28] employed GNNs to predict the arrangement of beams between columns in frame structures, comparing three graph representation methods: nodes representing beams, nodes representing columns, and nodes representing both beams and columns. Zhang et al. [29] utilized a structure topology-generative adversarial network (StrucTopo-GAN) to generate layouts for complex structures, with nodes representing intersections and columns and edges representing beams and walls. Zhang et al. [18] represented component intersections as nodes and beams and columns as edges but required the same dimensions of connected beams and columns when optimizing beam sizes. These studies suggest that using nodes and edges to represent components within frame structures is feasible. However, if slabs are further introduced, they cannot be represented by edges due to their planar nature and thus can only be represented by nodes. Currently, no universal method exists that can accurately represent all components of frames and adequately distinguish their differences. Existing methods consider beams and columns as identical components, making it impossible to assign distinct characteristics for individual designs. Additionally, incorporating slabs into the design within GNNs is challenging.
In summary, the generative AI design for component sizes of RC frame structures faces several challenges: (1) Data formats for RC frame structure component sizes vary widely, and there's no standardized dataset; (2) Current generative AI design methods for component sizes do not consider the structural topology, and there's no universal graph representation method for RC frame structures; (3) Conventional GNNs struggle to discern the feature differences among beam, column, and slab components.
To address these issues, this study introduces a generative AI design method for sizing RC frame structures using heterogeneous graph neural networks (HetGNNs). The approach begins by deriving a standardized dataset from engineering drawings and then developing a heterogeneous graph representation universally applicable to RC frames with nodes that distinguish between beams, slabs, and columns. This approach facilitates a detailed expression of structural topology attributes. Building on HetGNNs [30,31] , a generative model suitable for designing RC frames was proposed. The impact of critical parameters was analyzed, and parametric modeling and floor assembly of the structural model were carried out, along with mechanical verification, to ensure structural reliability.
This paper is organized as follows: Section 2 introduces the proposed method and details the implementation, Section 3 presents the experimental results, analyses, discussions, and case studies, and Section 4 summarizes the research findings.
2 HetGNN-based component size design
2.1 HetGNN
Heterogeneous graphs [32] , which include multiple types of nodes and links, are widely used in various domains, such as social networks and recommendation systems. For instance, in a book recommendation system, nodes may include users and books, with links representing relationships like user-to-user friendships, user-to-book recommendations, and book-to-book similarities.
Research on GNNs predominantly targets homogeneous graphs of a single type of node and edge [33] , which is inadequate for heterogeneous graphs. The primary reasons include the following two points: (1) In heterogeneous graphs, nodes and edges of different types may have distinct attributes and semantic meanings, requiring different processing approaches. Conversely, homogeneous graphs employ the same processing approach for all nodes. (2) Traditional GNNs aggregate messages from neighboring nodes when updating node features. However, in heterogeneous graphs, different types of neighbors have varying impacts on nodes, making it difficult for traditional aggregation mechanisms to distinguish these differences. These inadequacies necessitates the development of specialized HetGNNs.
Implementing HetGNNs involves using different encoders to map the features of diverse nodes into a unified feature space. Subsequently, message passing and aggregation are performed based on these node features and the relationship defined by the edges. Message passing is accomplished with equal weights for each edge type [30] or by employing an attention mechanism to dynamically learn the weights of node messages [34] , enhancing the model��s ability to capture complex dependencies.
This study develops a specific HetGNN model to address the component design challenges of RC frame structures. This model effectively enables distinct expression and message passing of different node types, capturing the unique properties and interactions of beams, columns, and slabs. This approach ensures accurate and efficient design optimization, leveraging the heterogeneous nature of the structural components.
2.2 Framework
The study comprises two phases: training and design. The primary framework for the method is illustrated in Figure 1.
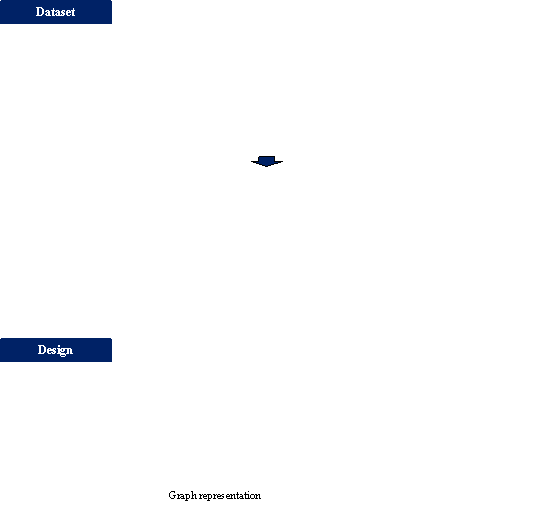
Figure 1. Method for designing component sizes in RC frame structures.
First, a substantial collection of CAD drawings for RC frame structures is gathered, from which axis lines and component sizes are extracted to create a standardized dataset for RC frame structures.
The training phase consists of two steps: graph representation and model training. First, a preprocessing method is designed to convert CAD drawings into graphs. This method uses different types of nodes to represent beams, columns, and slabs, storing each component's unique features in the corresponding nodes. Subsequently, HetGNN is employed to learn the design patterns for RC frame structure component sizes. The model is trained using the Mean Squared Error (MSE) loss function, which measures the differences between the predicted and actual sizes of beams, columns, and slabs. This helps create a predictive model for component sizes.
In the design phase, axial information is extracted from CAD drawings, and graphs are constructed using the same preprocessing method as in the training phase. These graphs are then input into the trained HetGNN model to obtain the design outcomes for component sizes. Finally, multiple floors of the same building are automatically assembled and modeled to validate the design results.
2.3 Dataset
This study compiled a dataset from 95 RC frame structures, encompassing 298 standard stories from real-world engineering projects. The data originated from these projects were designed by well-established design institutes, ensuring high rationality and suitability for AI-driven design purposes. Secondary beams support slabs and transfer loads to the primary beams. They are straightforward to design to carry tributary loads from the slabs they support [35] . Therefore, they are not the focus of this research. Although this exclusion slightly underestimates the stiffness in analysis, it has minimal influence on the primary beam sizes. In the scope of the study, "beams" refer exclusively to primary beams. The parameters included in this RC frame structure dataset are detailed in Table 1.
Table 1. Parameters of the RC frame structure dataset
|
Type |
Representation |
Parameters |
|
Beam |
Horizontal line |
Beam width, beam height |
|
Column |
Vertical line |
Column section length in the x and y directions |
|
Slab |
Text |
Slab area, number of slab edges, room type, slab load, slab thickness |
|
Reference point |
Circle |
None (used for floor assembly) |
|
Standard story |
Table |
Total number of stories, starting floor, ending floor, story height, PGA, site class, anti-seismic grade, design earthquake grouping, concrete grade of beams, columns and slabs, total length in x and y direction |
In Table 1, the "starting floor" refers to the lowest natural story of a specific standard story, while the "ending floor" indicates the highest natural story of the same standard story. PGA stands for peak ground acceleration, representing the level of ground motion associated with a design basis earthquake (i.e., a 10% probability of exceedance in 50 years). Site class categorizes the soil conditions at a specific location. The anti-seismic grade is a classification system used by design departments to specify the seismic design requirements for buildings and structures in compliance with Chinese national regulations and standards. Design earthquake grouping is a parameter that assesses the effects of earthquake magnitude and epicentral distance on seismic design. According to China's "Code for Seismic Design of Buildings" [36] , seismic design for RC frame structures relies on the PGA, site class, anti-seismic grade, and design earthquake grouping.
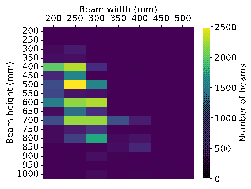
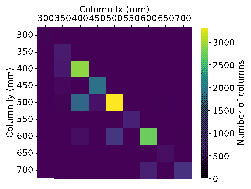
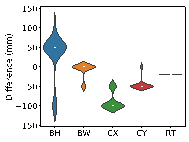
The size distributions of beams, columns, and slabs were statistically analyzed to understand the RC frame structure dataset better, as illustrated in Figure 2.
|
|
|
|
(a) Size distribution of beams |
(b) Size distribution of columns |
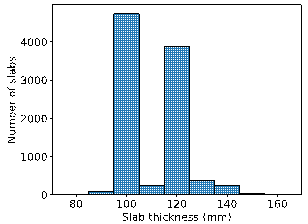
(c) Size distribution of slabs
Figure 2. Statistical size distribution of beams, columns, and slabs.
The statistical data reveal that the widths of beams are mainly between 200 and 300 mm, while the heights range primarily from 400 to 800 mm, often in multiples of 100 mm. The cross-sections of columns are typically square, with lengths in both the x and y directions primarily distributed between 400 and 700 mm. In some cases, the length in the y direction exceeds that in the x direction. Slab thicknesses are generally concentrated around two values: 100 and 120 mm.
To compare the effectiveness of different models, the dataset was divided into training, validation, and test sets in a 6:2:2 ratio. The training, validation, and test sets consist of 57, 19, and 19 buildings, respectively.
However, the dataset still has some limitations. The data volume is relatively limited and needs further expansion. Additionally, it does not yet consider architectural design requirements, such as clear height, which can be further supplemented and refined in future work.
2.4 Graph representation
To use HetGNNs for prediction, the CAD drawings in the dataset must first be converted into heterogeneous graphs, as shown in Figure 3. A comprehensive description of all the processing steps can be found in Appendix A. Based on spatial relationships, the links between nodes representing beams, columns, and slabs are categorized into four types: beam�Cbeam, beam�Ccolumn, beam�Cslab, and column�Cslab. A beam�Cbeam link is created between two beam nodes when they are either connected to the same column or directly interconnected. A beam�Ccolumn link forms between a beam node and its connected column node. Links between slab nodes and surrounding beam and column nodes are categorized as beam�Cslab and column�Cslab, respectively.
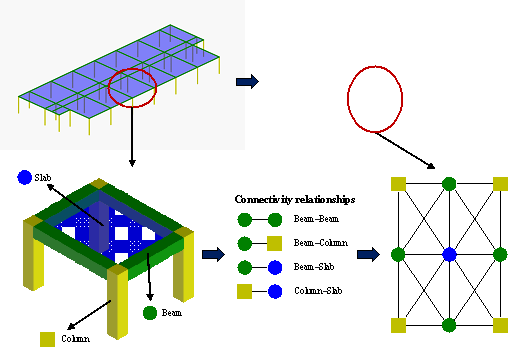
Figure 3. Representation method for heterogeneous graphs of RC frame structures.
Based on the data presented in Table 1, to predict beam width, beam height, column section length in the x and y directions, and slab thickness, various features can be assigned to the beam, column, and slab nodes, as outlined in Table 2. These features fall into four categories:
(1)
Property features (PF): These represent the inherent attributes of
the components. The features of beam and column nodes include concrete grade
![]() , component length
, component length ![]() , and its orientation
, and its orientation ![]() . For slab nodes, the features include concrete grade
. For slab nodes, the features include concrete grade ![]() , slab area
, slab area ![]() , number of slab edges
, number of slab edges ![]() , room type
, room type ![]() , and slab load
, and slab load ![]() .
.
(2)
Position features: These are discussed in two sub-categories. Absolute
position (AP) represents the absolute planar coordinates of the midpoint of
each component ![]() ,
, ![]() after setting the center of the standard story to zero.
Relative position (RP) includes the normalized relative coordinates of the
midpoint of each component, represented as
after setting the center of the standard story to zero.
Relative position (RP) includes the normalized relative coordinates of the
midpoint of each component, represented as ![]() ,
, ![]() , along with the total length of the standard story in the x and y
directions, denoted by
, along with the total length of the standard story in the x and y
directions, denoted by ![]() ,
, ![]() .
.
(3)
Height features (HF): These include the total number of stories in
the building ![]() , the starting floor of the current standard story
, the starting floor of the current standard story ![]() , and the height of the current standard story
, and the height of the current standard story ![]() .
.
(4)
Seismic features (SF): These comprise four seismic features specified
in Table 1: PGA ![]() , site class
, site class ![]() , anti-seismic grade
, anti-seismic grade ![]() , and design earthquake grouping
, and design earthquake grouping ![]() .
.
Table 2. Possible features for beam, column, and slab nodes
|
Categories |
Features |
|
|
Property features (PF) |
Beam, column |
|
|
Slab |
|
|
|
Position features |
Absolute position (AP) |
x, y |
|
Relative position (RP) |
|
|
|
Height features (HF) |
|
|
|
Seismic features (SF) |
|
|
Following the construction of the graph representation in the dataset, the training and prediction of the model can begin, utilizing the foundational architecture depicted in Figure 4. The specific parameters for each component of the model are outlined in Table 3.
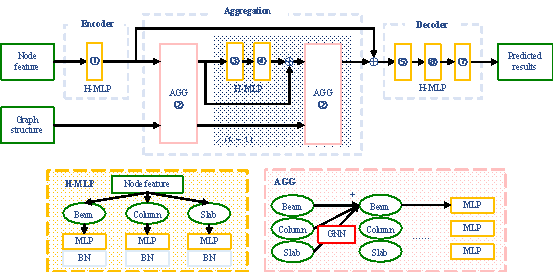
Figure 4. Core architecture of HetGNN for size prediction.
Table 3. Architecture parameters of HetGNN
|
Index |
Submodule of each torch module |
Input dimension |
Output dimension |
|
�� |
Beam, column, slab |
numbers of |
20 |
|
�� |
Beam�Cbeam, beam�Ccolumn, beam�Cslab, |
20 |
20 |
|
�� |
Beam, column, slab |
20 |
80 |
|
�� |
Beam, column, slab |
80 |
20 |
|
�� |
Beam, column, slab |
20 |
40 |
|
�� |
Beam, column, slab |
40 |
80 |
|
�� |
Beam, column, slab |
80 |
Beam: 2, |
The neural network is divided into the Encoder, Aggregation, and Decoder. Their architectures and functions are as follows.
The Encoder streamlines the approach described by Zhang et al. [37] by using a heterogeneous multi-layer perceptron (H-MLP) network, which applies unique weights to the nodes representing beams, columns, and slabs. This network first encodes the input features of the nodes, enabling dimension expansion and transforming them to a uniform dimensionality suitable for subsequent graph convolution processes. Each H-MLP consists of three MLPs specifically designed for beam, column, and slab nodes, with a batch normalization layer between the fully connected layers and the activation functions to standardize the data.
The Aggregation comprises AGG and H-MLP layers. The AGG layer uses heterogeneous graph techniques for message passing, aggregation, and updating. First, self-loops are added to each node to ensure adequate transmission of its information. Next, message passing and aggregation are performed on each type of link (such as beam�Ccolumn, beam�Cslab, beam�Cbeam, etc.) using GNN methods like GCN [38] , GAT [39] , and GraphSAGE [40] . Messages aggregated from multiple links for each node type are then summed and processed through a single-layer MLP network. Two H-MLP layers are added between the AGG layers, featuring residual connections to increase the network depth [41] .
The Decoder uses a three-layer H-MLP network, where the hidden layer dimension expands and contracts [42] . It makes predictions separately for beam, column, and slab nodes, converting the information aggregated by HetGNN into the final output sizes for these components.
The model uses the MSE loss function to assess the discrepancy between predicted and actual values. This study uses a regression rather than classification to ensure the orderly progression of predictive outcomes. However, this method leads to initially continuous distribution predictions. Therefore, the preliminary predictions are rounded to the nearest modulus based on design experience and statistical data. A modulus size of 50 mm is used for beams and columns, while one of 20 mm is applied for slabs. These steps yield the final predicted sizes for beams, columns, and slabs, which are then stored in the graph representing the standard story.
Regarding the learning rate strategy, the model uses the cosine annealing learning rate adjustment algorithm [43] , promoting more efficient training convergence. The initial hyperparameter settings for the training are presented in Table 4.
Table 4. Initial hyperparameters of HetGNN
|
Hyperparameter |
Value |
|
Batch size |
8 |
|
Epoch |
100 |
|
Learning rate |
0.01 |
The average video memory is about 400 MiB, the average training time is about 10 minutes and the computing platform specifications were as follows: OS: Ubuntu 22.04 LTS; CPU: Intel Xeon E5-2682 v4 @ 64 �� 3 GHz; RAM: 32 GB; GPU: NVIDIA GeForce RTX 3090 24 GB.
2.6 Post-processing and visualization
After obtaining the predicted component sizes, the column dimensions are adjusted to ensure the final design conforms to standard practices for RC frame structures. The algorithm ensures that the column sizes on upper floors are smaller than those on lower floors, as outlined in Algorithm 1.
|
Algorithm 1 Column size adjustment |
|
|
Input: List of all columns: columns; Number of standard stories: N |
|
|
Output: Adjusted columns: columns |
|
|
1. |
for n = N-1 to 1: |
|
2. |
foreach column in columns_in_nth_story(columns, n): |
|
3. |
upper_column = get_upper_column(column) |
|
4. |
if upper_column.x_size > column.x_size: |
|
5. |
column.x_size = upper_column.x_size |
|
6. |
end |
|
7. |
if upper_column.y_size > column.y_size: |
|
8. |
column.y_size = upper.column.y_size |
|
9. |
end |
|
10. |
end |
|
11. |
end |
|
12. |
return columns |
First, traverse the floors from top to bottom. For each column within a floor, identify the column directly above it, referred to as upper_column. If the size of upper_column is larger than that of the current column, then the current column should be adjusted to match the size of the upper_column.
After adjusting the column sizes according to empirical rules, the graph representing each standard story is converted back to CAD drawings, generating structural component size diagrams. Using parametric modeling techniques, multiple standard stories from the same building are transformed into a unified coordinate system by aligning reference points. The parametric modeling software YJK-GAMA [44] is then employed to assemble these stories and automatically set overall structural parameters, standard story parameters, and load information, thus constructing a comprehensive structural model of the building. This process validates the designs produced by HetGNN, ensuring structural safety and reliability. The specific implementation is depicted in Figure 5.
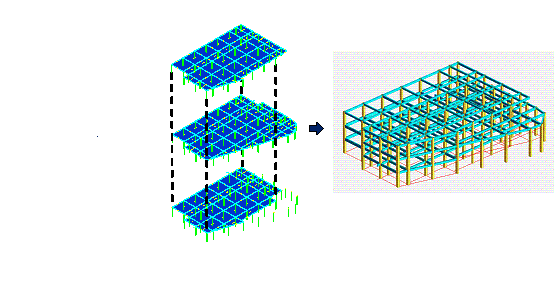
Figure 5. Post-processing of the component size prediction model.
3 Results and discussion
3.1 Evaluation method for design results
To validate the design results using this method, the root mean square
error (RMSE) metric is employed to assess the deviation between the AI-designed
sizes and actual sizes. For example, in the case of beam height, let
![]() represent the actual height of the
represent the actual height of the ![]() -th beam in the
-th beam in the ![]() -th graph of the test set, and
-th graph of the test set, and ![]() represent the AI-designed height. If the test set comprises
represent the AI-designed height. If the test set comprises
![]() graphs, with each graph containing
graphs, with each graph containing ![]() beams, then the size deviation
beams, then the size deviation ![]() (mm) for beam height can be expressed using Equation (1)
as follows:
(mm) for beam height can be expressed using Equation (1)
as follows:
![]()
Similarly, this method can evaluate beam width, column section length
in both directions and slab thickness. A smaller ![]() indicates better design performance. This metric helps
compare design outcomes across different models and parameter settings.
indicates better design performance. This metric helps
compare design outcomes across different models and parameter settings.
For a single case that requires more detailed analysis, structural analysis models can be created using parametric modeling techniques. Metrics like story drift ratios are used for detailed analysis to ensure the structure complies with design code requirements.
3.2 Experiments on model performances
3.2.1 Structure representation methods
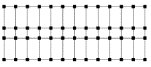
In the current dataset, each standard story is represented by a graph. While this method effectively captures the topological relationships between components within a single standard story, it does not depict the connections between different standard stories within the building, nor does it convey the vertical topology of the components. To address this, this section introduces two additional structural representation methods that improve the connections between standard stories through graph combination and floor assembly techniques, as detailed in Table 5 and illustrated in Figure 6.
Table 5. Three structural representation methods
|
Structure representation method |
Method |
|
Standard story only (SSO) |
Each standard story is individually represented by a graph. |
|
Building batched (BB) |
Batch multiple standard story graphs from the same building into a single graph, without adding additional links. |
|
Building assembled (BA) |
Link the column nodes of adjacent standard stories vertically by height within each building to form a single graph. |
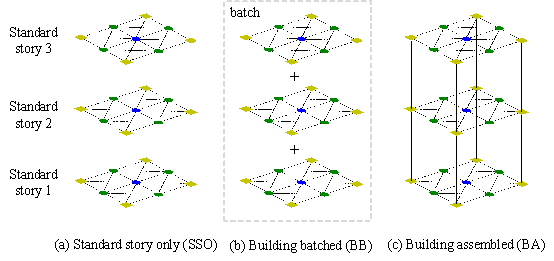
Figure 6. Schematic of the three structural representation methods.
Each of the three structural representation methods mentioned above
is used for training. The selected features include property, relative position,
height, and seismic features from Table 2. Initially, a GCN with a depth of
![]() layers is chosen, with optimal hyperparameters adjusted
based on results from the validation set. The predicted outcomes for each
component are presented in Table 6.
layers is chosen, with optimal hyperparameters adjusted
based on results from the validation set. The predicted outcomes for each
component are presented in Table 6.
Table 6. Impact of different structural representation methods on component size prediction
|
Structure Representation Type |
|
|
|
|
|
|
|
SSO |
107.85 |
46.57 |
100.33 |
84.76 |
28.98 |
73.70 |
|
BB |
128.52 |
47.78 |
91.19 |
77.49 |
28.82 |
74.76 |
|
BA |
109.03 |
29.68 |
70.43 |
53.72 |
25.39 |
57.65 |
In this table, ![]() and
and ![]() represent the size deviation for beam height and beam width,
respectively;
represent the size deviation for beam height and beam width,
respectively; ![]() and
and ![]() indicate the size deviation for column section length in
the x direction and y direction, respectively;
indicate the size deviation for column section length in
the x direction and y direction, respectively; ![]() refers to the size deviation for slab thickness; and
refers to the size deviation for slab thickness; and ![]() represents the average of these five size deviations.
represents the average of these five size deviations.
Table 6 shows that the BA representation provides the best predictive results for most components, except for slightly lower accuracy in beam height predictions. This superior performance is due to its enhanced connections between standard stories within the same building, incorporating inter-story component topological relationships. In contrast, the BB representation, which combines graphs without introducing additional edge connections, leads to poorer predictions, performing even worse than the SSO representation. Based on these experimental results, the BA structural representation method will be used in subsequent discussions.
3.2.2 Graph neural networks
Figure 4 depicts the foundational architecture of HetGNN for predicting sectional sizes of RC frame structures, allowing for different GNN methodologies in the Aggregation layer. This study uses the DGL GNN framework [45] to discuss three commonly used GNNs��GCN, GAT, and GraphSAGE. Here's a brief overview of how these methods are implemented in this context.
The mathematical expression for graph convolutional network (GCN) is shown in Equation (2).
![]()
Here, ![]() denotes the set of neighbors of node
denotes the set of neighbors of node ![]() , and
, and ![]() , where node features are updated through message passing from neighboring
nodes.
, where node features are updated through message passing from neighboring
nodes. ![]() and
and ![]() represent the weights and biases of the
represent the weights and biases of the ![]() -th layer and
-th layer and ![]() denotes the features of node
denotes the features of node ![]() at layer
at layer ![]() .
.
GAT, or graph attention layer, is defined by the mathematical expressions presented in Equations (3)�C(5):
![]()
![]()
![]()
where ![]() represents the number of heads in the multi-head attention
mechanism [46] , which is typically set to 4 based on empirical evidence. The attention
coefficients
represents the number of heads in the multi-head attention
mechanism [46] , which is typically set to 4 based on empirical evidence. The attention
coefficients ![]() between node
between node ![]() and node
and node ![]() are computed using a single-layer feedforward neural network
are computed using a single-layer feedforward neural network
![]() , and normalization is achieved through the
, and normalization is achieved through the ![]() function.
function.
GraphSAGE employs the ![]() function for aggregation, as mathematically expressed in
Equations (6)�C(7).
function for aggregation, as mathematically expressed in
Equations (6)�C(7).
![]()
![]()
The number of layers ![]() in the GNN can also be adjusted as required. To avoid over-smoothing
in multi-layer GNNs, which can cause all nodes to converge toward a uniform
state, leading to reduced predictive performance [47] ,
in the GNN can also be adjusted as required. To avoid over-smoothing
in multi-layer GNNs, which can cause all nodes to converge toward a uniform
state, leading to reduced predictive performance [47] , ![]() is restricted to a range between 0 and 5. When
is restricted to a range between 0 and 5. When ![]() , the Aggregation layer is removed, and predictions are made directly
using the Encoder and Decoder layers.
, the Aggregation layer is removed, and predictions are made directly
using the Encoder and Decoder layers.
Hyperparameters are optimized using the training and validation sets to select the best-fitting model, which is then evaluated against the test set for comparison. The experimental results are presented in Table 7.
Table 7. Impact of different models on component size prediction
|
GNN |
|
|
|
|
|
|
|
|
None |
0 |
125.28 |
30.65 |
71.96 |
71.97 |
23.14 |
64.60 |
|
GCN |
1 |
117.30 |
30.06 |
78.02 |
70.81 |
25.56 |
64.35 |
|
2 |
109.03 |
29.68 |
70.43 |
53.72 |
25.39 |
57.65 |
|
|
3 |
107.29 |
27.07 |
62.51 |
56.53 |
23.09 |
55.30 |
|
|
4 |
98.48 |
27.96 |
62.71 |
49.54 |
23.95 |
52.53 |
|
|
5 |
113.42 |
34.91 |
80.27 |
74.20 |
24.14 |
65.39 |
|
|
GAT |
1 |
105.94 |
29.79 |
66.54 |
49.14 |
27.43 |
55.77 |
|
2 |
103.06 |
28.65 |
66.50 |
49.63 |
23.31 |
54.23 |
|
|
3 |
100.18 |
28.18 |
75.28 |
57.12 |
23.18 |
56.79 |
|
|
4 |
111.00 |
28.59 |
68.73 |
53.64 |
23.55 |
57.10 |
|
|
5 |
116.56 |
30.35 |
70.72 |
55.73 |
23.69 |
59.41 |
|
|
GraphSAGE |
1 |
119.46 |
31.52 |
71.56 |
63.22 |
23.94 |
61.94 |
|
2 |
110.59 |
34.12 |
68.81 |
58.76 |
23.63 |
59.18 |
|
|
3 |
104.71 |
32.25 |
70.72 |
62.62 |
22.40 |
58.54 |
|
|
4 |
107.66 |
33.69 |
62.60 |
57.57 |
23.64 |
57.03 |
|
|
5 |
104.25 |
28.35 |
61.51 |
58.53 |
25.27 |
55.58 |
The results show that without GNNs, predictions of beam height and column sizes are notably less accurate, with size deviations exceeding the best predictions by 26.80, 10.45, and 22.83 mm, respectively. Conversely, predictions for beam width and slab thickness are less affected, with deviations of only 3.58 and 0.74 mm higher than the best predictions. This suggests that beam width and slab thickness are primarily influenced by their attribute features and are less related to topological relationships. This observation aligns with practical design experience, where beam height and column sizes are significantly influenced by slab load and room type. In contrast, beam width and slab thickness are less influenced by other components.
Regarding the impact of layer depth, increasing the number of layers does not significantly improve prediction results. For both GCN and GAT, predictive performance tends to decline with additional layers, while GraphSAGE shows minimal improvement. The performance of GCN is optimal with 4 layers and then declines, while the performance of GAT peaks at 3 layers before decreasing. Similarly, the performance of GraphSAGE stabilizes after 3 layers. This is consistent with the theory of over-smoothing in GNNs, where adding more layers causes the hidden representations of each node to converge toward a single value, leading to reduced predictive accuracy.
Of the three different GNNs, GCN exhibits optimal performance on average
with a layer depth of ![]() , where the size deviations for each component closely approach the
optimal values. This model will, therefore, be used as the benchmark for subsequent
applications.
, where the size deviations for each component closely approach the
optimal values. This model will, therefore, be used as the benchmark for subsequent
applications.
3.2.3 Heterogeneous nodes
In the analysis described above, beam, column, and slab components are interconnected, and predictions are made for the sectional sizes of all components. To further explore the interactions and influences between different components, this section keeps a subset of component nodes within the heterogeneous graph to study their impact on the final prediction results. The outcomes of this analysis are presented in Table 8.
Table 8. Impact of different heterogeneous nodes on component size prediction
|
Retained heterogeneous nodes |
|
|
|
|
|
|
Beam |
112.08 |
29.76 |
�� |
�� |
�� |
|
Column |
�� |
�� |
65.04 |
58.88 |
�� |
|
Slab |
�� |
�� |
�� |
�� |
23.14 |
|
Beam + Column |
100.42 |
28.29 |
70.50 |
65.58 |
�� |
|
Beam + Slab |
102.00 |
29.11 |
�� |
�� |
22.82 |
|
Column + Slab |
�� |
�� |
60.94 |
52.37 |
25.98 |
|
Beam + Column + Slab |
98.48 |
27.96 |
62.71 |
49.54 |
23.95 |
When beams, slabs, and columns are retained simultaneously, the model performs well across multiple size-prediction tasks. Predictions for beam height, beam width, and column section length in the y direction are especially accurate, with size deviations for column section length in the x direction and slab thickness slightly higher than the best predictions, by 1.77 and 1.13 mm, respectively. This shows that keeping nodes for beams, slabs, and columns achieves satisfactory accuracy and allows for simultaneous predictions of all component sizes, thus improving design efficiency. Therefore, all subsequent experiments will retain all heterogeneous nodes.
3.2.4 Node features
When engineers design the component sizes for RC frame structures, they must calculate the mechanical performance of the structure based on the characteristics of each component and the overall structure to select the appropriate sizes. However, the specific factors that influence the component sizes need to be better understood and further examined. Thus, this section will compare the impact of different features in Table 2 on the final design outcomes.
Comparisons of different feature combinations and the final design outcomes are presented in Table 9.
Table 9. Impact of different feature combinations on component size prediction
|
Feature combinations |
|
|
|
|
|
|
|
PF |
102.54 |
42.86 |
68.92 |
56.86 |
22.25 |
58.68 |
|
PF+AP |
95.85 |
40.14 |
65.61 |
57.75 |
27.33 |
57.34 |
|
PF+RP |
107.59 |
28.91 |
67.13 |
52.33 |
23.36 |
55.86 |
|
PF+HF |
102.31 |
37.80 |
68.79 |
61.51 |
29.97 |
60.08 |
|
PF+SF |
110.22 |
33.41 |
71.94 |
65.24 |
23.46 |
60.85 |
|
PF+AP+HF |
106.57 |
27.09 |
71.71 |
65.34 |
24.84 |
59.11 |
|
PF+RP+HF |
101.73 |
37.99 |
73.71 |
59.75 |
25.39 |
59.71 |
|
PF+AP+SF |
101.81 |
36.69 |
67.27 |
55.72 |
26.02 |
57.50 |
|
PF+RP+SF |
99.22 |
29.27 |
65.63 |
54.86 |
28.33 |
55.46 |
|
PF+AP+HF+SF |
96.77 |
28.97 |
70.92 |
62.81 |
25.98 |
57.09 |
|
PF+RP+HF+SF |
98.48 |
27.96 |
62.71 |
49.54 |
23.95 |
52.53 |
When property features, relative coordinates, height features, and seismic features are used together, the overall size prediction performance for the components is optimal. The size deviations for beam height, beam width, and slab thickness are slightly higher than the best predictions by 2.63, 0.87, and 1.70 mm, respectively. Thus, case analyses in subsequent studies will continue to use this model. The specific details of the model training process are provided in Appendix B.
Additionally, an analysis of the best predictive performance under different feature inputs shows that using property features and absolute coordinates results in the most accurate predictions for beam height. When property features, absolute coordinates, and height features are combined, the predictions for beam width are the most accurate. The prediction results for column sizes are heavily influenced by the choice of features, with relative coordinates generally performing better than absolute coordinates. The best results for column size predictions occur when property features, relative coordinates, height features, and seismic features are used together. Conversely, slab thickness is more influenced by its intrinsic property features, and adding extra information can reduce prediction accuracy.
3.3 Case studies
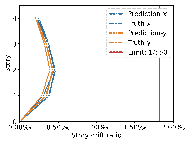
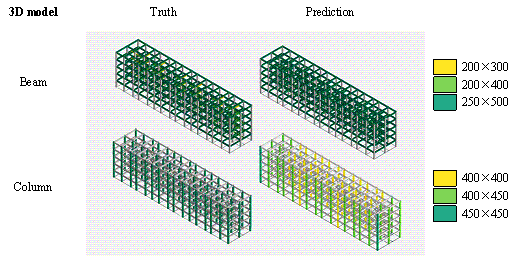
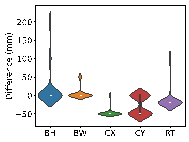
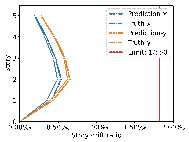
Using real-world engineering cases from the test set, preprocessing is carried out according to the method described in Section 2.3. Component sizes are then predicted using the HetGNN model. Next, column section sizes are adjusted based on design experience, as outlined in Section 2.5. This is followed by the assembly of floors and mechanical calculations using YJK-GAMA as shown in Figure 7. The AI-designed sectional sizes are compared with the actual sizes, and the story drift ratios of the AI-designed structures are compared to those of the ground truth to verify the safety of the design method. Visualization results for some specific cases are presented in Figure 8, with each case's design process completed in under one second.
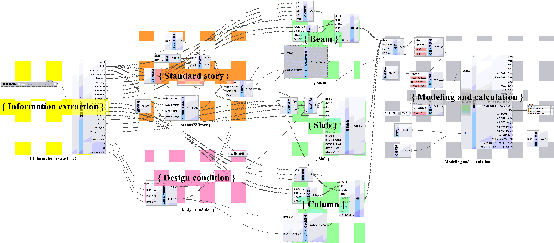
Figure 7. Parametric modeling and calculating using YJK-GAMA.
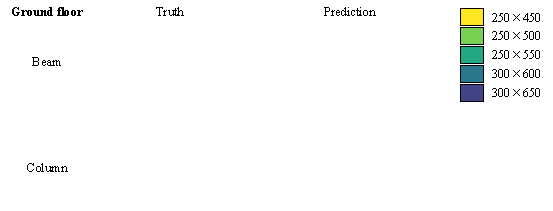
|
Ground floor layout |
Size deviation |
Story drift ratio |
|
|
|
|
(a) Case 1 (stories: 4, PGA: 0.1g, site class: ��0, design earthquake grouping: 2)
|
Ground floor layout |
Size deviation |
Story drift ratio |
|
|
|
|
(b) Case 2 (stories: 5, PGA: 0.1g, site class: ��, design earthquake grouping: 1)
|
Ground floor layout |
Size deviation |
Story drift ratio |
|
|
|
|
|
(c) Case 3 (stories: 8, PGA: 0.05g, site class: ��, design earthquake grouping: 1) |
||
|
|
|
|
|
(d) Case 4 (stories: 5, PGA: 0.1g, site class: ��, design earthquake grouping: 1) |
||
|
|
|
|
|
(e) Case 5 (stories: 6, PGA: 0.1g, site class: ��, design earthquake grouping: 1) |
||
|
|
|
|
|
(f) Case 6 (stories: 5, PGA: 0.1g, site class: ��, design earthquake grouping: 1) |
||
|
|
|
|
|
(g) Case 7 (stories: 5, PGA: 0.1g, site class: ��, design earthquake grouping: 2) |
||
|
|
|
|
|
(h) Case 8 (stories: 4, PGA: 0.1g, site class: ��, design earthquake grouping: 1) |
||
|
|
|
|
|
(i) Case 9 (stories: 5, PGA: 0.1g, site class: ��, design earthquake grouping: 1) |
||
|
|
|
|
|
(j) Case 10 (stories: 5, PGA: 0.1g, site class: ��, design earthquake grouping: 1) |
||
|
|
|
|
|
(k) Case 11 (stories: 5, PGA: 0.1g, site class: ��, design earthquake grouping: 1) |
||
|
|
|
|
|
(l) Case 12 (stories: 4, PGA: 0.1g, site class: ��, design earthquake grouping: 2) |
||
|
|
|
|
|
(m) Case 13 (stories: 4, PGA: 0.1g, site class: ��, design earthquake grouping: 2) |
||
|
|
|
|
|
(n) Case 14 (stories: 5, PGA: 0.1g, site class: ��, design earthquake grouping: 1) |
||
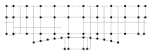
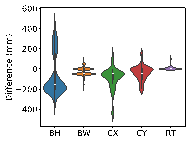
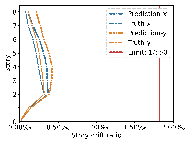
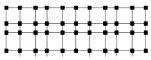
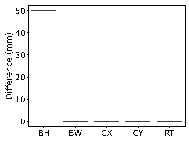
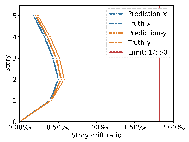
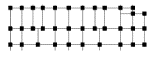
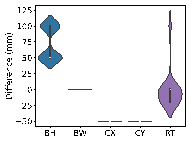
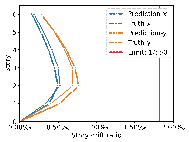
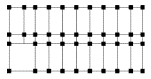
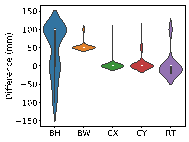
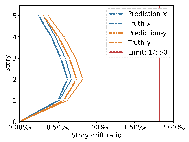
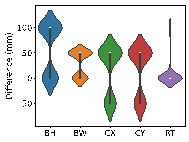
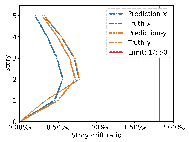
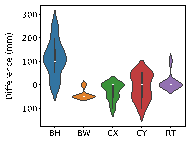
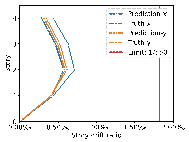

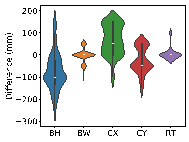
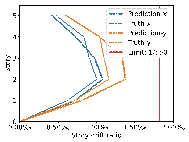
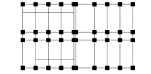
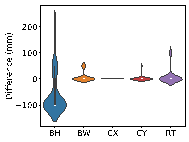
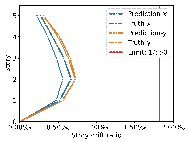
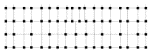
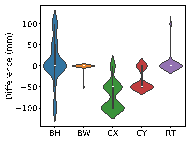
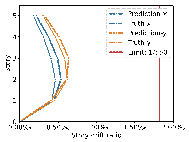
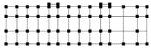
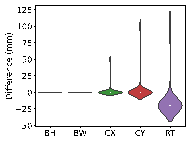
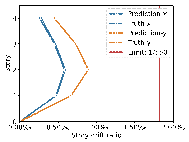
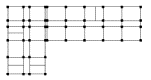
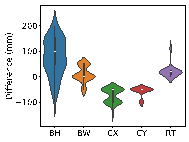
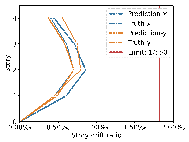
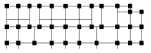
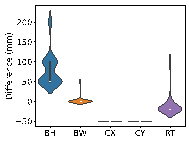
Figure 8. Visualization results for selected cases.
The results in Figure 8 suggest the following characteristics for AI-designed sizes of each component:
(1) Beam heights are reasonably accurate, with some variations reflecting the influence of architectural, functional, and aesthetic factors. For instance, certain rooms may have specific requirements for clear height, which may result in a need to reduce beam heights. In other rooms, certain beams align with partition walls, where aesthetic considerations regarding beam height are not as critical, thus allowing for higher beam heights to be acceptable. While the model may not fully capture these influences due to incomplete data features, these deviations present opportunities for further refinement and a deeper understanding of the design complexities.
(2) Beam widths are highly accurate, with deviations generally within 50 mm (one unit modulus). This suggests that a certain level of over-smoothing in the GNN can be beneficial for designing RC frame structures, as it helps standardize component sizes and enhance overall design consistency. By appropriately selecting the number of layers in GNN, we can strike a balance between distinguishing the sizes of structural components under different conditions, and consolidating similar component sizes to avoid complexity in construction due to many sizes.
(3) Column sizes show high accuracy when the topological relationships between standard stories are consistent. Although larger discrepancies can occur in structures with many standard stories or significant variations between them, these differences highlight areas where engineering judgment can be further optimized. Despite these variations, the AI-designed column sections meet regulatory requirements for story drift ratios, offering valuable insights and guidance for engineering projects.
(4) Slab thicknesses mainly fall into two categories: 100 and 120 mm. While larger deviations typically occur in specific areas such as stairwells, elevator shafts, and voids, they can be easily corrected during the subsequent engineering design phases, showcasing the model��s potential for adaptability and precision in various design scenarios.
To ensure that the outcomes of size design meet safety requirements,
this study further discusses the impact of size deviations on the variation
of story drift ratios. For the ![]() -th RC frame structure, it is assumed that the actual design��s story
drift ratios in the x and y directions at the
-th RC frame structure, it is assumed that the actual design��s story
drift ratios in the x and y directions at the ![]() -th standard story as
-th standard story as ![]() and
and
![]() , respectively. Additionally, the AI-designed structure��s story drift
ratios are denoted as
, respectively. Additionally, the AI-designed structure��s story drift
ratios are denoted as ![]() and
and ![]() . Given that the structure comprises
. Given that the structure comprises ![]() stories, the RMSE of story drift ratios is defined as shown
in Equations (8)�C(9).
stories, the RMSE of story drift ratios is defined as shown
in Equations (8)�C(9).
![]()
![]()
Based on the cases in this section, further exploration of the relationship between the average RMSE of component sizes and the RMSE of story drift ratios in the x and y directions was conducted using linear regression analysis. The results are presented in Figure 9.
|
|
|
|
(a) Relationship in the x direction |
(b) Relationship in the y direction |
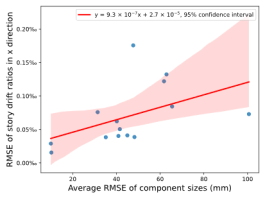
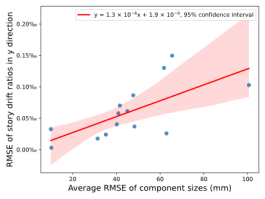
Figure 9. Relationship between the average RMSE of component sizes and the RMSE of story drift ratios in the x and y directions.
The results in Figures 8�C9 indicate that the deviations between the AI-designed and actual sizes are generally within a manageable range. Cases with fewer standard stories and more straightforward topological relationships yield better design outcomes. All cases meet regulatory requirements for story drift ratios. When the average RMSE of component sizes is within 100 mm, the RMSE of story drift ratios is approximately 0.20�� at a 95% confidence interval, significantly less than the limit of 1/550 (approximately 1.82��) [36] , indicating acceptable safety performance.
3.4 Discussion
Further discussion on the differences in efficiency and usage characteristics between our method and existing methods is presented in Table 10. Engineers' design takes longer but ensures superior mechanical performance and fully complies with empirical rules. The genetic algorithm also requires a long time and generally achieves optimal mechanical performance, but the design results are challenging to align with real-world empirical rules. Zhang et al. [18] used a mechanical surrogate model and gradient descent method to optimize the RC frame sizes. The mechanical surrogate model partially reduced computational accuracy, and due to the lack of real datasets, manually set rules could not entirely ensure compliance with empirical rules. Chang et al. [19] proposed NeuralSizer, which used a mechanical surrogate model to generate a virtual dataset and employed a GNN for prediction. Although this method is faster, the learning of two different neural networks further reduced accuracy, resulting in decreased mechanical performance, and the manually set rules also struggled to meet empirical rule requirements. In contrast, our method exclusively uses real data as the training set, considering the heterogeneous characteristics of different components to learn a more appropriate message-passing strategy. This HetGNN ensures mechanical performance and compliance with empirical rules, demonstrating strong practicality.
Table 10. Comparison of design methods for component sizes of RC frame structure
|
Method |
Category |
Time |
Mechanical performance |
Empirical rule |
|
Engineer��s design |
�� |
> 1 h |
Good |
Very Good |
|
Genetic algorithm |
Optimization |
> 1 h |
Very good |
Poor |
|
Gradient-based algorithm |
Optimization |
2 ~ 4 min |
Good |
Accepetable |
|
NeuralSizer (GNN) [19] |
Generation |
< 1 s |
Accepetable |
Accepetable |
|
HetGNN (our method) |
Generation |
< 1 s |
Good |
Good |
In summary, this method can produce relatively accurate designs for the component sizes of conventional RC frame structures, and it can also generate preliminary designs that meet structural safety requirements for more complex cases. These preliminary designs can be refined with minor adjustments to achieve desired outcomes. Additionally, the method demonstrates robust performance, as minor adjustments to input features do not significantly impact the final results, effectively handling issues such as missing or erroneous input features.
The limitations of the design capability are partly due to the limited availability of complex RC frame structure data and the unique nature of each structure, which poses learning challenges. Additionally, although HetGNN-based models exhibit robust performance, they may overlook local detail variations and are not sensitive to changes in input features. Furthermore, the current model needs to account for some non-structural design rules (such as aesthetic requirements), which can lead to unreasonable sizes in certain areas.
Future work could include expanding the dataset and incorporating empirical rules into the HetGNN to improve the model's design capabilities. Additionally, this method can be applied to a variety of structural forms, including steel frames, braced frames, and shear wall structures. Utilizing similar dataset construction methods, heterogeneous graph representation techniques, and HetGNNs, component size prediction for other complex structures can be achieved.
4 Conclusions
To address the need for efficient and intelligent generation of component sizes in RC frame structures, this paper introduced a method for generating sizes using heterogeneous graph representation and HetGNN. This method uses heterogeneous nodes to represent structural components and employs HetGNN to design component sizes. Additionally, it allows for assembling structural models and verifying mechanical performance through automated parametric modeling. This approach enables the rapid design of RC frame structure components, thus improving the efficiency of engineering design. The key conclusions are as follows:
(1) This study compiled a dataset of component sizes for RC frame structures, incorporating sectional sizes from 95 real engineering cases. This dataset is designed for automated processing, and the models trained on it demonstrate strong generalizability, which perform well on complex test sets that were not encountered during training. The dataset provides a robust data foundation for future studies.
(2) Given the topological characteristics of frame structures, this study proposed a general method for heterogeneous graph representation. This method effectively captures the intrinsic properties and topological relationships among beams, columns, and slabs, comprehensively depicting critical features in the structures and components.
(3) Utilizing the heterogeneous graph representation approach, this study proposed a method for automately designing the component sizes of RC frame structures in under one second with well trained HetGNN. It examined the effects of structural representation, model selection, heterogeneous nodes, and feature selection on prediction outcomes to determine the model that most closely aligns with actual design.
(4) Experiments and case analyses validated the model's capabilities, demonstrating accurate design for simple RC frame structures and preliminary design for more complex structures. This approach is expected to enhance design efficiency while ensuring safety and can be extended to more design phases and structural forms.
Current HetGNNs have yet to account
for the weight problem of different types of edges, which may lead to the
amplification or diminution of the message-passing effect of some edge types.
In the future, expanding the dataset or incorporating attention weights in
the message passing of neighboring nodes could enhance the processing capabilities
for complex frame structures. Incorporation of empirical rules could ensure
the accuracy of design outcomes. Additionally, integrating this approach with
optimization algorithms for RC frame structures could further improve the
cost-effectiveness and safety of the final design solutions. Future collaborations
with design institutes will be pursued to apply this method in real engineering
designs, thereby refining our approach.
CRediT authorship contribution statement
Sizhong Qin: Conceptualization, Methodology, Software, Validation, Visualization, Writing �C original draft, Writing �C review & editing. Wenjie Liao: Conceptualization, Resources, Supervision, Writing �C original draft, Writing �C review & editing. Yuli Huang: Resources, Supervision, Writing �C review & editing. Shulu Zhang: Data curation, Investigation, Resources. Yi Gu: Data curation, Methodology, Software, Visualization. Jin Han: Formal analysis, Validation, Writing �C original draft. Xinzheng Lu: Conceptualization, Funding acquisition, Resources, Supervision, Writing �C review & editing.
Declaration of Competing Interest
The authors declare that they have no known competing financial interests or personal relationships that could have appeared to influence the work reported in this paper.
Acknowledgments
References
[1] P.Z. Lu, S.Y. Chen, Y.J. Zheng, Artificial intelligence in civil engineering, Mathematical Problems in Engineering 2012 (2012) 1�C22. https://doi.org/10.1155/2012/145974.
[2] H. Salehi, R. Burgueño, Emerging artificial intelligence methods in structural engineering, Engineering Structures 171 (2018) 170�C189. https://doi.org/10.1016/j.engstruct.2018.05.084.
[3] Y. Pan, L.M. Zhang, Roles of artificial intelligence in construction engineering and management: A critical review and future trends, Automation in Construction 122 (2021) 103517. https://doi.org/10.1016/j.autcon.2020.103517.
[4] P. Zakian, A. Kaveh, Seismic design optimization of engineering structures: a comprehensive review, Acta Mech 234 (2023) 1305�C1330. https://doi.org/10.1007/s00707-022-03470-6.
[5] W.J. Liao, X.Z. Lu, Y.F. Fei, Y. Gu, Y.L. Huang, Generative AI design for building structures, Automation in Construction 157 (2024) 105187. https://doi.org/10.1016/j.autcon.2023.105187.
[6] S. Ganzerli, C.P. Pantelides, L.D. Reaveley, Performance-based design using structural optimization, Earthquake Engineering & Structural Dynamics 29 (2000) 1677�C1690. https://doi.org/10.1002/1096-9845(200011)29:11<1677::AID-EQE986>3.0.CO;2-N.
[7] Q.M. Liu, J. Zhang, L.B. Yan, An optimal method for seismic drift design of concrete buildings using gradient and Hessian matrix calculations, Archive of Applied Mechanics 80 (2010) 1225�C1242. https://doi.org/10.1007/s00419-009-0368-0.
[8] C.-M. Chan, X.-K. Zou, Elastic and inelastic drift performance optimization for reinforced concrete buildings under earthquake loads, Earthquake Engineering & Structural Dynamics 33 (2004) 929�C950. https://doi.org/10.1002/eqe.385.
[9] X.-K. Zou, C.-M. Chan, Optimal seismic performance-based design of reinforced concrete buildings using nonlinear pushover analysis, Engineering Structures 27 (2005) 1289�C1302. https://doi.org/10.1016/j.engstruct.2005.04.001.
[10] M. Fragiadakis, M. Papadrakakis, Performance-based optimum seismic design of reinforced concrete structures, Earthquake Engineering & Structural Dynamics 37 (2008) 825�C844. https://doi.org/10.1002/eqe.786.
[11] P.E. Mergos, Optimum seismic design of reinforced concrete frames according to Eurocode 8 and fib Model Code 2010, Earthquake Engineering & Structural Dynamics 46 (2017) 1181�C1201. https://doi.org/10.1002/eqe.2851.
[12] S. Gharehbaghi, M. Khatibinia, Optimal seismic design of reinforced concrete structures under time-history earthquake loads using an intelligent hybrid algorithm, Earthquake Engineering and Engineering Vibration 14 (2015) 97�C109. https://doi.org/10.1007/s11803-015-0009-2.
[13] M.J. Esfandiari, G.S. Urgessa, S. Sheikholarefin, S.H.D. Manshadi, Optimum design of 3D reinforced concrete frames using DMPSO algorithm, Advances in Engineering Software 115 (2018) 149�C160. https://doi.org/10.1016/j.advengsoft.2017.09.007.
[14] A. Akin, M.P. Saka, Harmony search algorithm based optimum detailed design of reinforced concrete plane frames subject to ACI 318-05 provisions, Computers & Structures 147 (2015) 79�C95. https://doi.org/10.1016/j.compstruc.2014.10.003.
[15] X. Lu, X.Z. Lu, H. Guan, L.P. Ye, Collapse simulation of reinforced concrete high-rise building induced by extreme earthquakes, Earthquake Engineering & Structural Dynamics 42 (2013) 705�C723. https://doi.org/10.1002/eqe.2240.
[16] X.Z. Lu, L.L. Xie, H. Guan, Y.L. Huang, X. Lu, A shear wall element for nonlinear seismic analysis of super-tall buildings using OpenSees, Finite Elements in Analysis and Design 98 (2015) 14�C25. https://doi.org/10.1016/j.finel.2015.01.006.
[17] Y. Li, X.Z. Lu, H. Guan, L.P. Ye, An improved tie force method for progressive collapse resistance design of reinforced concrete frame structures, Engineering Structures 33 (2011) 2931�C2942. https://doi.org/10.1016/j.engstruct.2011.06.017.
[18] C. Zhang, M.X. Tao, C. Wang, C. Yang, J.S. Fan, Differentiable automatic structural optimization using graph deep learning, Advanced Engineering Informatics 60 (2024) 102363. https://doi.org/10.1016/j.aei.2024.102363.
[19] K.-H. Chang, C.-Y. Cheng, Learning to simulate and design for structural engineering, in: Proceedings of the 37th International Conference on Machine Learning, PMLR, 2020: pp. 1426�C1436. https://doi.org/10.48550/arXiv.2003.09103.
[20] W.J. Liao, X.Z. Lu, Y.L. Huang, Z. Zheng, Y.Q. Lin, Automated structural design of shear wall residential buildings using generative adversarial networks, Automation in Construction 132 (2021) 103931. https://doi.org/10.1016/j.autcon.2021.103931.
[21] W.J. Liao, Y.L. Huang, Z. Zheng, X.Z. Lu, Intelligent generative structural design method for shear wall building based on ��fused-text-image-to-image�� generative adversarial networks, Expert Systems with Applications 210 (2022) 118530. https://doi.org/10.1016/j.eswa.2022.118530.
[22] X.Z. Lu, W.J. Liao, Y. Zhang, Y.L. Huang, Intelligent structural design of shear wall residence using physics-enhanced generative adversarial networks, Earthquake Engineering & Structural Dynamics 51 (2022) 1657�C1676. https://doi.org/10.1002/eqe.3632.
[23] P.J. Zhao, W.J. Liao, Y.L. Huang, X.Z. Lu, Intelligent design of shear wall layout based on attention-enhanced generative adversarial network, Engineering Structures 274 (2023) 115170. https://doi.org/10.1016/j.engstruct.2022.115170.
[24] Y.F. Fei, W.J. Liao, Y.L. Huang, X.Z. Lu, Knowledge-enhanced generative adversarial networks for schematic design of framed tube structures, Automation in Construction 144 (2022) 104619. https://doi.org/10.1016/j.autcon.2022.104619.
[25] Y.T. Feng, Y.F. Fei, Y.Q. Lin, W.J. Liao, X.Z. Lu, Intelligent generative design for shear wall cross-sectional size using rule-embedded generative adversarial network, Journal of Structural Engineering 149 (2023) 04023161. https://doi.org/10.1061/JSENDH.STENG-12206.
[26] N. Nauata, K.-H. Chang, C.-Y. Cheng, G. Mori, Y. Furukawa, House-GAN: Relational generative adversarial networks for graph-constrained house layout generation, in: European Conference on Computer Vision (ECCV), 2020: pp. 162�C177. https://doi.org/10.1007/978-3-030-58452-8_10.
[27] N. Nauata, S. Hosseini, K.-H. Chang, H. Chu, C.-Y. Cheng, Y. Furukawa, House-GAN++: Generative Adversarial Layout Refinement Network towards Intelligent Computational Agent for Professional Architects, in: IEEE/CVF Conference on Computer Vision and Pattern Recognition (CVPR), 2021: pp. 13627�C13636. https://doi.org/10.1109/CVPR46437.2021.01342.
[28] P.J. Zhao, W.J. Liao, Y.L. Huang, X.Z. Lu, Intelligent beam layout design for frame structure based on graph neural networks, Journal of Building Engineering 63 (2023) 105499. https://doi.org/10.1016/j.jobe.2022.105499.
[29] C. Zhang, M.X. Tao, C. Wang, J.S. Fan, End-to-end generation of structural topology for complex architectural layouts with graph neural networks, Computer-Aided Civil and Infrastructure Engineering 39 (2024) 756�C775. https://doi.org/10.1111/mice.13098.
[30] M. Schlichtkrull, T.N. Kipf, P. Bloem, R. van den Berg, I. Titov, M. Welling, Modeling relational data with graph convolutional networks, in: The Semantic Web, 2018: pp. 593�C607. https://doi.org/10.1007/978-3-319-93417-4_38.
[31] C.X. Zhang, D.J. Song, C. Huang, A. Swami, N.V. Chawla, Heterogeneous graph neural network, in: Proceedings of the 25th ACM SIGKDD International Conference on Knowledge Discovery & Data Mining, ACM, 2019: pp. 793�C803. https://doi.org/10.1145/3292500.3330961.
[32] Y. Sun, J. Han, Mining heterogeneous information networks: a structural analysis approach, ACM SIGKDD Explorations Newsletter 14 (2013) 20�C28. https://doi.org/10.1145/2481244.2481248.
[33] Z.H. Wu, S.R. Pan, F.W. Chen, G.D. Long, C.Q. Zhang, P.S. Yu, A comprehensive survey on graph neural networks, IEEE Transactions on Neural Networks and Learning Systems 32 (2021) 4�C24. https://doi.org/10.1109/TNNLS.2020.2978386.
[34] X. Wang, H.Y. Ji, C. Shi, B. Wang, Y.F. Ye, P. Cui, P.S. Yu, Heterogeneous graph attention network, in: The World Wide Web Conference, Association for Computing Machinery, 2019: pp. 2022�C2032. https://doi.org/10.1145/3308558.3313562.
[35] JGJ 3-2010 Technical specification for concrete structures of tall building, (2010). https://www.kscecs.com/standard-2091 (accessed April 5, 2024). (in Chinese)
[36] GB 50011-2010 Code for seismic design of buildings, (2010). https://www.kscecs.com/standard-2451 (accessed April 5, 2024). (in Chinese)
[37] C. Zhang, D. Song, C. Huang, A. Swami, N.V. Chawla, Heterogeneous graph neural network, in: Proceedings of the 25th ACM SIGKDD International Conference on Knowledge Discovery & Data Mining, Association for Computing Machinery, 2019: pp. 793�C803. https://doi.org/10.1145/3292500.3330961.
[38] T.N. Kipf, M. Welling, Semi-Supervised classification with graph convolutional networks, in: International Conference on Learning Representations, 2017. https://doi.org/10.48550/arXiv.1609.02907.
[39] P. Veličković, G. Cucurull, A. Casanova, A. Romero, P. Li��, Y. Bengio, Graph attention networks, in: International Conference on Learning Representations, 2018. https://doi.org/10.48550/arXiv.1710.10903.
[40] W.L. Hamilton, R. Ying, J. Leskovec, Inductive representation learning on large graphs, in: Proceedings of the 31st International Conference on Neural Information Processing Systems, Curran Associates Inc., 2017: pp. 1025�C1035. https://doi.org/10.48550/arXiv.1706.02216.
[41] K.M. He, X.Y. Zhang, S.Q. Ren, J. Sun, Deep residual learning for image recognition, in: IEEE Conference on Computer Vision and Pattern Recognition (CVPR), 2016: pp. 770�C778. https://doi.org/10.1109/CVPR.2016.90.
[42] M. Noshad, Y. Zeng, A.O. Hero, Scalable mutual information estimation using dependence graphs, in: IEEE International Conference on Acoustics, Speech and Signal Processing (ICASSP), 2019: pp. 2962�C2966. https://doi.org/10.1109/ICASSP.2019.8683351.
[43] I. Loshchilov, F. Hutter, SGDR: Stochastic gradient descent with warm restarts, in: International Conference on Learning Representations, 2022. https://doi.org/10.48550/arXiv.1608.03983.
[44] YJK Building Software, Y-GAMA, (2024). https://www.yjk.cn/article/836/ (accessed April 23, 2023).
[45] M. Wang, D. Zheng, Z. Ye, Q. Gan, M. Li, X. Song, J. Zhou, C. Ma, L. Yu, Y. Gai, T. Xiao, T. He, G. Karypis, J. Li, Z. Zhang, Deep Graph Library: A Graph-Centric, Highly-Performant Package for Graph Neural Networks, (2020). https://doi.org/10.48550/arXiv.1909.01315.
[46] A. Vaswani, N. Shazeer, N. Parmar, J. Uszkoreit, L. Jones, A.N. Gomez, Ł. Kaiser, I. Polosukhin, Attention is all you need, in: Proceedings of the 31st International Conference on Neural Information Processing Systems, 2017: pp. 6000�C6010. https://doi.org/10.48550/arXiv.1706.03762.
[47] Q.M. Li, Z.C. Han, X.M. Wu, Deeper insights Into graph convolutional networks for semi-supervised learning, in: Proceedings of the AAAI Conference on Artificial Intelligence, 2018. https://doi.org/10.1609/aaai.v32i1.11604.
[48] M. Shimrat, Algorithm 112: Position of point relative to polygon, Communications of the ACM 5 (1962) 434. https://doi.org/10.1145/368637.368653.
Appendix A
The dataset creation and the specific preprocessing steps for graph representation are illustrated in Figure A.1, facilitating the seamless conversion from CAD drawings to heterogeneous graphs.
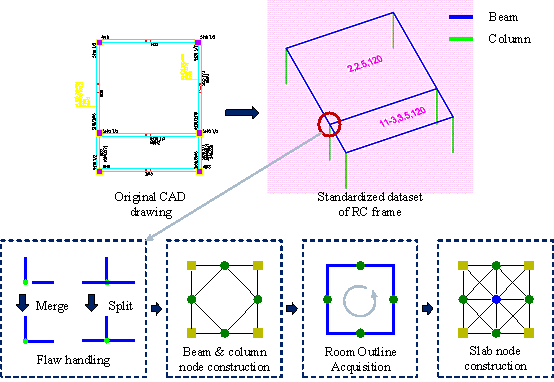
Figure A.1 CAD drawing preprocessing.
A.1 Flaw handling
In CAD drawings, some flaws often hinder subsequent diagram construction, as shown in Figure A.1. Two straightforward algorithms can handle flaws in suboptimal-quality CAD drawings. An intersection coordinate merging algorithm is utilized to address the issue of non-intersecting line segments. This involves traversing all endpoints of the line segments and merging coordinates in the x and y directions that differ by less than a threshold value. The specific methodology is detailed in Algorithm A.1. For the issue where line segments do not break at intersections, a line segment splitting algorithm is used, as outlined in Algorithm A.2. Utilizing these algorithms ensures the correct topological relationships between beams and columns.
|
Algorithm A.1 Merging intersection coordinates |
|
|
Input: List of all line endpoints: points; Numbers of endpoints: k; Maximum threshold for merging: MERGE_THRESHOLD |
|
|
Output: Merged points: points |
|
|
1. |
for dimension = 0 to 1: |
|
2. |
for i = 1 to k: |
|
3. |
for j = i+1 to k: |
|
4. |
length = distance_in_dimension(points[i], points[j], dimension) |
|
5. |
if is_not_zero(length) and length < MERGE_THRESHOLD: |
|
6. |
points[j].coordinate[dimension] = points[i].coordinate[dimension] |
|
7. |
end |
|
8. |
end |
|
9. |
end |
|
10. |
end |
|
11. |
points = deduplicate(points) |
|
12. |
return points |
|
Algorithm A.2 Splitting lines |
|
|
Input: List of all deduplicated lines: lines; List of all deduplicated points: points |
|
|
Output: Merged lines: lines; Merged points: points |
|
|
1. |
i = 0 |
|
2. |
while i < len(lines) do: |
|
3. |
j = i + 1 |
|
4. |
while j < len(lines) do: |
|
5. |
l1 = lines[i] |
|
6. |
l2 = lines[j] |
|
7. |
p = intersection(l1, l2) |
|
8. |
if p is not None: |
|
9. |
lines.remove(l1, l2) |
|
10. |
endpoints = l1.endpoints �� l2.endpoints |
|
11. |
foreach endpoint in endpoints: |
|
12. |
if is_not_same_point(endpoint, p): |
|
13. |
lines.append(build_line(endpoint, p)) |
|
14. |
end |
|
15. |
end |
|
16. |
points.append(p) |
|
17. |
points = deduplicate(points) |
|
18. |
lines = deduplicate(lines) |
|
19. |
j = i |
|
20. |
end |
|
21. |
j += 1 |
|
22. |
end |
|
23. |
i += 1 |
|
24. |
end |
|
25. |
return lines, points |
A.2 Beam and column node construction
After addressing the flaws in the drawings and removing duplicate lines and intersections, the construction of beam and column nodes can be realized, generating the connections between beams and columns. Each line segment represents a graph node, and the coordinates and connections of components are determined based on the deduplicated intersections. The detailed algorithm is provided in Algorithm A.3.
|
Algorithm A.3 Building beam and column nodes |
|
|
Input: List of all deduplicated lines: lines; List of all deduplicated points: points |
|
|
Output: List of nodes: nodes |
|
|
1. |
nodes = [] |
|
2. |
for i = 1 to len(lines): |
|
3. |
node = build_node(lines[i]) |
|
4. |
foreach point in node.endpoints: |
|
5. |
node.point_ids.add(closest_point_id(point)) |
|
6. |
end |
|
7. |
node.endpoints=set(get_points(node.point_ids)) |
|
8. |
foreach point in node.endpoints: |
|
9. |
point.node_ids.add(i) |
|
10. |
end |
|
11. |
nodes.append(node) |
|
12. |
end |
|
13. |
for i = 1 to len(nodes): |
|
14. |
foreach point in nodes[i].endpoints: |
|
15. |
nodes[i].neighbors.update(point.node_ids) |
|
16. |
end |
|
17. |
nodes[i].neighbors.remove(i) |
|
18. |
end |
|
19. |
return nodes |
A.3 Room outline acquisition
After constructing the beam and column nodes, a traversal algorithm can be used to obtain the room outlines, thereby determining the slab boundaries. The specific implementation is summarized as follows: traverse the beam nodes counterclockwise to find loops. Identify the beam node with the smallest counterclockwise angle relative to the current beam node among adjacent beam nodes and add it to the room component list. If a column node exists between two adjacent beam nodes, it is also added to the component list. Repeat the above steps until the initial beam node is reached, completing the room outline identification. Repeat this process to find all room outlines. The detailed method is illustrated in Figure A.2.
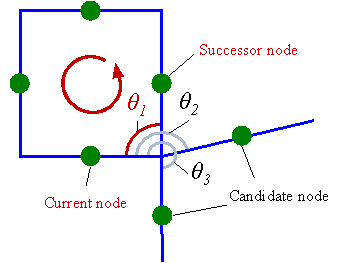
Figure A.2 Traverse counterclockwise to find loops in order to obtain room outlines.
A.4 Slab node construction
After obtaining the room outlines, slab boundary polygons can be established. In CAD drawings, slab attributes are represented by single-line text. By using the ray casting algorithm [48] , it is possible to determine whether the reference point of the single-line text lies within the room contour polygon, thereby obtaining attributes such as room type, load, and slab thickness. This enables the construction of slab nodes. Subsequently, the connections between slab nodes and other nodes can be established based on the component list corresponding to the slab.
Appendix B
To mitigate the risk of overfitting, standard training strategies were implemented. The dataset was rigorously divided into training, validation, and test sets to prevent data leakage. Training was conducted on the training set, the model demonstrating the best performance on the validation set were selected to minimize overfitting. Finally, the model was evaluated on the test set.
The model uses the MSE loss function to assess the discrepancy between predicted and actual values, as shown in Eqaution B.1
![]()
where ![]() represent the actual size,
represent the actual size, ![]() represent the AI-designed size, and
represent the AI-designed size, and ![]() denotes the total number of sizes.
denotes the total number of sizes.
Taking the optimal model identified in Section 3.2.4 as an example, its training process is illustrated in Figure B.1
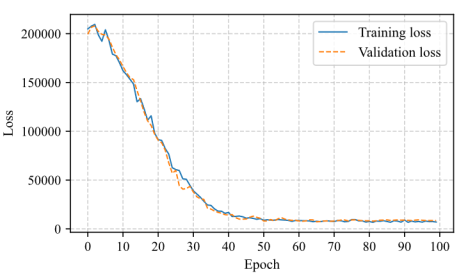
Figure B.1 Training and validation loss of the optimal model.
At the 55-th epoch, the validation loss reached its minimum, with an MSE loss value of 8009.81. Therefore, the model at this point was selected as the optimal model for subsequent testing to prevent overfitting.
To further evaluate whether the
current dataset size is sufficient, the training data size was adjusted. Impact
of training data size on the validation loss and the average size deviation
![]() was analyzed, as shown in Figure B.2.
was analyzed, as shown in Figure B.2.
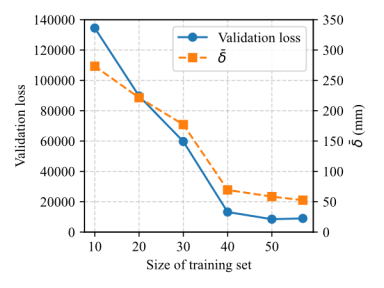
Figure B.2 Impact of training data size on prediction accuracy.
The results indicate that when the training dataset exceeds 40 samples,
the decrease in validation loss and size deviation ![]() gradually slows down. The impact of further increasing
the training dataset on the model��s performance becomes limited. Therefore,
for the current cases of RC frame structure in the validation and test sets,
the training set appears sufficient to meet the requirements for effective
model training. However, for more complex RC frame structure size design tasks,
supplementing the dataset with additional samples is expected to further enhance
the model's design performance.
gradually slows down. The impact of further increasing
the training dataset on the model��s performance becomes limited. Therefore,
for the current cases of RC frame structure in the validation and test sets,
the training set appears sufficient to meet the requirements for effective
model training. However, for more complex RC frame structure size design tasks,
supplementing the dataset with additional samples is expected to further enhance
the model's design performance.