|
Large-scale Experimental Study on the Safety Monitoring for Continuous Rigid Frame Concrete Bridges [1] HUANG Sheng-nan, LU Xin-zheng, YE Lie-ping, LIU Ying-kui (Department of Civil Engineering, Tsinghua University, Beijing 100084, China) Proc. 2006 International Symposium on Safety Science and Technology (2006 ISSST), Science Press, Changsha, China, 2278-2283. Abstract: During the service life of a bridge, it is impossible to avoid damage accumulation and function degeneration due to traffic load, environmental corrosion and accidental punch. Hence, the safety monitoring of bridges have been received wide focus to prevent the sudden fatal accidents. This paper presents a large-scale experimental study on the safety monitoring for continuous rigid frame concrete bridges, which has 3 spans and a total length of 18m. Ten different load steps were tested to simulate different levels of overload, and curvature mode method was adopted to detect the damage after the load cases. By monitoring the changes of curvature modes, the damage detection shows good performance to give the safety situation and the damage position of the bridge. So it can be concluded that this method could be used in real structures to guarantee the safety service of the bridges.Key words: bridge; safety monitoring; damage detection; curvature mode |
|
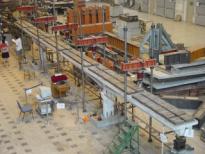
1. Introduction During the service life of a bridge, it is impossible to avoid damage accumulation and function degeneration due to traffic load, fatigue effect and material debasing. And with the recent fast development of the economy in China, over loading happens more frequently than any time in the history, which brings serious safety problem for the bridges. Every year there are lots of reports on the sudden failures of the bridges that induce terrible lost and death. An effective method to avoid sudden failure of bridges is to buildup a safety monitoring system to give an alarm before accidents. An ideal monitoring system should be able to analyze the entire working status of the bridge so as to suggest the optimized repair period and predict the residual life of the bridge, which is generally referred as healthy monitoring system and it has been received lots of attentions in recent years. However, currently such monitoring system is still far from real application. Hence, this research focuses on building up a stable and feasible safety monitoring system to alarm the damage accumulation due to overload. A large-scale continuous rigid frame (CRF) concrete bridge was tested to verify the safety monitoring system. And the test results proved that for such kind of bridges, safety monitoring by analyzing the curvature mode changes is an effective method. 2. Bridge Model and Test Scheme The experimental model was a prestressed lightweight aggregate concrete CRF bridge. The scale between the test model and the background real bridge was 1/4. The three spans of the model bridge were 4.75m, 8.75m and 4.75m (Fig.1) respectively, with a total length of 18.25m. 3kN/m of distributed load was acted on the top of the bridge model so as to give the same internal stress under gravity load as that in the real bridge. Fig.2 was the photo of the bridge model. Fig.1 The model bridge The vehicle loads on the bridge were applied with five oil jacks. And four load patterns were tested to simulate the movement of the vehicles (Fig.3). The whole test process was listed in Table 1. Load Case A, B and C were repeated twice in turn with different load values to simulate various levels of overloaded vehicle movements on the bridge. And Load Case D was finally tested to destroy the bridge so as to obtain the load capacity of the bridge. Fig.2 The photo of bridge model Fig.3 Load cases Table 1 Load cases
Before applying vehicle loads on the bridge, six concrete blocks with a total weight of 3 ton were acted on the bridge to study the long-term deformation developments. Under the long-term load, visible cracks were founded at the mid-span of the bridge and the maximal deflection in the mid-span was 1mm. Some of the cracks under long-term load closed when the load was removed because of the tension of prestressed tendons. Most of the flexural cracks fully propagated during load step 1-3. And the normal steel reinforcement progressively yielded during load step 4-6, whilst the tendon was still elastic. Load step 7-10 was destructive loads. The typical phenomena observed in the test were shown in Table 2. A real safety monitoring system is applicative for the first six load steps corresponding to different overload. However, in this test damage detection was implemented to all load steps to make sure the integrality of the experiment. 3. Safety Monitoring and Damage Detection 3.1. Damage Identification Theory Many damage detection methods have been proposed by different researchers. These method can be divided into three major types: (1) dynamic fingerprint method, (2) model updating and system identification (MUSI) method and (3) artificial neural networks (ANN) approach[1,2,3]. The latter two methods are a little bit more complicated. That is, MUSI method needs the stiffness matrix of the finite element (FE) model. And by solving a reverse problem, the FE model is iteratively modified to find the damage. ANN approach needs huge database to training the networks so as to predict the damage. So they were not easy to be used in real structures. On the Table 2 Typical phenomena in the experiment
contrary, for the dynamic fingerprint method, structures are simplified to be a system that is made up of masses, springs and dampers, so damage can be identified through the change of the dynamic parameters. The commonly used dynamic fingerprints include frequency, displace mode, strain mode, curvature mode etc. Considering of the characteristic of the CRF bridges, especially for the feasibility in real bridges, curvature mode method is adopted in this work [4,5]. The curvature mode can be obtained by either from the displace mode or from the strain response. That is, the curvature can be calculated either from the difference of the displacement or from the strain gradient in the section [6]. Since the frequency and the displace mode are more easily to be obtained by the acceleration transducers. The curvature modes are suggested to be calculated through Eq. 1. And the differences between undamaged structure and damaged structure are compared through Eq. 2.
where, jj is the curvature mode of point j, uj is the displace mode of point j, lj is the distance between two test points, l0 is the reference distance, Iu is the damage index. 3.2. Damage Detection before Loading The frequency of the bridge in the different moment of the construction process was tested, and the results were listed in table 3. Table 3 Frequency test results
3.3. Damage Detection under Service Load The frequency test results were listed in Fig.5. Because of the damage accumulation in the first eight load steps, the frequency of the bridge progressively reduced. However the reduction quality of frequency was very small. So with frequency alone, it was not available to detect the damage for moderately overloaded bridges. However, when the bridge was seriously overloaded, that is load step 8 to load step 10, the frequency changed obviously and visual damage such as large residual displacement and widely opened cracks were found. Fig.4 Curvature mode difference after long-term load Fig.5 Frequency test results Compared to the insensitive frequency, the change of curvature mode was obvious for overloaded bridge. The curvature modes of the first six load steps were compared and discussed as follows. The curvature mode change between load step 1 and load step 2 (Fig.6) was believed mainly due to the propagation of flexural cracks. During load step 1, flexural cracks in the middle span which original initiated by the long-term load progressed, while new flexural cracks initiated in the south span. Such crack propagation resulted in the two peaks of the curve in Fig.6. At the end of load step 1, the cracks in south span and middle span were fully developed. So their value in curvature mode curve did not show obvious change in load step 2 (Fig.6). However, load step 2 was the mostly dangerous load pattern. And the section on the top of the north pier cracked when load reached 20kN in load step 2. The cracking on the north pier induced the obvious curvature mode increase in the north span (Fig.6). Dynamic characteristic was not tested after load step 3. The curvature mode changes during load step 4 to load step 6 were shown in Fig.7. In these load steps, the bridge was under overloading. And from Fig.7 the damage due to overloaded vehicle movement could be clearly observed. In load step 5, when the load reached 45kN, the ordinary steel of the south pier yielded which resulted in the stiffness decrease in a wide range. Accordingly, the peak value of the curvature mode difference rapidly changed from 0.07 to 0.1, which means a much more aggravated damage (Fig.7). At the end of load step 6, after a complete movement of vehicle through the bridge, the final damage was symmetric and all spans had very large curvature mode changes while the damage in the middle span was the most serious one (Fig.7). The results found with curvature mode change were in good agreement with the test observation. Fig.6 Curvature mode difference from load Fig.7 Curvature mode difference from load step 1 to load step 2 step 4 to load step 6 It also should be mentioned that because the prestressing tendon were still in elastic range during load step 4 to 6, the residual displacements of the bridge after these load steps were still relatively small. And the width of the flexural cracks partially closed when vehicle load was removed. So for such bridges, artificial inspection to find the damage after overload sometime could not give the real damage level. And the dynamic damage detection with curvature mode method was relatively more effective. The curvature mode of the two load steps, load step 2 and load step 5, with the same load pattern (load case B) that was the most dangerous one, was compared in Fig.8. It could be found that the maximal damage position were both located in the middle of the mid-span, and the peak value of load step 5 was higher than that of load step 2. As a result, it was valid for curvature mode to detect damage position and to identify damage degree on qualitative analysis. 3.4. Damage Detection under Destructive Loads From load step 7 to load step 10, destructive loads were progressively applied following load case D. Though in these load steps the damage such as residual displacement and crack opening were greatly obvious and safety monitoring was not significant, damage identification was still processed to make sure the integrality of the experiment. In load step 7, the maximum load was 37.5kN and the damage in this load step was not developed by measuring the maximal crack width and the residual displacement. So dynamic damage detection was not measured after this step. In load step 8, in which the deflection in the middle span was 1/300 and the maximal load reached 77kN, medium damage was detected. In load step 9, the deflection in the middle span was 1/60 and the maximal load reached 91kN. After this load step, the bridge was very dangerous. And in load step 10, the bridge was entirely destroyed. Comparing the test results from load step 8 to load step 10, the peak value of the curvature mode difference increased a little, but not obvious. The reason for such phenomenon was explained as follows: The curvature mode method was sensitive to the flexural stiffness change of the bridge. Because the flexural cracks were fully developed in the first six load steps, the stiffness change due to cracking was small in load step 8 to load step 10. Besides, the steel reinforcement had yielded in load step 5. So the stiffness change due to steel yield was also small in load step 8 to load step 10. And the prestressing tendon was still elastic in the last three load steps. Consequently the total flexural stiffness change was small, so that the curvature mode change was also slight. So finally it can be concluded that the curvature mode method is mostly sensitive to the damage such as the flexural crack propagation and the yield of the steel reinforcement, which are the mostly cared damage for real bridges. The location and the quality of the damage can be determined by the peak value of the curvature mode change. However, the precision of the curvature mode method decreases after the yield of the steel reinforcement. 3.5. Damage Detection between Different Load Cases For real bridges, it often cannot get the curvature mode of a perfect undamaged situation. So we often need to find the incremental damage based on bridges with some kind of original damage. To estimate the capability of the curvature mode based on the damaged structures, damage detection between different load cases was analyzed as follows. The state after long-term load was firstly used as the control state to identify incremental damage in load step 1 and load step 2. From Fig.9, it could be clearly found the incremental damage in the south span and the middle span after load step 1, and the progressive damage in the middle span and the north span after load step 2. This was consistent with the load process. The state after load step 2 was also used as the control state to identify damage in load step 4 to 6. The calculated results were shown in Fig.10. In this figure, the damage developed progressively from north to south, corresponding to the load process. At last, an obvious damage increment caused by yielding of steel was found. Under the destructive loads, the load value of load step 8 was equal to that of load step 6, so load step 8 was used as the control state to identify damage in this state (Fig.11). It was shown that all the damage position was in the middle of each span, and the peak value of curvature mode difference increased slightly from load step 9 to load step 10. However, as mentioned above, the precision of the damage detection decreased. It was summed up that curvature mode could detect damage either based on the intact structures or based on the damaged structures. Fig.8 Curvature mode difference under load case B Fig.9 Relative curvature mode difference from load step 1 to load step 2 Fig.10 Relative curvature mode difference from Fig.11 Relative curvature mode difference under load case D load step 4 to load step 6 4. Conclusion The safety monitoring for a large-scale CRF concrete bridge, which has 3 spans and a total length of 18m, was presented in this paper. Dynamic test was processed under long-term loads, service loads, over loads and destructive loads. Curvature mode method was used to detect the damage. It was found that damage which was due to cracking of concrete and yielding of steel could be identified by the curvature mode difference. Damage position could be determined, and the damage level could be estimated qualitatively by the peak value of curvature mode difference. Besides, curvature mode could detect damage not only based on the intact structures but also based on the damaged structures. So the curvature mode method proposed in this paper could be used for the safety monitoring of real bridges. However, after the yield of steel reinforcement, the precision of the damage detection decreased. |
|
Reference [1] Pei Q, Guo X, Zhang M Z. A review of health monitoring and damage detection of bridge structures. Earthquake Engineering and Engineering Vibration, 2003, 23(2): 61-67. (in Chinese) [2] Li H N, Li D S. Safety assessment, health monitoring and damage diagnosis for structures in civil engineering. Earthquake Engineering and Engineering Vibration, 2002, 22(3): 82-90 (in Chinese). [3] Li D B, Lu Q H, Shi Y, Modal analyses and application. Beijing: China Science Press, 2001 (in Chinese). [4] Li D B, Lu Q H, Qin Q. Curvature modal analysis for bending structures. Journal of Tsinghua University (Science and Technology), 42(2): 224-227 (in Chinese). [5] Pandey A K, Biswas M, Samman M M. Damage detection from changes in curvature mode shapes. Journal of Sound and Vibration, 1991, 145(2): 321-332. [6] Liu X R, Cai J, Liu H. Damage diagnosis for bridges. Beijing: China Communication Press, 2002, 173 (in Chinese). |