|
Introduction
During the service life of a bridge, it is impossible
to avoid damage accumulation and function degeneration due to traffic load,
fatigue effect and material debasing. And with the recent fast development of
the economy in China, over loading happens more frequently than any time in
the history, which brings serious safety problem for the bridges. Every year
there are lots of reports on the sudden failures of the bridges that induce
terrible lost and death [1].So precise assessment
for the safety of the bridges is important. However, it is too expensive to
do enough experiments so as to analyze the work state of the bridge. Nonlinear
FE analysis with the consideration of damage accumulation, material nonlinearity
and boundary connection is a powerful tool for this problem, which is cheaper
than test and more accurate than linear FE analysis. But nonlinear FE analysis
for prestressed concrete bridge in China still has not been widely accepted
[2]. Hence, in this paper, a nonlinear FE analysis for a prestressed continuous
rigid frame concrete bridge is implemented with the comparison of a large-scale
bridge experiment so as to discuss the modeling technique and to verify the
result of numerical model. Nonlinear behaviors such as prestress, cracks, crush
of concrete, yield of rebar and contact of support are taken into account. Ten
different load cases to represent different overloads are all simulated in both
FE model and experimental model.
The Experiment Test of a Model Bridge
The experimental model was a prestressed lightweight
aggregate concrete CRF bridge. The scale between the test model and the background
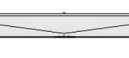
real bridge was 1/4. The three spans of the model bridge were 4.75m, 8.75m and
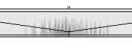
4.75m (Fig.1) respectively, with a total length of 18.25m. 3kN/m of distributed
load was acted on the top of the bridge model so as to give the same internal
stress under gravity load as that in the real bridge. Fig.2 was the photo of
the bridge model
There were ten load
steps in the experiment, in which stage five oil jacks
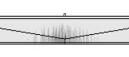
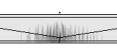
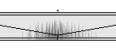
applied as the vehicle loads. And four load patterns were tested to simulate
the movement of the vehicles (Fig.3). The whole test process was listed in Table
1. Load Case A, B and C were repeated twice in turn with different load values
to simulate various levels of overloaded vehicle movements on the bridge. And
Load Case D was finally tested to destroy the bridge so as to obtain the load
capacity of the bridge. In the whole process, dynamic performance was tested
so as to detect damage of the model bridge.
|
Figure 1: The Model Bridge
|
|
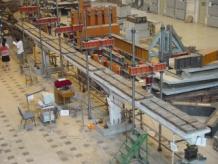
Figure 2: The Photo
of Model Bridge
|
Figure 3: The Load Cases
|
Table 1: Load
cases
|
Load step
|
Load case
|
Load or deformation level
|
Corresponding working status
|
|
1
|
A
|
Maximal load of each jack: 37.5kN.
|
Service state
|
|
2
|
B
|
|
3
|
C
|
|
4
|
A
|
Maximal load
of each jack reaches 50kN in load step 5, and maximal load of each jack
reaches 55kN in load step 4 and load step 6.
|
Over loaded
|
|
5
|
B
|
|
6
|
C
|
|
7
|
D
|
Maximal load of each
jack: 37.5kN.
|
Service state
|
|
8
|
Deformation
in the middle of the mid span reaches 28.3mm. (1/300 of the span)
|
Over loaded
|
|
9
|
Deformation
in the middle of the mid span reaches 60mm. (1/135 of the span)
|
Seriously damaged
|
|
10
|
Load until
destroyed.
|
Destroyed
|
In the test, load
step 1-3 monitored the service state, most of the flexural cracks fully propagated
during load step 1-3. Load step 4-6 monitored
the over loading state, in which the normal steel reinforcement
progressively yielded and the tendon was still elastic.
Load step 7-10 was destructive loads. In the last load step, the bridge
damaged seriously, some cracks expanded through the whole section. However,
because of the tension of prestressed tendons, every part was connected together
and the bridge didn��t collapse. The typical phenomena
observed in the test were shown in Table 2.
Finite Element Analysis
A finite-element model of the model bridge was
established by the software MSC.Marc. Plane stress element was used in this
model because in plane bending
deformation was the main behavior of the bridge. Planar rebar element was adopted for the prestressed tendon model. The nodes
between tendon elements and concrete elements were coupled so that no slip in the rebar-concrete interface is considered.
In the two side support, contact surfaces were introduced to monitoring the real bridge support which can bear
press only (Fig. 4) [3].
Table 2 Typical phenomena in the experiment
|
Loading
state
|
Load step
|
Maximal crack width / mm
|
Steel strain in the mid-span / �̦�
|
Deflection in the mid-span / mm
|
Residual deflection
in mid-span / mm
|
|
Vehicle loads
|
1
|
0.05
|
312
|
4.8
|
0.15
|
|
2
|
0.10
|
872
|
12.5
|
0.65
|
|
3
|
0.10
|
533
|
6.1
|
0.66
|
|
4
|
0.15
|
983
|
11.4
|
0.82
|
|
5
|
0.25
|
1726
|
35.5
|
2.13
|
|
6
|
0.25
|
|
|