6 Conclusion
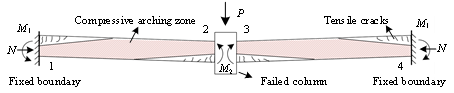
Compressive arch action serves
as a major mechanism to resist progressive collapse in RC frames at the small
deformation stage. An accurate and efficient model to calculate the CAA resistance
has significant value to the progressive collapse design of RC structures.
Existing prediction models can neither meet the engineering practice demands,
nor calculate the CAA resistance of the beam-slab specimens. Based on an experimental
database of 45 beam specimens and 5 beam-slab specimens, and the FE analyses
of 45 beam specimens and 217 beam-slab substructures, explicit
and practical calculation models for CAA for RC beams with and without slabs
are proposed in this study. The main conclusions are:
(1)
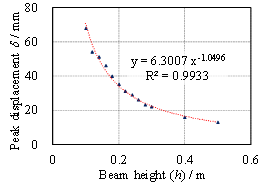
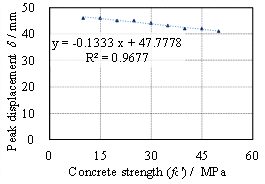
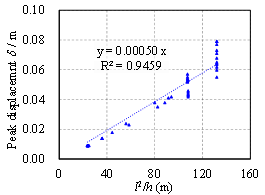
This study proposes a simple and
explicit model capable of calculating the CAA resistance of RC beams based
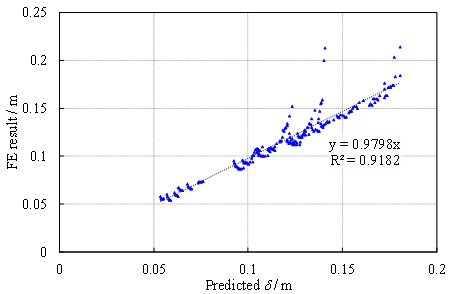
solely on the geometric and reinforcement information. The equations to predict
the peak displacement of CAA is proposed based on the regression of the FE
results of 45 specimens tested by other researchers. More importantly, the
proposed model can be easily mastered by practicing engineers in designing
RC structures against progressive collapse.
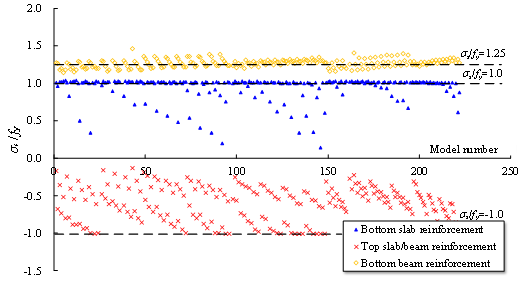
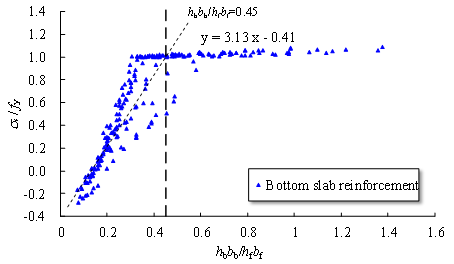
(2)
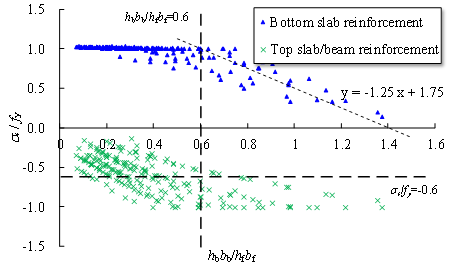
A set of 217 beam-slab substructures
are designed within the most practically used ranges of span length, beam
height, beam width, slab thickness and slab width. The sectional stresses
of concrete and reinforcement of the beam-slab substructures under CAA are
proposed based on the FE results of these beam-slab substructures. The outcome
of this study can help researchers gain a better understanding of the CAA
in RC structures when considering the slab effects. Moreover, these results
provide a foundation for developing the calculation model for CAA for the
beam-slab substructures.
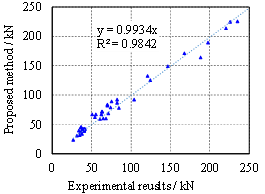
(3)
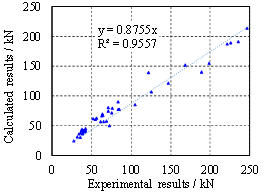
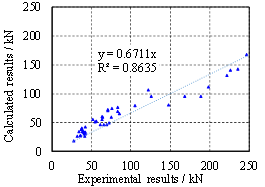
The explicit CAA resistance calculation
model, as well as the corresponding peak displacement prediction method, for
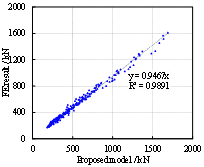
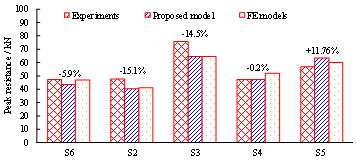
beam-slab substructures is proposed. Comparisons with both the FE and experimental
results confirm that the proposed explicit model is able to accurately calculate
the CAA resistance of RC beam-slab substructures.
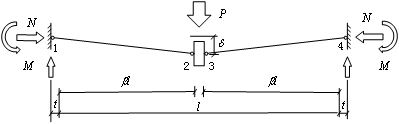
It should be noted that the proposed
model is developed based on the assumptions of fixed boundary conditions at
both beam ends. It should also be recognized that a flexible boundary can
notably influence the progressive collapse resistance of RC structures. Future
studies are therefore needed to investigate such boundary effects, based on
the outcomes of the present study. Correspondingly, the proposed d prediction method and resistance
calculation model should also be updated in order to take into account different
boundary conditions.
Acknowledgement
The authors are grateful for the
financial support received from the National Natural Science Foundation of
China (No. 51778341), and the
European Community's Seventh Framework
Programme (Marie Curie International Research Staff Exchange Scheme, Grant
No. 612607).
References
[1]
Sozen M, Thornton
C, Corley W, Sr P. The Oklahoma City Bombing: structure and mechanisms of
the Murrah Building. J Perform Constr Facil 1998; 12(3): 120-136.
[2] Li Y, Lu XZ,
Guan H, Ye LP. An improved tie force method for progressive collapse resistance
design of reinforced concrete frame structures. Eng Struct 2011; 33(10): 2931-2942.
[3] Li Y, Lu XZ,
Guan H, Ye LP. An energy-based assessment on dynamic amplification factor
for linear static analysis in progressive collapse design of ductile RC frame
structures, Adv Struct Eng 2014; 17(8): 1217-1225.
[4] Li Y, Lu XZ,
Guan H, Ye LP. Progressive collapse resistance demand of RC frames under catenary
mechanism. ACI Struct J 2014; 111 (5): 1225-1234.
[5] Yu J, Tan KH.
Structural behavior of RC beam-column sub-assemblages under a middle column
removal scenario. J Struct Eng 2012; 139(2): 233-250.
[6] Chu
MJ, Zhou YL, Lu XZ, Li Y. An experimental
study on one-way reinforced concrete beam-slab substructures for resisting
progressive collapse. China Civil Engineering Journal 2016; 49(2): 31-40.
(in Chinese)
[7] Ren PQ, Li Y,
Lu XZ, Guan H, Zhou YL. Experimental investigation of progressive collapse
resistance of one-way reinforced concrete beam-slab substructures under a
middle-column-removal scenario. Eng Struct 2016; 118: 28-40.
[8] Lu
XZ, Lin KQ, Li Y, Guan H, Ren PQ, Zhou YL. Experimental investigation of RC beam-slab substructures against
progressive collapse subject to an edge-column-removal scenario. Eng Struct
2017; 149: 91-103.
[9] Yi WJ, He QF,
Xiao Y, Kunnath SK. Experimental study on progressive collapse-resistant behavior
of reinforced concrete frame structures. ACI Struct J 2008; 105(4): 433-439.
[10] Qian K, Li B,
Ma JX. Load-carrying mechanism to resist progressive collapse of RC buildings.
J Struct Eng 2015; 141(2): 04014107.
[11] General Services
Administration (GSA). Alternate path analysis and design guidelines for progressive
collapse resistance. Washington, DC. 2016.
[12] Department of
Defense (DoD). Design of structures to resist progressive collapse. Unified
facility criteria, UFC 4-023-03, Washington, DC. 2016.
[13] Yu J, Tan KH.
Special detailing techniques to improve structural resistance against progressive
collapse. J Struct Eng 2013; 140(3): 04013077.
[14] Su YP, Tian
Y, Song X. Progressive collapse resistance of axially-restrained frame beams.
ACI Struct J 2009; 106(5): 600-607.
[15] Sasani M, Werner
A, Kazemi A. Bar fracture modeling in progressive collapse analysis of reinforced
concrete structures. Eng Struct 2011; 33(2): 401-409.
[16] FarhangVesali
N, Valipour H, Samali B, Foster S. Development of arching action in longitudinally-restrained
reinforced concrete beams. Constr Build Mater 2013; 47: 7-19.
[17] Alogla K, Weekes
L, Augusthus-Nelson L. A new mitigation scheme to resist progressive collapse
of RC structures. Constr Build Mater
2016; 125: 533-545.
[18] Choi H, Kim
J. Progressive collapse-resisting capacity of RC beam-column sub-assemblage.
Mag Concr Res 2011; 63(4): 297-310.
[19] Sadek F, Main
JA, Lew HS, Bao Y. Testing and analysis of steel and concrete beam-column
assemblies under a column removal scenario. J Struct Eng 2011; 137(9): 881-892.
[20] Rankin GIB,
Long AE. Arching action strength enhancement in laterally-restrained slab
strips. Proceedings of the Institution of Civil Engineers-Structures and Buildings
1997; 122(4): 461-467.
[21] Park R, Gamble
WL. Reinforced concrete slabs. John Wiley & Sons 2000.
[22] Yu J, Tan KH. Analytical
model for the capacity of compressive arch action of reinforced concrete sub-assemblages.
Mag Concr Res 2014; 66(3): 109-126.
[23] Kang SB, Tan KH.
Analytical study on reinforced concrete frames subject to compressive arch
action. Eng Struct 2017; 141: 373-385.
[24] American Concrete
Institute (ACI). Building code requirements for structural concrete (ACI 318-14)
and commentary (318R-14). Detroit, MI. 2014.
[25] Niu JX, Su YP,
Wang HX. Tentative studies on collapse resistance capacity of reinforced concrete
frame beam. Proceeding of the 20th National Conference on Structural Engineering.
Beijing: Engineering Mechanics Press 2011; 377-382 (in Chinese)
[26] Chen MH, Song
XS, Su YP. Influence of reinforcement ratio on ultimate bearing capacity of
rein-forced concrete frame beams: test study on arch action. Journal of Natural
Disasters 2010; 1: 44-48. (in Chinese)
[27] Qian K, Li B.
Slab effects on response of reinforced concrete substructures after loss of
corner column. ACI Struct J 2012; 109(6): 845-855.
[28] Prasad S, Hutchinson
TC. Evaluation of older reinforced concrete floor slabs under corner support
failure. ACI Struct J 2014; 111(4): 839-849.
[29] Dat PX, Tan
KH. Experimental study of beam¨Cslab substructures subjected to a penultimate-internal
column loss. Eng Struct 2013; 55: 2-15.
[30] Mazzoni S, McKenna
F, Scott MH, Fenves GL. The open system for earthquake engineering simulation
(OpenSees). User command-language manual. Berkeley:
Pacific Earthquake Engineering Research Center. University of California.
2006.
[31] Ren PQ, Li Y,
Guan H, Lu XZ. Progressive collapse resistance of two typical high-rise RC
frame shear wall structures. J Perform Constr Facil 2015; 29(3): 04014087.
[32] Lin KQ, Li,
Y, Lu XZ, Guan H. Effects of seismic and progressive collapse designs on the
vulnerability of RC frame structures. J Perform Constr Facil 2017; 31(1):
04016079.
[33] Bao Y, Kunnath
SK, El-Tawil S, Lew HS. Macromodel-based simulation of
progressive collapse: RC frame structures. J Struct Eng 2008; 134(7):
1079-1091.
[34] Talaat M, Mosalam
KM. Modeling progressive collapse in reinforced concrete buildings using direct
element removal. Earthq Eng Struct Dyn 2009; 38(5): 609-634.
[35] Kazemi-Moghaddam
A, Sasani M. Progressive collapse evaluation of Murrah Federal Building following
sudden loss of column G20. Eng Struct 2015; 89: 162-171.
[36] Pan WH, Tao
MX, Nie JG. Fiber beam-column element model considering reinforcement anchorage
slip in the footing. B Earthq Eng 2017; 15(3): 991-1018.
[37] Yu J, Tan KH.
Experimental and numerical investigation on progressive collapse resistance
of reinforced concrete beam column sub-assemblages. Eng Struct 2013; 55: 90-106.
[38] Ministry of
Housing and Urban-Rural Development of the People¡¯s Republic of China (MOHURD).
Code for design of concrete structures. GB50010-2010, Beijing, China. 2010.
(in Chinese)
Appendix A
A set of 50 tests considering a mid-column
removal scenario are collected from published literature, of which 45 are beam
specimens [5-7, 10, 13-17, 25-26]
and 5 are beam-slab specimens [7].
Table A.1. Summary of beam specimens [5-7, 10,
13-17, 25-26].
|
Reference
|
No.
|
Specimen
|
Boundary stiffness
/ kN/m*1
|
Beam section
|
Total length
l/mm
|
Longitudinal
reinforcement
|
Material properties
|
Capacity of
CAA
|
Analytical
result
|
|
Height h/mm
|
Width b/mm
|
Top
|
Mid
|
Bottom
|
fc' (cylinder)
/MPa
|
fy/MPa
|
Disp. /mm
|
Force
/kN
|
Axial force
/ kN
|
Peak resistance
/kN
|
|
Chu et al.
2016
|
1
|
B1
|
Not given
|
170
|
85
|
4000
|
2¦µ8+1¦µ6
|
/
|
2¦µ8
|
35.20
|
370 (¦µ8),
460 (¦µ6)
|
42.65
|
26.93
|
154.36
|
23.29
|
|
Ren et al.
2016
|
2
|
B3
|
Not given
|
200
|
85
|
4000
|
2¦µ8+1¦µ6
|
/
|
2¦µ8
|
35.20
|
450 (¦µ8),
430 (¦µ6)
|
33.33
|
41.00
|
209.88
|
38.31
|
|
Su et al. 2009
|
3
|
A1
|
1¡Á106
|
300
|
150
|
2700
|
2¦µ12
|
/
|
2¦µ12
|
25.84
|
350
|
48.00
|
168.00
|
353.45
|
171.41
|
|
4
|
A2
|
1¡Á106
|
300
|
150
|
2700
|
3¦µ12
|
/
|
3¦µ12
|
28.24
|
350
|
56.40
|
221.00
|
380.39
|
213.97
|
|
5
|
A3
|
1¡Á106
|
300
|
150
|
2700
|
3¦µ14
|
/
|
3¦µ14
|
31.20
|
340
|
76.40
|
246.00
|
408.91
|
256.85
|
|
6
|
A4
|
1¡Á106
|
300
|
150
|
2700
|
2¦µ12
|
/
|
1¦µ14
|
23.04
|
350 (¦µ12),
340 (¦µ14)
|
65.00
|
147.00
|
320.77
|
148.99
|
|
7
|
A5
|
1¡Á106
|
300
|
150
|
2700
|
3¦µ12
|
/
|
2¦µ12
|
26.48
|
350
|
70.70
|
198.00
|
360.73
|
189.34
|
|
8
|
A6
|
1¡Á106
|
300
|
150
|
2700
|
3¦µ14
|
/
|
2¦µ14
|
28.64
|
340
|
69.20
|
226.00
|
384.78
|
224.50
|
|
9
|
B1
|
1¡Á106
|
300
|
150
|
4200
|
3¦µ14
|
/
|
3¦µ14
|
18.56
|
340
|
100.00
|
125.00
|
267.55
|
125.36
|
|
10
|
B2
|
1¡Á106
|
300
|
150
|
5700
|
3¦µ14
|
/
|
3¦µ14
|
19.28
|
340
|
102.00
|
82.90
|
270.14
|
86.88
|
|
11
|
B3
|
1¡Á106
|
300
|
150
|
5700
|
3¦µ14
|
/
|
2¦µ14
|
21.12
|
340
|
85.50
|
74.70
|
294.36
|
78.69
|
|
12
|
C1
|
1¡Á106
|
200
|
100
|
2700
|
2¦µ12
|
/
|
2¦µ12
|
15.92
|
350
|
33.70
|
60.90
|
105.54
|
59.24
|
|
13
|
C2
|
1¡Á106
|
200
|
100
|
2700
|
2¦µ12
|
/
|
2¦µ12
|
16.80
|
350
|
33.50
|
64.90
|
111.12
|
60.22
|
|
14
|
C3
|
1¡Á106
|
200
|
100
|
2700
|
2¦µ12
|
/
|
2¦µ12
|
16.32
|
350
|
28.70
|
68.60
|
108.08
|
59.69
|
|
Chen
et al. 2010
|
15
|
KLJ-3
|
1.375¡Á106
|
290
|
145
|
2700
|
2¦µ12
|
/
|
1¦µ14
|
25.20
|
354
(¦µ12),
341 (¦µ14)
|
55.10
|
189.00
|
339.47
|
164.16
|
|
16
|
KLJ-6
|
1.375¡Á106
|
305
|
160
|
2700
|
3¦µ12
|
/
|
3¦µ14
|
24.88
|
354
(¦µ12),
341 (¦µ14)
|
67.10
|
235.00
|
383.92
|
225.65
|
|
17
|
KLJ-9
|
1.375¡Á106
|
294
|
144
|
2700
|
3¦µ14
|
/
|
2¦µ20
|
28.80
|
341
(¦µ14),
340 (¦µ20)
|
51.74
|
259.00
|
384.76
|
248.65
|
|
Niu
et al. 2011
|
18
|
FA1
|
Not
given
|
300
|
150
|
5700
|
2¦µ14
|
/
|
2¦µ14
|
15.85
|
395
|
75.54
|
55.73
|
234.38
|
66.87
|
|
19
|
FB1
|
Not
given
|
300
|
150
|
5700
|
3¦µ14
|
/
|
2¦µ14
|
12.57
|
395
|
79.08
|
64.04
|
185.87
|
71.57
|
|
20
|
FB2
|
Not
given
|
300
|
150
|
5700
|
3¦µ14
|
/
|
3¦µ14
|
15.95
|
395
|
110.38
|
75.60
|
235.92
|
89.17
|
|
21
|
FC1
|
Not
given
|
300
|
150
|
5700
|
3¦µ16
|
/
|
2¦µ16
|
13.74
|
333
|
59.51
|
84.93
|
203.14
|
78.15
|
|
22
|
FC2
|
Not
given
|
300
|
150
|
5700
|
3¦µ16
|
/
|
3¦µ16
|
13.73
|
333
|
104.02
|
104.45
|
203.03
|
92.14
|
|
Yu & Tan
2013a
|
23
|
S1
|
1.06¡Á105
|
250
|
150
|
5750
|
2¦µ10+
1¦µ13
|
/
|
2¦µ10
|
31.20
|
511
|
78.00
|
41.64
|
89.87
|
42.67
|
|
24
|
S2
|
1.06¡Á105
|
250
|
150
|
5750
|
3¦µ10
|
/
|
2¦µ10
|
31.20
|
511
|
73.00
|
38.38
|
41.15
|
33.65
|
|
25
|
S3
|
4.29¡Á105
|
250
|
150
|
5750
|
3¦µ13
|
/
|
2¦µ10
|
38.20
|
511 (¦µ10),
494 (¦µ13)
|
74.40
|
54.47
|
259.84
|
62.32
|
|
26
|
S4
|
4.29¡Á105
|
250
|
150
|
5750
|
3¦µ13
|
/
|
2¦µ13
|
38.20
|
494
|
81.00
|
63.22
|
275.87
|
71.86
|
|
27
|
S5
|
4.29¡Á105
|
250
|
150
|
5750
|
3¦µ13
|
/
|
3¦µ13
|
38.20
|
494
|
74.50
|
70.33
|
275.87
|
81.89
|
|
28
|
S6
|
4.29¡Á105
|
250
|
150
|
5750
|
3¦µ16
|
/
|
2¦µ13
|
38.20
|
494 (¦µ13),
513 (¦µ16)
|
114.40
|
70.33
|
275.87
|
83.90
|
|
29
|
S7
|
4.29¡Á105
|
250
|
150
|
4550
|
3¦µ13
|
/
|
2¦µ13
|
38.20
|
494
|
74.40
|
82.82
|
218.74
|
92.57
|
|
30
|
S8
|
4.29¡Á105
|
250
|
150
|
3350
|
3¦µ13
|
/
|
2¦µ13
|
38.20
|
494
|
45.90
|
121.34
|
210.95
|
132.35
|
|
Yu & Tan
2013b
|
31
|
F1-CD
|
4.29¡Á105
|
250
|
150
|
5750
|
3¦µ13
|
/
|
2¦µ13
|
27.54
|
488
|
87.00
|
51.10
|
276.91
|
66.68
|
|
32
|
F2-MR
|
4.29¡Á105
|
250
|
150
|
5750
|
3¦µ13
|
/
|
2¦µ13
|
27.54
|
488
|
51.00
|
62.84
|
276.91
|
66.68
|
|
Sasani et al.
2011
|
33
|
P1
|
Not given
|
190
|
190
|
4170
|
5¦µ9.5
|
/
|
2¦µ9.5
|
41.00
|
516
|
92.43
|
71.79
|
426.83
|
68.69
|
|
Qian et al.
2015
|
34
|
P1
|
Not given
|
180
|
100
|
4000
|
2¦µ10
|
/
|
2¦µ10
|
19.90
|
437
|
35.75
|
31.60
|
113.42
|
30.72
|
|
35
|
P2
|
Not given
|
140
|
80
|
2800
|
2¦µ10
|
/
|
2¦µ10
|
20.80
|
437
|
32.85
|
35.50
|
75.74
|
31.31
|
|
FarhangVesali
et al. 2013
|
36
|
1
|
Not given
|
180
|
180
|
4400
|
2¦µ10
|
/
|
2¦µ10
|
30.50
|
620
|
49.00
|
40.50
|
302.38
|
39.39
|
|
37
|
2
|
Not given
|
180
|
180
|
4400
|
2¦µ10
|
/
|
2¦µ10
|
27.00
|
620
|
44.00
|
35.70
|
268.81
|
35.89
|
|
38
|
3
|
Not given
|
180
|
180
|
4400
|
2¦µ10
|
/
|
2¦µ10
|
30.00
|
620
|
50.00
|
41.40
|
298.68
|
39.10
|
|
39
|
4
|
Not given
|
180
|
180
|
4400
|
3¦µ10
|
/
|
3¦µ10
|
26.00
|
620
|
54.00
|
40.10
|
258.86
|
41.67
|
|
40
|
5
|
Not given
|
180
|
180
|
4400
|
3¦µ10
|
/
|
3¦µ10
|
29.50
|
620
|
54.00
|
41.60
|
293.70
|
41.91
|
|
41
|
6
|
Not given
|
180
|
180
|
4400
|
3¦µ10
|
/
|
3¦µ10
|
30.00
|
620
|
52.00
|
39.40
|
298.68
|
42.21
|
| |
|
|
|
|
|
|
|
|
|
|
|
|
|
|
|
|
Alogla et al.
2016
|
42
|
SS1
|
1¡Á105
|
250
|
`150
|
5750
|
3¦µ10
|
/
|
2¦µ10
|
19.35
|
510
|
101.00
|
34.00
|
128.28
|
39.50
|
|
43
|
SS2
|
1¡Á105
|
250
|
150
|
5750
|
3¦µ10
|
2¦µ10
|
2¦µ10
|
19.35
|
510
|
96.80
|
37.90
|
128.28
|
39.50
|
|
44
|
SS3
|
1¡Á105
|
250
|
150
|
5750
|
3¦µ10
|
2¦µ10
|
2¦µ10
|
19.86
|
510
|
86.80
|
37.20
|
128.97
|
45.68
|
|
45
|
SS4
|
1¡Á105
|
250
|
150
|
5750
|
3¦µ10
|
2¦µ10
|
2¦µ10
|
19.86
|
510
|
91.40
|
36.70
|
128.97
|
43.83
|
Note: *1 The
boundary stiffness is used to calculate the boundary movement t, which
is required in Equations 2-3 in the Park & Gamble¡¯s model.
Table A.2. Summary of beam-slab specimens [7].
|
Reference
|
Specimen
|
Beam section
|
Beam reinforcement
|
Slab section
|
Slab reinforcement
|
Total length
l/mm
|
Material properties
|
Capacity of
CAA
|
Analytical
result
|
|
h/mm*1
|
bb/mm
|
Top
|
Bottom
|
hf/mm
|
bf/mm
|
Longitudinal
and transverse
|
fc' (cylinder)
/ MPa
|
fy / MPa
|
Disp.
/mm
|
Force
/kN
|
Axial force
/ kN
|
Peak resistance
/kN
|
|
Top
|
Bottom
|
|
Ren et al.
2016
|
S6
|
170
|
85
|
2¦µ8+1¦µ6
|
2¦µ8
|
50
|
2000
|
¦µ6@190
|
¦µ6@190
|
4000
|
35.20
|
390(¦µ8),
387(¦µ6),
370 (¦µ10)
|
42.00
|
47.33
|
741.70
|
44.56
|
|
S2
|
170
|
85
|
2¦µ8+1¦µ6
|
2¦µ8
|
50
|
685
|
¦µ6@190
|
¦µ6@190
|
4000
|
35.20
|
40.00
|
47.29
|
326.84
|
40.17
|
|
S3
|
200
|
85
|
2¦µ8+1¦µ6
|
2¦µ8
|
50
|
2000
|
¦µ6@190
|
¦µ6@190
|
4000
|
35.20
|
38.00
|
75.49
|
784.63
|
64.57
|
|
S4
|
170
|
85
|
3¦µ10
|
2¦µ10
|
50
|
2000
|
¦µ6@190
|
¦µ6@190
|
4000
|
35.20
|
37.00
|
47.17
|
728.01
|
47.09
|
|
S5
|
170
|
85
|
2¦µ8+1¦µ6
|
2¦µ8
|
75
|
2000
|
¦µ6@160
|
¦µ6@160
|
4000
|
35.20
|
32.00
|
56.72
|
1297.90
|
63.39
|
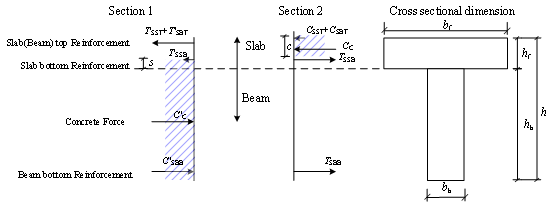
Note: *1 Definitions
of h, bb, hf and bf
are given in Fig. 7 and Table 1.
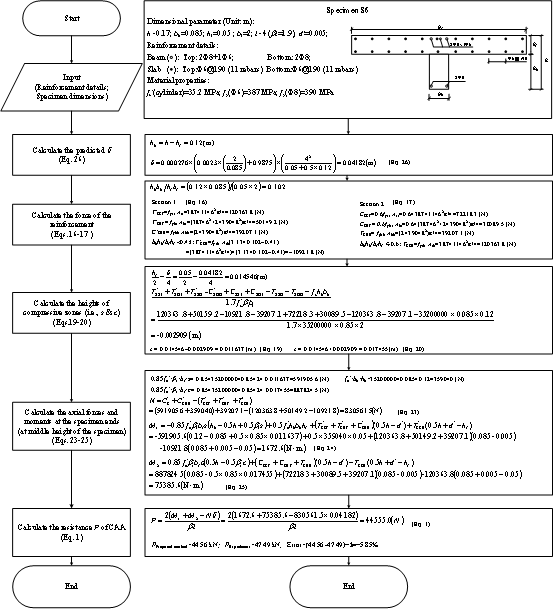
Appendix B
Detailed CAA resistance
calculation procedure for the beam-slab specimen (Specimen S6 of Ren et al.
[7]).
* Corresponding author, Email: luxz@tsinghua.edu.cn
|