Load Transfer and Collapse Resistance of RC Flat Plates under Interior Column Removal Scenario

Huizhong Xue 1, Benoit P. Gilbert 2, Hong Guan 3, Xinzheng Lu 4, Yi Li 5, Fuhao Ma 6£¬Ying Tian 7

Journal of Structural Engineering-ASCE, 2018, 144(7): 04018087-1.

Download Full Text PDF

ABSTRACT

Reinforced concrete (RC) flat plate structures are vulnerable to punching shear failure at their slab-column connections, potentially leading to catastrophic progressive collapse. In practice, the slab-column connection above a removed interior column may be subjected to a concentrated downward force due to the absence of the supporting column and further being pushed due to different live load intensities on individual stories. This force is different to the full design load that the column withstands in normal situation and, combined to the gravity load acting on the slab, may cause punching shear failure at the interior slab-column connection. This will further trigger failure propagation to the surrounding slab-column joints. This paper presents the experimental tests performed on two identical large scale 2´2-bay RC flat plate specimens under an interior column removal scenario. A 5 kPa uniformly distributed load was applied first to the slab followed by an incremental concentrated force imposed on the joint above the removed interior column. The complete collapse resistant behaviour and the load redistribution pattern of the specimens were investigated and are reported herein. Results show that more than 90% of the applied concentrated force is solely distributed to the four edge columns. Three load carrying mechanism phases, in form of flexure, tensile membrane, and a combination of one-way catenary and dowel actions can be distinguished in resisting the applied concentrated load.

Keywords: RC flat plates; progressive collapse; interior column removal; punching shear.

INTRODUCTION

Background

Reinforced concrete (RC) flat plate structures directly transfer gravity loads from the slab to columns without beams, drop panels and column capitals. This type of structure is widely used in the construction industry due to its minimalist architectural style, ease of formwork installation and low construction cost. However, RC flat plate structures are prone to punching shear failure due to high shear stresses at the slab-column connections (Park and Gamble 2000) . Moreover, when unbalanced bending and torsional moments act concurrently at these connections, the punching shear capacity of the structure is further reduced, which complicates the analysis of the punching shear failure mechanism (Hawkins and Mitchell 1979; Loo and Guan 1997) .

While punching shear failure may occur at a single slab-column connection, damage may propagate through parts of or even the entire structure as a result of load redistribution, leading to what is referred to as ¡°progressive collapse¡± (ASCE/SEI 7 2010) . Initial localised damages inducing progressive collapse are usually caused by abnormal loading events, such as overloading, explosions, natural disasters or vehicle impacts. One of the most tragic examples of progressive collapse of a flat plate structure was the Sampoong Department Store collapse in Seoul, 1995, due to initial punching shear failure as a result of overloading of the top storey slab, claiming 502 lives (Park 2012) . Another less disastrous event was the Pipers Row car park collapse in Wolverhampton, 1997, due to inadequate punching shear capacity attributed to design flaws, low material quality and poor detailing during construction (Wood 2003) . These two failure cases indicate that total or partial progressive collapse of RC flat plate structures can occur following an initial punching shear failure at a single slab-column connection. Therefore, gaining an in-depth understanding of the progressive collapse mechanisms of this type of structure can lead to rational and safe designs thereby preventing and mitigating such undesirable events.

Existing work on Progressive Collapse of RC Flat Plates

According to the international design specifications (DoD 2009; GSA 2013) , the capacity of a structure to resist progressive collapse after a localised damage can be assessed, depending on its risk category, using the alternate load path (ALP) method. This method, regardless of the building type and the event causing the loss of the structural element, is used to evaluate the capacity of the structure to bridge over a notionally removed vertical load-bearing element.

The structural behaviour of RC frame (beam-column) structures under a column removal scenario has been studied analytically (Alogla et al. 2017; Li et al. 2011; Li et al. 2014; Qian and Li 2013) , experimentally (Lu et al. 2017; Qian and Li 2012; Qian and Li 2012; Qian et al. 2015; Ren et al. 2016; Xiao et al. 2015; Yi et al. 2008) and numerically (Kim et al. 2009; Pham et al. 2017; Pham et al. 2016) to some extent. Fewer published studies are pertinent to the progressive collapse of RC flat plate structures. Hawkins and Mitchell (1979) discussed the damage propagation mechanisms of RC flat plates and proposed a prediction method to calculate their post failure capacity considering the tensile membrane action. Mitchell and Cook (1984) analytically investigated the typical slab behaviours of RC slabs undergoing progressive collapse under different boundary conditions. These two studies emphasised the necessity of having continuous bottom reinforcing bars passing through columns (also referred to as ¡°integrity bars¡±) to enhance the post failure capacity in progressive collapse events. Keyvani et al. (2014) proposed a numerical model for simulating slab-column connections taking into account the enhancement of the punching shear capacity provided by the compressive membrane action. Their work indicated that the compressive membrane action can be appropriately simulated by adding partial lateral restraints to the slab-column connections. Liu et al. (2015) developed a numerical model for slab-column joints with the flexural, torsional, in-plane and shear behaviour being considered for progressive collapse analyses. The joint model was further applied to conduct a parametric study of a flat plate building. Their analyses demonstrated that, to achieve the same level of progressive collapse resistant capacity, dynamically removing columns requires a higher degree of structural redundancy than a quasi-static column removal case. Russell et al. (2015) experimentally tested the dynamic responses of RC flat plates after a sudden release of a corner or edge support, which were then compared with the counterpart static test results, from which the dynamic effects were quantified. For the interior column removal scenario of RC flat plates, two experimental studies (Qian and Li 2015; Yi et al. 2014) were performed on large-scale substructures, illustrating their structural responses and collapse resistances under increasing uniformly distributed loads (UDL).

Load Conditions for RC Flat Plate Structures under Column Removal

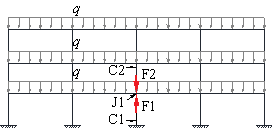
At the onset of a column removal in an RC flat plate structure, the slab-column connection (J1) above the ground level column, C1, is subjected to a downward force (F2) transferred from the column above (C2) and a balancing upward force (F1) provided by C1, as shown in Fig. 1 (a) on an idealised 2D RC flat plate structure. If the structure encounters a loss of C1, and is therefore equivalent to the absence of F1, F2 will then be distributed instantly to the adjacent slab-column joints (Pham and Tan 2013) , potentially causing progressive collapse of the structure. During this load redistribution process, punching shear failure may occur at J1 due to the excessive downward pushing force F2. This represents a scenario in which J1 is subjected to a downward concentrated force.

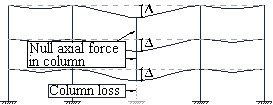
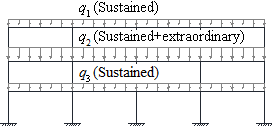
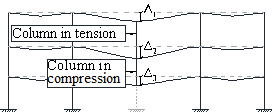
In addition to the aforementioned downward force F2, further push down force may exist in column C2 due to different live load patterns. When an RC flat plate structure is designed with the same live load intensity acting on each floor, all the floors will deform the same with no additional axial force developed in C2 and columns above (Fig. 1 (b)). This scenario has been typically considered when examining the progressive collapse resistance of RC flat plate structures (Qian and Li 2015; Yi et al. 2014) . However, in a real-life situation, the floors may be designed to bear different live load intensities (Fig. 1 (c)), depending on their various functional purposes. Moreover, the live load acting on each floor can be divided into two components consisting of a sustained live load due to routine use of the structure (i.e. weight of furniture, people, moveable equipment¡­etc.) and an extraordinary live load representing intermittent events such as crowd gathering, temporary storage during refurbishing or emergencies (Corotis and Sentler 1989; Ellingwood and Rosowsky 1991; Hendrickson et al. 1987; Rosowsky and Ellingwood 1992) . The occurrence of the extraordinary live load will further enlarge the load disparities between floors. Therefore, after C1 is removed, different deformations of each floor may be expected in a real building and additional axial forces will develop accordingly in the columns above C1. These axial forces may not be negligible and will likely affect the overall progressive collapse resistance of the structure. Such a phenomenon is illustrated in Fig. 1 (d) where all floors but the 1st floor are loaded with a sustained live load, while the 1st floor is more heavily loaded with both sustained and extraordinary live loads. Under this circumstance, the column between the 1st and 2nd floors C2 is thus loaded in compression whereas the column between the 2nd and 3rd floor C3 is loaded in tension.

Note that the study of large-deformation structural responses of RC flat plates under an interior column removal scenario is particularly limited when the abovementioned concentrated load condition is considered. Further, the overall redistribution of the concentrated force is yet to be quantified, which is essential to assess the progressive collapse resistance of the structure.

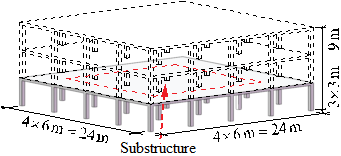
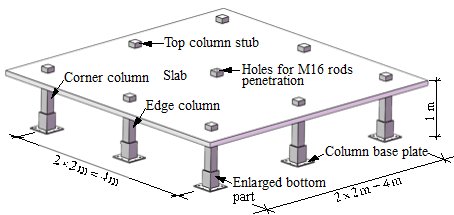
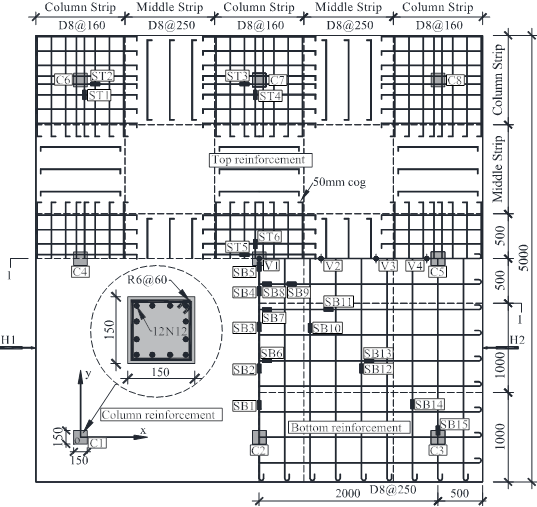
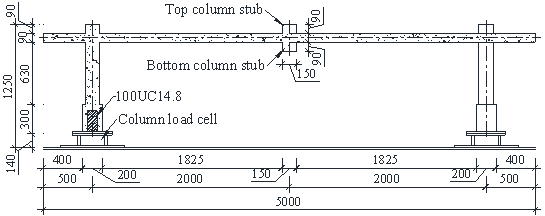
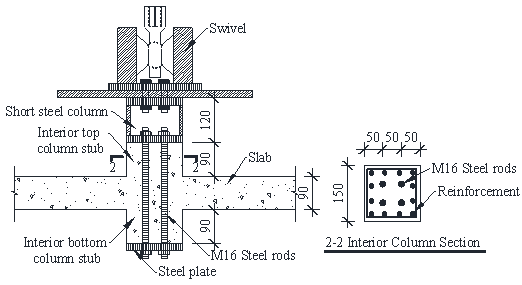
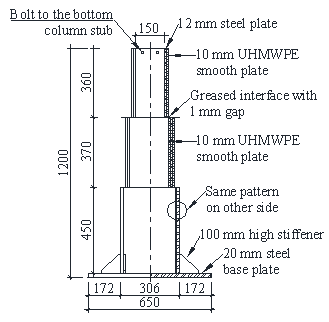
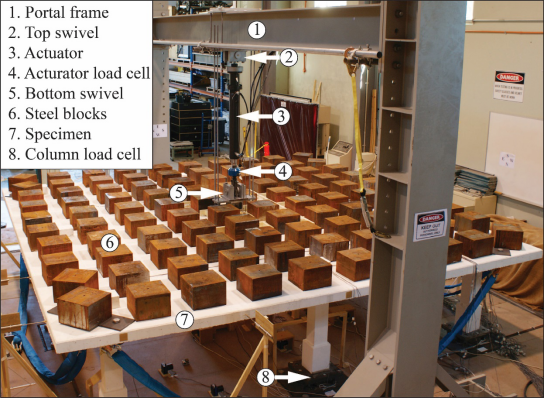
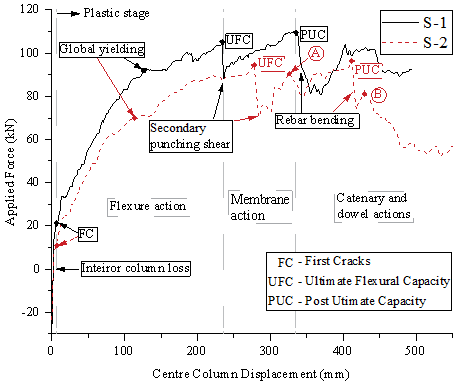
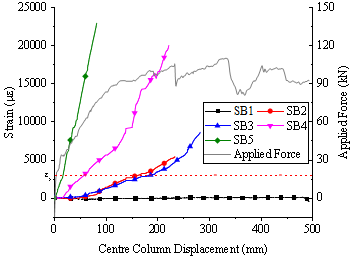
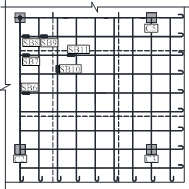
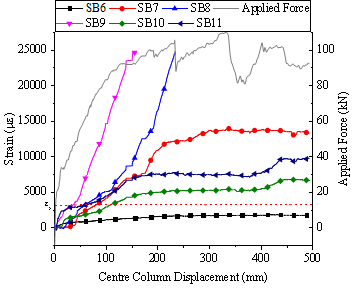
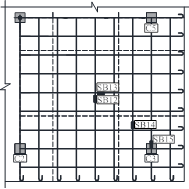
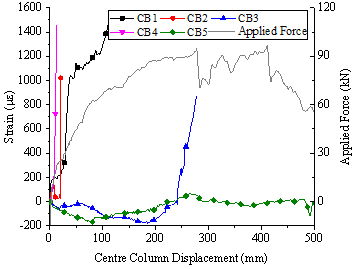
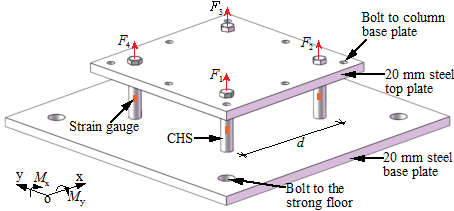
Note further that the existing studies on post-punching shear failure behaviour has been mainly conducted on isolated slab-column connections (Melo and Regan 1998; Ruiz et al. 2013) , thus limiting the scope of fully investigating the alternate load path against the progressive collapse. As such, a quasi-static laboratory test of multi-column RC flat plate substructures is desirable to assess their load-carrying capacities to better understand their overall structural responses after the loss of a column. In this study, an interior column removal scenario is considered and two nominally identical 2´2-bay substructure specimens (1/3 scale) were constructed and tested using the same loading procedures at Griffith University to confirm repeatability. Note that both specimens were subjected to the combined action of the live load and the concentrated load induced by the column above. This paper presents the test setup and discusses the overall structural response of the specimens. Especially, the overall displacement of the slab and strain results of the concrete slab and steel reinforcement are reported. The concentrated force redistribution pattern and the complete collapse resistant behaviour of the interior slab-column joint are also investigated and discussed.

(a)

(b)

(c)

(d)

Fig. 1 Flat plates under a: (a) & (b) typical design load case; (c) & (b) real scenario with different loading intensities

EXPERIMENTAL PROGRAM

Specimen Preparation

A 2´2-bay, nine-column substructure was extracted from the 1st floor of a four stories car park prototype structure (shown in Fig. 2 (a)) designed based on the Australian Concrete Standard (AS3600 2009) . The original slab had a thickness of 270 mm, resulting in a 6.68 kPa uniformly distributed dead load. A live load of 5 kPa, representing a medium vehicle traffic condition, was adopted in the design. The substructure was scaled by a factor of 1/3 for testing, which falls into the typical range used in experimental investigation of the structural behaviour of similar concrete specimens (Lu et al. 2017; Qian and Li 2015; Ren et al. 2016; Yi et al. 2014) . The scaled substructure had a 2,000 mm centre-to-centre span and a 1,000 mm column height. The slab was 90 mm thick and the column cross-section was 150´150 mm. The substructure slab had a 500 mm overhang around its perimeter to simulate the rotational restraints provided by the surrounding slabs. Given that the substructure was extracted from the centre of the carpark building, see Fig. 2 (a), all column-slab joints were interior to the building. However, for the isolated substructure considered in this study, the eight columns surrounding the interior column are subsequently referred to as the ¡°edge¡± and ¡°corner¡± columns.

(a)

(b)

Fig. 2 Flat plate model for (a) substructure extraction; (b) test specimen

Two identical test specimens, without the interior column (Fig. 2 (b)), identified as S-1 and S-2, were constructed, using 32 MPa nominal strength concrete (AS1379 2007) to confirm repeatability of the test results. Deformed 8 mm diameter N ductility class bars (D500N8) (AS/NZS4671 2001) were used as bending reinforcement in the slabs with a 10 mm concrete cover. Rebar spacing was determined to maintain the same reinforcement ratios (given in Table 1 ) as the prototype structure. Columns were over-strengthened using 12 mm diameter bars of nominal 500 MPa grade to prevent undesired damage. Detailed reinforcement layouts for the top and bottom layers, as well as those for the columns, are presented in Fig. 3 (a). The sectional view of the substructure is shown in Fig. 3 (b).

Table 1. Reinforcement ratios for slabs


Column Strip

Middle Strip

Top Reinforcement

0.489%

0.279%

Bottom Reinforcement

0.237%

0.237%

(a)

(b)

Fig. 3 Specimen details: (a) reinforcement details and instrumentation; (b) 1-1 section

Note: V1 to V4 and H1 to H2 = Vertical and horizontal LVDT positions; C1 to C8 = columns; ST = strain gauges for top layer reinforcement; SB = strain gauges for bottom layer reinforcement.

Test Setup

General

The experimental conditions were also designed to be identical for both specimens S-1 and S-2. For each specimen, the eight columns supporting the slab were cast on 20 mm thick steel base plates bolted to the test rig. To establish a rigid connection between each base plate and the column above, a 220 mm high universal column (100UC14.8 in Fig. 3 (b)) was welded to each base plate and therefore produced an enlarged cross-section of 200´200 mm at the column base. The 100UC14.8 were ribbed using shear connectors to bond to the concrete. As typically occurring in construction, the eight columns were cast firstly using nominal 32 MPa concrete and then installed on the strong floor. Their longitudinal reinforcing bars were extended 80 mm beyond the expected top surface of the slab enabling the top column stubs to be built. The slab was then poured on top of the columns at least two weeks after casting the columns and nine 90 mm high column stubs on the top of the slab were created to form vertical continuity in the columns. In addition, a 90 mm high bottom column stub underneath the slab was also created at the location of the interior removed column. A temporary column was positioned to replace the interior column before pouring the slab to create an actual initial ¡°intact¡± condition. The interior top and bottom column stubs were also over-reinforced, similar to other columns. After at least 28 days of slab concrete curing, the interior slab-column joint was connected to the hydraulic jack system using four M16 rods shown in Fig. 4 (a). Before testing, the temporary column was removed and its reaction force was shifted to the actuator, as detailed in Section ¡°Loading Sequence¡±.

To prevent lateral displacement and rotation of the removed interior column, a telescopic tube system consisting of three different sized steel tubes was rigidly connected to the bottom column stub to guide the interior slab-column connection (Fig. 4 (b) and (c)) to displace vertically through sliding of the tubes. Greased ultra-high-molecular-weight polyethylene (UHMWPE) smooth plates were glued to the sliding contact surfaces to minimise friction. The complete test setup is shown in Fig. 5 .

(a)

(b)

(c)

Fig. 4. Interior slab-column joint configuration (dimensions in mm): (a) hydraulic jack connection to interior slab-column connection; (b) telescopic tube configuration and (c) telescopic tube

Fig. 5 Test rig and setup

Loading Sequence

As mentioned in the introduction, under a column loss scenario in a real life event, the slab is subjected to two types of loading: (1) a uniformly distributed load (UDL) acting on the slab, and (2) a concentrated load imposed at the slab-column connection due to different live load intensities acting on each floor. Note that while the instantaneous loss of a column in a structure is essentially a dynamic process, the final force distribution pattern is not influenced by loading rate (Russell et al. 2015) . Therefore in this study, quasi-static loading, consisting of two phases (LP1 and LP2), was adopted. In the first loading phase (LP1), the design live load of 5 kPa was applied by evenly placing 100 steel blocks, each weighing on average 122.4 kg, on top of the ¡°non-damaged¡± slab specimen. The same UDL as the prototype structure was adopted as using a surface load scale factor of unity allows the stress level to be the same in both the prototype structure and the scaled test specimen. At the beginning of LP1, the temporary support was removed and the slab was connected to a 250 kN MOOG servo-controlled hydraulic actuator situated above the interior column. The actuator was held in its initial position to simulate an ¡°intact¡± specimen and represent the service load situation.

In LP2, the interior slab-column connection was displaced downward to simulate the column loss to a large deformation (about 500 mm) using the hydraulic actuator. For S-1, the test was performed in displacement control at an initial stroke rate of 1 mm/min and regularly paused to monitor concrete cracks and damages. At the interior column displacement of 97 mm, where a clear concrete crack pattern was identified, the loading rate was increased to 3 mm/min. When punching shear failure occurred at the interior slab-column connection, the loading rate was further increased to 5 mm/min. In S-2 test, the initial loading rate was set to 3 mm/min and increased to 10 mm/min at the punching shear failure and beyond.

Experimental Measurements

The applied concentrated force was measured through the load cell (Part 4 in Fig. 5 ) mounted on the hydraulic actuator. The structural behaviour of the slab was monitored through a set of 20 linear variable displacement transducers (LVDT), 44 and 15 uniaxial strain gauges glued to the steel reinforcement (3 mm gauge length) and concrete (90 mm gauge length), respectively, and 8 custom-built column load cells. Due to the anticipated symmetrical condition of the tests, concrete and reinforcement strain gauges were mainly glued on one quarter of the specimen (i.e. one bay). In this paper, only selected displacement and strain readings are reported and discussed, including two LVDTs positioned at the edges of the slab middle strip to measure its horizontal displacements and additional four evenly positioned under the slab between the interior column and one edge column to monitor the vertical deformation of the slab. The positions of the selected LVDTs and steel reinforcement strain gauges are shown in Fig. 3 and those of the concrete strain gauges in Fig. 6 . The custom-built column load cells were bolted to the strong floor under each column (Part 8 in Fig. 5 ) and more details are given in the APPENDIX .

Fig. 6 Concrete strain gauge positions

Note: CT = concrete top strain gauges; CB = concrete bottom strain gauges

RESULTS AND DISCUSSION

Material Testing

Material testing was performed on concrete cylinders and steel reinforcement samples. Concrete cylinders were cured at the same ambient condition as the slab and tested following the recommendations of the Australian Standard (AS1012 2014) within one day of the slab test. The mean compressive cylinder strength fcm were found to be 29.5 MPa from five samples for S-1 and 28.3 MPa from three samples for S-2. As for the reinforcing bars, the mean yield strength (proof strength at 0.2% plastic extension) of 564 MPa and ultimate strength of 786 MPa were obtained from steel tensile tests performed on three samples. Moreover, the measured yield strain 𝜀y was 3200 me (at 0.2% plastic extension) and the fracture elongation ratio was found to exceed 14.9% (AS1391 2007) .

Overall Structural Response

The two tested specimens exhibited a similar overall structural behaviour, and for clarity, critical observations obtained from S-1 are summarised in details hereafter, and only noticeable differences between the two specimens are discussed.

LP1

At the beginning of LP1, after removing the temporary interior column, a tensile force of 8.8 kN due to the self-weight of the specimen was instantly transferred to the actuator. At the end of LP1 when all steel blocks were placed on the slab, the summation of the vertical reaction forces measured through the eight column load cells and the actuator load cell was found to be within 3.3% of the total applied force of 120.1 kN. Detailed measurements for each column and the actuator load cell are summarised in Table 2 . Note that the upward reactions (i.e., columns in compression) are regarded as positive. Considering both S-1 and S-2, the averaged reaction forces in the edge, corner and interior columns as well as the corresponding percentages to the total applied load are also presented to demonstrate the UDL distribution pattern.

Table 2. Column reaction forces at the end of LP1


Edge

Corner

Interior


Specimen

C2

C4

C5

C7

C1

C3

C6

C8

Actuatora

Total

S-1 (kN)

16.3

14.8

17.7

18.8

9.8

8.4

9.4

8.9

16.9

121.0

S-2 (kN)

17.0

16.3

17.6

18.1

8.8

9.5

9.0

9.4

18.2

123.9

Average (kN)

17.1

9.2

17.6

122.8

Percentage per column (%)

13.9

7.5

14.4


Note: a initial tensile force of 8.8 kN is not included.

LP2

LP2 was executed immediately after LP1. The actuator had an initial tensile force of 25.7 kN (i.e., 8.8 kN+16.9 kN for S-1). The relationship between the vertically applied force and the displacement at the interior column stub (displacement reading from LVDT V1 and referred to as ¡° DV1¡± thereafter) is plotted as a solid line for S-1 and a dash line for S-2 in Fig. 7 . Note that the unloading components due to the test being paused for concrete crack monitoring, are not shown in this figure. The crack patterns at the top and bottom of the slab at the end of the test are shown in Fig. 8 .

At a DV1 of 2.2 mm, the tensile force in the actuator was released, representing the complete loss of the interior column. No visible structural damage was observed, suggesting that the tested flat plate substructure could withstand the quasi-static removal of an interior column under the design service load. Thereafter, a downward force was imposed to the interior top column stub.

In reference to Fig. 7 , the slab underwent distinguished structural stages detailed below:

1.      Linear stage: up to a DV1 of 6.8 mm, the overall behaviour was linear and the initial stiffness (IS) was as high as 12.9 kN/mm. The first set of cracks (FC) on the top surface of the slab, originating from the four edge column stubs and extended parallel to the slab edges, was observed to further develop towards the end of this stage. Concurrently, the first set of cracks at the bottom surface started to radiate from the corners of the interior column stub towards the four corner columns. Cracks at DV1 = 6.8 mm are marked by 1 in Fig. 8 .

2.      Damage and failure stage: following the development of the first sets of cracks, the stiffness was dropped to 1.0 kN/mm suggesting the beginning of the plastic stage. In this stage, three sub-phases were distinguished by the load resisting mechanisms: flexure action, tensile membrane action, and a combination of one-way catenary and dowel actions.

2.1 Flexure action: At the onset of the plastic stage, the bottom cracks developed more rapidly than the top ones. At DV1 = 12.2 mm (marked by ¡° 2 ¡± in Fig. 8 ), more diagonal bottom cracks started to form near the interior column stub and extended towards the corner columns. On the contrary, less amount of top cracks were newly formed and only to about 500 mm in length, as shown in Fig. 8 (a). At DV1 = 18.1 mm (marked by ¡° 3 ¡± in Fig. 8 ), circumferential top cracks were noticed at the inner sides of both edge and corner column stubs to ultimately form a top circumferential crack ring. At DV1 = 30.2 mm (marked by ¡° 4 ¡± in Fig. 8 ), the bottom slab surface displayed several hairline cracks spreading from the major diagonal cracks to the slab edges and some bottom cracks near the interior column stub opening up to 2 mm in width. At DV1= 54.2 mm (marked by ¡° 5 ¡± in Fig. 8 ), merging of numerous cracks became obvious in form of a top circumferential crack ring and a bottom diagonal crack band. With further loading, the crack patterns emerged more clearly with denser cracks. When the load was increased to 92.2 kN, corresponding to DV1 = 127.7 mm, the specimen exhibited a global yielding mode upon which the overall stiffness in Fig. 7 was further dropped to 0.2 kN/mm. Plastic hinges formed along the top crack ring and the bottom diagonal cracks. At this stage, the flexural action was still dominant with in-plane forces being developed in the slab. Moreover, punching like cracks were found on the bottom surface surrounding the interior column stub. The load subsequently increased until DV1 of 233.7 mm, at which secondary punching shear failure (Park and Gamble 2000; Qian and Li 2015) occurred at the interior slab-column connection reaching the ultimate flexural capacity (UFC) of 105.6 kN. Due to punching shear failure, the applied load suddenly dropped to 87.9 kN. A relatively high displacement ductility factor f, defined as the ratio of DV1, Ultimate and DV1, global yielding, i.e., 233.7 mm/127.7 mm=1.83, was found for S-1. This was likely attributed to the slab being lightly reinforced, and having a large span-to-thickness ratio and moderately weak lateral restraints.

2.2 Tensile Membrane Action: After punching shear failure occurred the load was mainly resisted by the 3D tensile membrane action and the loading curve follows an ascending trend with a stiffness of 0.2 kN/mm. A severely damaged circular zone (confined by the red circle in Fig. 8 (a) & (c)) subsequently formed in the centre of the slab in response to the increasing concentrated load. This was evidenced by wide spread concrete crushing and spalling within this circular zone which were initiated at the slab and interior slab-column joint interface. With this part of concrete being gradually withdrawn from load carrying, the applied load was then resisted primarily by the steel net in this region. The end cogs of 50 mm long made for the top reinforcing bars (see Fig. 3 (a)) were considered to have provided sufficient anchorage to facilitate the presence of the steel net , although the cogs were not required according to Australian Standard (AS3600 2009) . In addition to the aforementioned localised tensile membrane action within the damaged circular zone, the slab region beyond was subject to a conventional tensile membrane action mainly contributed by the bottom reinforcing bars.

2.3 One-way Catenary and Dowel Actions: At DV1 = 333.9 mm and the corresponding post ultimate capacity (PUC) of 109.9 kN, the top reinforcing bars and one of the two integrity bars underwent localised bending in the vicinity of the interior column. At the stage, the applied load dropped again and was partially resisted by the other integrity bar in tension resulting in it being teared out of the concrete, thereby exhibiting a one-way catenary. Moreover, dowel actions of the locally bended reinforcing bars also contributed to the load resistance. The UFC and PUC capacities were of the same order of magnitude indicating that the preceding tensile membrane action enabled the steel net to bridge over the missing column and in turn assisted in proving an alternate load path. Ultimately, damage of the circular zone was extended to a maximum diameter of 1,500 mm, enclosing the top reinforcement within the column strip (see Fig. 3 (a)).

Note that, in the flexure action stage (2.1), the slab behaviour was ductile and the slab underwent large deformations. Flexural cracks, including the circumferential crack ring on the slab top surface and numerous diagonal cracks towards the four corner columns, were mainly developed during this stage. Moreover, punching like cracks on the slab bottom surface formed around the interior slab-column connection due to the excessive concentrated load. Following the brittle occurrence of the punching shear, for which the slab entered the tensile membrane stage (2.2), concrete crushing occurred at the interior slab-column connection interface. The rebar bending terminated the tensile membrane action stage and initiated the last catenary and dowel actions stage (2.3). The failure modes of the interior slab-column connection observed in the abovementioned three sub-phases of the plastic stage are shown in Fig. 9 .

Fig. 7 Load-displacement response of specimens S-1 and S-2

(a)

(b)

(c)

(d)

Fig. 8 Crack patterns: (a) slab top view; (b) slab bottom view; (c) circular damaged zone and (d) punching like cracks

(a)

(b)

(c)

Fig. 9 Failure modes of the interior slab-column connection in: (a) flexure action; (b) tensile membrane action; and (c) one-way catenary and dowel actions phases

In addition to the detailed descriptions of the failure behaviour of the interior slab-column connection, no obvious punching shear failure was observed around the four edge slab-column connections during the test, except that some asymmetric punching like cracks were noticed on their inner sides (Fig. 8 (d)).

With respect to S-2, a similar structural behaviour was observed as S-1, but this specimen was found to be weaker and more ductile. It is noteworthy that one integrity bar fractured at DV1 = 326.5 mm (¡° A ¡± in Fig. 7 ) which led to a relatively large rotation of the interior slab-column joint. At DV1 = 428.5 mm (¡° B ¡± in Fig. 7 ), the second integrity rebar fractured and the applied load was entirely taken by the dowel action of the top reinforcement. This likely explained the lower residual strength of S-2 at the end of the test when compared to S-1. Key force and displacement readings at the critical stages from the two specimens are summarised in Table 3 for comparison.

Table 3. Key force and displacement readings for S-1 and S-2


FC

IS(kN/mm)

UFC

fa

PUC (kN)

F(kN)

DV1 (mm)

F(kN)

DV1 (mm)

F(kN)

DV1 (mm)

S-1

20.9

6.8

12.9

105.6

233.7

1.8

109.9

333.9

S-2

10.8

5.9

11.1

94.8

277.5

2.4

96.5

411.5

Note: a displacement ductility factor: Dultimate/Dyielding.

Load Transfer Mechanisms

The column reaction forces measured in LP2 versus the interior column displacement are shown in Fig. 10 for S-1, with all column reaction forces taken as null at the beginning of LP2. Fig. 10 indicates that the concentrated force applied at the interior column is largely transferred to the four edge columns. The variations between the four edge column reactions are likely attributed to the inevitable slab asymmetry. For the four corner columns (C1, C3, C6, C8), they were found to have a compressive reaction force relief after the LP1 between DV1 = 0 to 40 mm. This is represented by the negative reactions in these columns (i.e., downward reactions). More specifically, as the displacement DV1 = 10 to 40 mm, a small amount of the applied force was transferred to these corner columns as the load paths from the interior to the edge columns were weakened by increased amount of cracks. However, this load transfer became insignificant afterwards as a result of cracks spreading to the corner portions of the slab and after DV1 = 100 mm the axial forces in the corner columns remained almost constant. The average reaction forces in each edge and corner column and their respective total percentages to the applied concentrated force at the two critical UFC and PUC points (see Fig. 7 ), are summarised in Table 4 . This table indicates that between 90% (S-2) to 98% (S-1) of the applied force was transferred to the edge columns. This in turn increases the risk of subsequent punching shear failure at these locations.

Fig. 10 Column reaction forces with column numbers given in Fig. 3

Specimen

Column Position

UFC

PUC

Average per column (kN)

Percentage (%)

Average per column (kN)

Percentage (%)

S-1

Edge

31.4

98.1

31.3

97.8

Corner

0.6

1.9

0.7

2.2

S-2

Edge

27.7

93.6

24.8

90.2

Corner

1.9

6.4

2.7

9.8

Slab Overall Deflection

The slab deformation profiles recorded by the vertical LVDTs at three key stages (FC, UFC and PUC) for S-1 are depicted in Fig. 11 . Due to the significantly small slab deformation at the FC stage, an exaggerated display with a scaling factor of 10 is presented in Fig. 11 for clarity. The figure also reveals that from FC to UFC, the slab deformed as a whole when the applied load is principally resisted through the flexural mechanism. After punching shear failure, i.e., from UFC to PUC, the further deformation of the slab was centred within the severely damaged circular zone surrounding the interior column whereas other regions beyond almost remained stationary.

Fig. 11 Slab deformation profiles, in reference to Fig. 7

In reference to Fig. 3 (a), the development of the horizontal deformation of the slab middle strip in S-1, obtained as the sum of H1 and H2 readings excluding the rigid body movement, is shown in Fig. 12 . The applied force is also plotted for reference on the right ordinate axis in Fig. 12 . With increased vertical downward displacement at the interior column location, the slab expanded horizontally until DV1 = 130 mm, reflected by a positive increment in the sum of H1 and H2. This expansion was due to the development and widening of the concrete cracks on the tensile surface of the slab. Considering the symmetric test conditions, the maximum horizontal displacement on each side of the slab reached about 2 mm at this stage. Thereafter, corresponding to the commencement of the global yielding mechanism (see Fig. 7 ), the slab expansion essentially stopped due to the initially developed tensile membrane forces and the subsequent overall deformation of the slab being concentrated around the interior column region.

Due to their very nature, isolated RC flat plates typically do not have enough lateral restraint to prevent the expansion of the slab and allow the compressive membrane action to develop (Mitchell and Cook 1984) . Yet, contrary to this study, a transition from compressive to tensile membrane action was observed in Qian and Li (2015); Yi et al. (2014) , and their measured horizontal slab expansions were less than 1.2 mm and 0.5 mm, respectively. Whereas the horizontal expansion of 2 mm for S-1 was much greater. This difference is likely attributed to the less lateral restraint provided by the columns with lower bending stiffness in this study than those in Qian and Li (2015); Yi et al. (2014) where either steel or enlarged concrete columns were adopted.

Additionally, Keyvani et al. (2014) and Park and Gamble (2000) have demonstrated that the compressive membrane action can enhance not only the flexural but also the punching shear capacity. As in-plane tensile forces (discussed later in the ¡°Development of Strains¡± section) were observed well before the UFC, it is believed that the flexural and punching shear capacities of the specimens were not enhanced by any compressive action.

Fig. 12 Development of horizontal displacement

Development of Strains

Strain results obtained from S-1 are presented and discussed in this section. The development of the top reinforcement strain adjacent to the interior column and columns C6 (corner) and C7 (edge) versus DV1 are depicted in Fig. 13 . The top steel bars surrounding C6 (gauges ST1 and ST2) did not yield during the entire loading process due to only 2% of the applied load being transferred to the corner columns. The strain from gauge ST3 shows that the bar aligned perpendicular to the load path at the edge column C7 was also not actively involved in the load carrying mechanism, with a maximum strain value of 1,448 me, 55% below the yield strain ¦Åy of 3,200 me. The slight drop in the strain value of gauge ST3 after DV1 = 150 mm is likely attributed to the initiation of the peripheral compressive ring at the same location to restrain the central tensile membrane action (Bailey 2001; Foster et al. 2004) . In comparison, the strain (gauge ST4) in the nearby bars, but orientated parallel to the load paths, linearly increases to a strain value of 6,940 me at a displacement DV1 = 114.8 mm (i.e. up to a value 2.2 times the yield strain ¦Åy) and subsequently remains unchanged due to relatively constant load being transferred to the edge column (Fig. 10 ). The strains in the top reinforcement close to the interior slab-column connection (gauges ST5 and ST6) are counter-intuitively always positive (i.e. in tension) implying that the compressive stress due to bending at this location may have been rapidly compensated by the slab tensile in-plane stress. At DV1 = 125 mm, the ST5 and ST6 strains rapidly increased due to the development of the plastic hinges.

Fig. 13 Development of the strain in the top reinforcement (shown for S-1)

The strains measured along one of the integrity bars going through the interior column are shown in Fig. 14 . The diffusion of the load through the slab can be seen in Fig. 14 , with the strain in the bar increasing more rapidly at the gauge located closer to the interior column. Specially, gauge SB5 in the vicinity of the removed column yields when the displacement is as low as DV1 = 18.1 mm, whereas gauge SB1 located near the edge column shows that the same bar underwent little to no deformation.

Fig. 14 Strains measured along the integrity bar (shown for S-1)

The strain readings of gauges SB6 to SB11 are plotted together and compared in Fig. 15 to investigate the propagation of the major concrete damages in the vicinity of the interior column. The values of the strain gauges located within the damaged circular zone (see Fig. 8 ), i.e. gauges SB7 to SB9, show that the reinforcing bars significantly elongated in this zone. On the other hand, gauges SB10 and SB11 located near the edge of the damaged zone indicate a smaller amount of elongation. Reading from gauge SB6 further away from this zone suggests that the reinforcing bar did not yield at this location. Therefore, strain results of gauges SB6 to SB11 confirm that the major deformation of the slab was located near the removed column.

Fig. 15 Strain comparison to examine the concrete damage propagation (shown for S-1)

Fig. 16 presents the bottom reinforcement strain development at the centre of a quarter of the specimen and corner column areas (gauges SB12 to SB15). Limited applied force was redistributed along the diagonal path passing through these gauges and no yielding was detected in the monitored reinforcing bars with the maximum strain not exceeding 3,200 me.

Fig. 16 Bottom reinforcement strain developments at panel centre and corner column areas (shown for S-1)

The development of concrete strains at the key locations on the slab top (CT) and bottom (CB) surfaces is shown in Fig. 17 and Fig. 18 , respectively. Due to the slab bending, its top surface surrounding the interior top column stub (gauges CT1 and CT3) initially show compression until tension ultimately developed at DV1 = 95.0 mm. The strain reading of gauge CT2, near the edge column C4, initially shows tension and subsequently decreases to compression at DV1 = 76.0 mm.

Strain readings at the slab bottom surface (gauges CB1, CB2 and CB4) rapidly reach the concrete tensile cracking strain of about 100 to 150 me for DV1 < 30 mm as the gauges are located on the crack propagation path observed in Fig. 8 (b). In contrast, the strains of gauges CB3 and CB5 are initially in compression and increase slowly to reach a strain of 170 me at DV1 = 77.5 mm and 186.5 mm, respectively. Gauge CB3 located on the crack propagation path ultimately record a tensile strain at DV1 = 245.0 mm.

Fig. 17 Development of top concrete strains (shown for S-1)

Fig. 18 Development of bottom concrete strains (shown for S-1)

YIELD LINE AND PUNCHING SHEAR ANALYSES

Application of Yield Line Theory

Johansen¡¯s yield line theory, which does not consider membrane actions, usually provides accurate predictions of the ultimate load capacity of slabs with no column removal (Park and Gamble 2000) . This theory (Park and Gamble 2000) is used in this study to estimate the ultimate load carrying capacity of the tested flat plates primarily failing in bending. The collapse mechanism used is based on the observed crack patterns near the UFC stage and shown in Fig. 19 . In this figure, the dash lines indicate the negative yield lines, representing the major cracks on the slab top surface (circumferential crack ring), and the wavy lines indicate four circular fan shape positive yield line areas, representing observed dense cracks (Fig. 8 (b)). The plastic moment mu per unit length is calculated as (Park and Gamble 2000) :

where As is the cross-sectional area per unit length of the reinforcement in tension (calculated from Table 1 ), fy is the measured steel yield stress, d is the effective depth of the slab, and  is the measured concrete compressive strength.

For the negative yield lines on the slab top surface, Eq. gives munc = 13.51 kNm/m for the isotropically reinforced areas around the columns (see Fig. 3 (a)) and munm = 7.9 kNm/m when bending is perpendicular to the reinforcement in the unidirectional reinforced middle strips (see Fig. 3 (a)). For the isotropically reinforced positive yield line on the bottom surface, Eq. gives mup = 6.74 kNm/m.

The internal work Wi done by the plastic moments at the yield lines for a virtual displacement d at the removed column is given as from the methodology in (Park and Gamble 2000) :

where the measured angles a = 37º, b = 53º, a1 = 15º and b1 = 24º are given in Fig. 19 . The external work We done by the applied concentrated load and UDL is:

Where Pu is the ultimate concentrated load at the removed column, q = 6.94 kPa is the constant UDL (including self-weight) acting on the slab and R = 1.925 m is the measured radius of the circumferential crack ring. Equalising the internal work to the external work for S-1, Pu is found to be equal to 65.1 kN. This value is 38% smaller than the observed UFC load. Using the ultimate strength fu of the high strength steel, instead of the yield stress fy, in Eq. , Eqs. and provide an ultimate force Pu = 99.4 kN. This value is closer to the observed UFC load but still 6% smaller. As for S-2, Pu is 32% smaller but 4% larger than the UFC load when using fy and fu, respectively. Using the yield line theory, the result of underestimated ultimate load carrying capacity of the slab under a column removal scenario is similar to findings obtained by Xiao et al. (2015) and Yi et al. (2014) . In (Xiao et al. 2015) , use of the yield line theory resulted in the slab capacity being underestimated by 26% and by 42% in (Yi et al. 2014) . These results indicate that under a column removal scenario, the yield line theory may not be appropriate to estimate the slab capacity.

Fig. 19 Yield line pattern

Punching Shear Capacity

The punching shear capacity of the interior column connection for each specimen can be determined by summing the forces at the ultimate flexural capacity (UFC in Table 3 ) and the axial forces induced by UDL (actuator reading in Table 2 ). This amounts to 122.5 kN and 113 kN for S-1 and S-2, respectively. As punching shear triggered the first failure (UFC) mode, the predicted punching capacities from Clause 9.2 of the Australian (AS3600 2009) , Clause 22.6 of the American (ACI318 2014) , Clause 6.5 of the Chinese (GB50010 2010) and Clause 6.4 of the European (BS EN 1992-1-1 2004) concrete standards are calculated to compare to the experimental UFC load. The measured concrete strength  and steel yield stress fy are used in the standards¡¯ equations. The results are shown in Table 5 for S-1 and S-2. All standards, at the exception of the European standard, give comparable results to the test results with a maximum error of 6.4% for S-1 and 10.4% for S-2. The European standard is conservative and underestimates the punching capacity by 46% for S-1 and 42% for S-2.

Additionally, for the four edge columns in S-1 (C2, C4, C5, C7), their reaction forces at LP2 were found to fall within the range of approximately 25-43 kN (discussed in Section ¡°Load Transfer Mechanisms ¡± and Fig. 10 ). This range, together with the additional reaction forces due to UDL (Table 2 ), results in a 49-64% less of the Australian code predicted punching shear capacity of 118.1 kN. Note that the theoretical punching shear capacity remains the same for the interior and edge columns, owing to the same design details for these columns. The reduction in punching capacities could be confirmed by the observation of punching like cracks on the inner sides of the four edge column connections. This reduction was also attributed to the decreased slab effective depth and punching failure surface area, as a result of flexural cracks induced by the unbalanced bending and torsional moments at these connections. Note also that quantitative evaluation of the punching shear capacity of slab-column connections under coupled bending and shear actions would merit further investigation.


AS 3600-2009

ACI 318 - 2014

GB50010-2010

BS EN 1992-1-1

UFC

S-1

118.1

114.6

128.2

66.5

122.5

S-2

115.6

112.2

124.7

65.6

113.0

CONCLUSION                 

To investigate the structural behaviour of RC flat plate structures under an interior column loss scenario taking into account the actual live load cases, two 1/3 scaled 2´2-bay RC flat plate specimens were quasi-statically tested under large deformation. The slab was first loaded with an UDL of 5 kPa and a concentrated force was then applied at the removed interior column. The load distribution pattern of the applied concentrated load was quantified through eight load cells positioned under each column. The development of the overall slab displacements and strains were measured at key locations. The main findings are summarised below:

1.      Three distinct mechanisms to resist the applied load, namely flexure action, tensile membrane action and one-way catenary and dowel actions, were observed.

2.      Flexural behaviour of the slab was dominant, with no contribution of compressive membrane action, the ultimate flexural capacity was reached by a secondary punching shear failure in the slab at the interior slab-column connection.

3.      After punching shear failure, the resistance increased further due to the 3D tensile membrane action developed in steel reinforcement, until localised bending of the steel bars passing through the interior column. This post-failure capacity was of the same order of magnitude as the secondary punching shear failure capacity.

4.      Up to 98% of the applied concentrated load was found to be transferred to the edge columns, thereby increasing their risk of subsequent punching shear failure, as manifested by the punching like cracks due to excessive load transfer and unbalanced moments.

5.      The current standards, except the European one which provided conservative results, were able to adequately predict, within 10.4%, the measured punching shear capacities of the slab-column connections. The force redistribution after punching of the removed column and the unbalanced moments led to further punching like cracks around the adjacent edge columns. This highlights the potential risk of progressive collapse due to loss of an interior column.

APPENDIX

The custom-built column load cells were bolted to the strong floor under each column (Part 8 in Fig. 5 ) and manufactured with four strain gauged circular hollow sections (CHS), as shown in Fig. 20 . The strain gauges allow the measurement of the axial force in each CHS and therefore the axial force F in the column is,

where Fi is the axial force in the ith CHS member. The moment Mx and My at the base of the columns can also be potentially recorded as,

where d is the centre-to-centre distance between the two CHS members. Before installation, each strain gauged CHS was calibrated in compression using a 500 kN uniaxial MTS testing machine. The accuracy of the complete load cells was further verified in the same machine by applying a combined bending moment and axial load. An overall load cell accuracy of 1% to 3% was achieved.

Fig. 20 Column load cell

ACKNOWLEDGEMENT

The authors are grateful for the financial support received from the Australian Research Council through the ARC Discovery Project DP150100606. The essential work performed by Mr. Tcheyne Gerard, Mr. James Webster, Mr. Chunhao Lyu and Mr. Shaoqi Li in preparing the experimental tests is acknowledged and valuable suggestions from Professors Yew-Chaye Loo and Brain Uy are greatly appreciated.

REFERENCES

Alogla, K., Nelson, L. A., and Weekes, L. (2017). "Theoretical Assessment of Progressive Collapse Capacity of Reinforced Concrete Structures." Magazine of Concrete Research, 69(3), 145-162.

ACI (American Concrete Institute). (2014). "Building Code Requirements for Structural Concrete and Commentary." ACI 318M-14, Farminton Hills, MI.

ASCE/SEI (American Society of Civil Engineers/Structural Engineering Institute). (2010). "Minimum Design Loads for Buildings and Other Structures." ASCE/SEI 7-10, Reston, VA, USA.

AS (Australian Standard). (2007). "Metallic Materials - Tensile Testing at Ambient Temperature." AS 1391-2007, Sydney, Australia.

AS (Australian Standard). (2007). "Specification and Supply of Concrete." AS 1379-2007, Sydney, Australia.

AS (Australian Standard). (2009). "Concrete Structures." AS 3600-2009, Sydney, Australia.

AS (Australian Standard). (2014). "Methods of Testing Concrete." AS 1012-2014, Sydney, Australia.

AS/NZS (Australian/New Zealand Standard). (2001). "Steel Reinforcing Materials." AS/NZS 4671-2001, Sydney, Australia.

Bailey, C. G. (2001). "Membrane Action of Unrestrained Lightly Reinforced Concrete Slabs at Large Displacements." Engineering Structures, 23(5), 470-483.

BS (British Standards). (2004). "Eurocode 2: Design of Concrete Structures." BS EN 1992-1-1:2004, Brussels.

Corotis, R., and Sentler, L. (1989). "Actions on Structures - Live Loads in Buildings." CIB, CIB.

DoD (Department of Defense). (2009). "Design of Buildings to Resist Progressive Collapse." UFC 4-023-03, Washington, D.C., USA.

Ellingwood, B., and Rosowsky, D. (1991). "Duration of Load Effects in LRFD for Wood Construction." Journal of Structural Engineering, 117(2), 584-599.

Foster, S. J., Bailey, C. G., Burgess, I. W., and Plank, R. J. (2004). "Experimental Behaviour of Concrete Floor Slabs at Large Displacements." Engineering Structures, 26(2004), 1231-1247.

GSA (General Services Administration). (2013). "Alternate Path Analysis & Design Guidelines for Progressive Collapse Resistance." Washington, D.C., USA.

Hawkins, N. M., and Mitchell, D. (1979). "Progressive Collapse of Flat Plate Structures." ACI Journal.

Hendrickson, E. M., Ellingwood, B., and Murphy, J. (1987). "Limit State Probabilities for Wood Structural Members." Journal of Structural Engineering, 113(1), 88-106.

Keyvani, L., Sasani, M., and Mirzaei, Y. (2014). "Compressive Membrane Action in Progressive Collapse Resistance of RC Flat Plates." Engineering Structures, 59(2014), 554-564.

Kim, T., Kim, J., and Park, J. (2009). "Investigation of Progressive Collapse-Resisting Capability of Steel Moment Frames Using Push-Down Analysis." Journal of Performance of Constructed Facilities, 23(5), 327-335.

Li, Y., Lu, X., Guan, H., and Ye, L. (2011). "An Improved Tie Force Method for Progressive Collapse Resistance Design of Reinforced Concrete Frame Structures." Engineering Structures, 33(2011), 2931-2942.

Li, Y., Lu, X., Guan, H., and Ye, L. (2014). "An Energy-Based Assessment on Dynamic Amplification Factor for Linear Static Analysis in Progressive Collapse Design of Ductile RC Frame Structures." Advances in Structural Engineering, 17(8), 1217-1226.

Liu, J., Tian, Y., Orton, S. L., and Said, A. M. (2015). "Resistance of Flat-Plate Buildings against Progressive Collapse. I: Modeling of Slab-Column Connections." Journal of Structural Engineering, 141(12).

Loo, Y. C., and Guan, H. (1997). "Cracking and Punching Shear Failure Analysis of RC Flat Plates." Journal of Structural Engineering, 123(10), 1321-1330.

Lu, X., Lin, K., Li, Y., Guan, H., Ren, P., and Zhou, Y. (2017). "Experimental Investigation of RC Beam-slab Substructures against Progressive Collapse subject to an Edge-column-removal Scenario." Engineering Structures, 149: 91-103.

Melo, G. S. S. A., and Regan, P. E. (1998). "Post-punching Resistance of Connections Between Flat Slabs and Interior Columns." Magazine of Concrete Research, 50(4), 319-327.

MOHURD (Ministry of Housing and Urban-Rural Development of the People's Republic of China). (2010). "Code for Design of Concrete Structures." GB50010-2010, Beijing.

Mitchell, D., and Cook, W. D. (1984). "Preventing Progressive Collapse of Slab Structures." Journal of Structural Engineering, 110(7), 1513-1532.

Park, R., and Gamble, W. L. (2000). Reinforced Concrete Slabs, John Wiley & Sons, Inc., NY, USA.

Park, T. W. (2012). "Inspection of Collapse Cause of Sampoong Department Store." Forensic Science International, 217(2012), 119-126.

Pham, A. T., Lim, N. S., and Tan, K. H. (2017). "Investigations Of Tensile Membrane Action In Beam-Slab Systems Under Progressive Collapse subject to Different Loading Configurations and Boundary Conditions." Engineering Structures, 150(2017), 520-536.

Pham, A. T., Tan, K. H., and Yu, J. (2016). "Numerical Investigations on Static and Dynamic Responses of Reinforced Concrete Sub-Assemblages under Progressive Collapse." Engineering Structures.

Pham, X. D., and Tan, K. H. (2013). "Membrane Actions of RC Slabs in Mitigating Progressive Collapse of Building Structures." Engineering Structures, 55(2013), 107-115.

Qian, K., and Li, B. (2012). "Experimental and Analytical Assessment on RC Interior Beam-Column Subassemblages for Progressive Collapse." Journal of Performance of Constructed Facilities, 26(5), 576-589.

Qian, K., and Li, B. (2012). "Slab Effects on Response of Reinforced Concrete Substructures after Loss of Corner Column." ACI Structural Journal, 109(6), 845-855.

Qian, K., and Li, B. (2013). "Analytical Evaluation of the Vulnerability of RC Frames for Progressive Collapse Caused by the Loss of a Corner Column." Journal of Performance of Constructed Facilities, 29(1).

Qian, K., and Li, B. (2015). "Load-Resisting Mechanism to Mitigate Progressive Collapse of Flat Slab Structures." Magazine of Concrete Research, 67(7), 349-363.

Qian, K., Li, B., and Ma, J. (2015). "Load-Carrying Mechanism to Resist Progressive Collapse of RC Buildings." Journal of Structural Engineering, 141(2).

Ren, P., Li, Y., Lu, X., Guan, H., and Zhou, Y. (2016). "Experimental Investigation of Progressive Collapse Resistance of One-way Reinforced Concrete Beam¨Cslab Substructures under a Middle-column-removal Scenario." Engineering Structures, 118(2016), 28-40.

Rosowsky, D., and Ellingwood, B. (1992). "Reliability of Wood Systems Subjected to Stochastic Live Loads." Wood and Fiber Science, 24(1), 47-59.

Ruiz, M. F., Mirzaei, Y., and Muttoni, A. (2013). "Post-Punching Behavior of Flat Slabs." ACI Structural Journal, 110(5), 801-811.

Russell, J. M., Owen, J. S., and Hajirasouliha, I. (2015). "Experimental Investigation on the Dynamic Response of RC Flat Slabs after a Sudden Column Loss." Engineering Structures, 99(2015), 28-41.

Wood, J. G. M. (2003). "Pipers Row Car Park Collapse: Identifying Risk." Concrete, 37(9), 29-31.

Xiao, Y., Kunnath, S., Li, F. W., Zhao, Y. B., Lew, H. S., and Bao, Y. (2015). "Collapse Test of Three-Story Half-Scale Reinforced Concrete Frame Building." ACI Structural Journal, 112(4), 429-438.

Yi, W., He, Q., Xiao, Y., and Kunnath, S. K. (2008). "Experimental Study on Progressive Collapse-Resistant Behavior of Reinforced Concrete Frame Structures." ACI Structural Journal, 105(4), 433-439.

Yi, W., Zhang, F., and Kunnath, S. K. (2014). "Progressive Collapse Performance of RC Flat Plate Frame Structures." Journal of Structural Engineering, 140(9).

Introduction
Research
Application
Teaching
Publications
Download
Issues
Others


Our Lab

Collapse Prevention Committee