|
4 Analytical model for steel angle
In the MHRPC frame, the steel angle connections
aid in: (1) providing flexural strength and dissipating seismic energy in
the seismic cyclic tests; and (2) providing a catenary force during the catenary
mechanism stage of the progressive collapse tests. It should be noted that,
in the catenary stage, the steel angles will experience large deformations.
Hence, the analytical model of the steel angle should be able to calculate
the load-carrying capacity in both the small and large deformation stages.
The connection between the steel angles and
prefabricated components is identical to the widely used semi-rigid connection
with top and seat angles. The steel angles are arranged around the beam-column
joint region, and connected to the prefabricated beams and columns by means
of high-strength bolts. As semi-rigid connections with top and seat angles
are used extensively in steel structures, numerous experimental, numerical
and analytical studies exist (Kishi and Chen, 1990; Garlock et al., 2003;
Mender et al., 1994; Bernuzzi et al., 1996; Calado and Ferreira, 1994; Li,
2007; Komuro et al., 2004; Yuan, 2007; Yang and Jeon, 2009; Ahmed and Hasan,
2015; Kishi et al., 2001; Ahmed et al., 2001; Hasan et al., 2017; Kong and
Kim, 2017). Among these researches, Kishi and Chen (1990) proposed calculation
methods for the initial stiffness and ultimate moment capacity of different
types of semi-rigid connections, including the top and seat angle connection.
Mander et al. (1994) calculated the plastic moment capacity of the connection
by means of virtual work principles. For the initial stiffness, the Kishi
and Chen model (1990) was adopted by Mander et al. (1994) in their research.
Another widely used steel angle connection model was proposed by Garlock et
al. (2003), based on cyclic load tests on different steel angles.
4.1 Key parameters of steel angle connections
When the beam-column joint is subjected to
a rotation of q, the prefabricated beam rotates along point O and the deformation of top and
seat angles are shown in Figure 4A. Under such a load, the top angle is subjected
to a horizontal force V as shown in Figure 4B and the plastic hinges
locate at the column side of the steel angle. Furthermore, the beam side of
the seat angle rotates along the plastic hinge on the steel angle as shown
in Figure 4C.
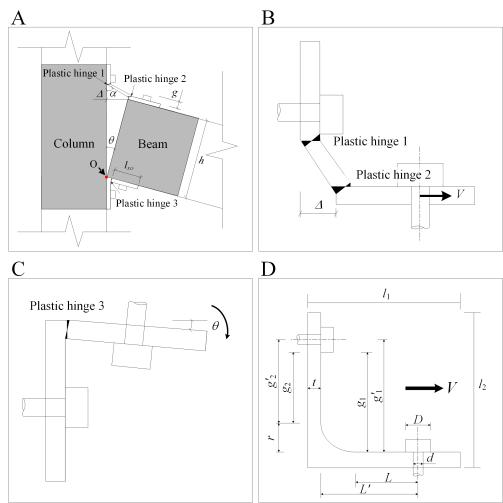
Figure 4. Deformation
of MHRPC joint. (A) Overall
deformation. (B) Top angle. (C) Seat angle. (D) Dimensions
of steel angle
According to Kishi and Chen (1990), Mander
et al. (1994), and Garlock et al. (2003), when the top angle is subjected to a horizontal force V at the
beam side, its strength is affected by the following parameters:
plastic hinge distance g, angle thickness t, and angle width
b, among others. The distance between two plastic hinges is determined
by the bolt size and location and the steel angle fillet length. In order
to provide an improved description of the analytical model for the steel angle,
a series of parameters for calculating the steel angle resistance (g1,
g1', g2, g2',
r, L, t, and L') are defined, as illustrated
in Figure 4D. Moreover, the geometric parameters of a steel angle connection
are defined, including the steel angle leg length (l1
and l2), bolt diameter (d), and bolt head diameter
(D). Based on the deformation mode in Figure 4C, the seat angle strength depends primarily on the flexural resistance at the plastic hinge location.
4.2 Analytical model for steel angles
The analytical model for the steel angle
connections includes calculation methods for the yield moment, initial stiffness,
and post-yield resistance. Hence, the proposed model is introduced in terms
of these three aspects.
4.2.1 Yield moment
(1) The Kishi
and Chen (1990) and Garlock
et al. (2003) method
(namely,
Method
Y1)
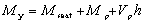
When the beam-column joint reaches the yield
state, according to the moment equilibrium between the external force (My)
and internal force, the yield moment can be expressed as follows (Kishi and
Chen, 1990; Garlock et al., 2003):
|
 ,
,
|
(2)
|
where
Mseat is the flexural strength at plastic hinge 3 (Figure
4C), which can be calculated by Equation 3; Mp is the flexural
strength at plastic hinge 2 (Figure 4B); Vp is the shear
force transferred from the frame beam; and h is the beam height.
Assuming that both angle legs have the same
thickness t, the flexural strength of a steel angle with a width b
and material strength fy can be calculated according
to Equation 3.
|

|
(3)
|
Moreover, the shear force Vp
can be calculated using Equation 4, as suggested by Garlock et al. (2003):
|
 .
.
|
(4)
|
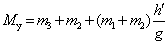
(2) The Mander et al. (1994) method (namely,
Method Y2)
In contrast to Kishi and Chen (1990) and
Garlock et al. (2003), Mander et al. (1994) deduced the expression for the
yield moment by means of the virtual work principle, as indicated in Equation
5:
|
 ,
,
|
(5)
|
where
m1, m2, and m3 are the
flexural strength at plastic hinges 1, 2, and 3, respectively, which can also
be calculated by Equation 3; h' is the distance between plastic hinge
2 and the rotation center O; and g is the distance between plastic
hinges 1 and 2.
4.2.2 Initial stiffness
The initial stiffness of the top and seat
angle connection can be derived by calculating the initial stiffness of the
top and seat angles, respectively. The initial stiffness contribution of the
seat angle can be calculated by Equation 6 (Mander et al., 1994).
|
 ,
,
|
(6)
|
where
E is the elastic modulus of the steel; I is the sectional moment
of inertia; and lso is the distance between plastic hinge
3 and the angle leg tip, as indicated in Figure 4A.
Calculation methods for the initial stiffness
contribution of the top angle include the Kishi and Chen (1990) and the Garlock
et al. (2003) methods.
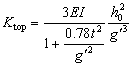
(1) The Kishi and Chen (1990) method (namely,
Method S1)
According to Kishi and Chen (1990), the top
angle acts as a cantilever beam and its initial stiffness contribution can
be derived according to Equation 7:
|
 ,
,
|
(7)
|
where
E is the elastic modulus of the steel; I is the sectional moment
of inertia; t is the angle thickness; g' is the distance from
plastic hinge 1 to the mid-thickness of the angle leg on the beam side; and
h0 is the distance between the mid-thickness of the top
and seat angles on the beam side. When the top and seat angles have the same
thickness, h0 = h+t.
(2) The Garlock
et al. (2003) method (namely, Method S2)
Garlock et al. (2003) assumed that the top
angle is fixed at the bolt positions on both the beam and column sides, as
illustrated in Figure 5. The initial stiffness contribution of the top angle
can be calculated by Equations 8 to 10. The initial stiffness can be expressed
in terms of the bending and shear stiffness (Kbend and Kshear):
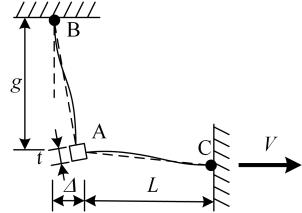
Figure 5. Analytical model for top angle (Garlock et al., 2003)
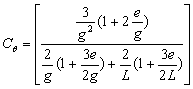
where
Cq is the rotation angle
corresponding to a unit movement of the steel angle heel, which can be derived
by Equation 11; e is the half-length of the square rigid zone, which
is equal to t/2; and g and L are two steel angle connection
parameters, as defined in Figure 5. As suggested by Garlock et al. (2003),
when calculating the initial stiffness contribution of the top angle, g1'
and L' as depicted in Figure 4D are assigned to g and L,
respectively. Taking the beam height into consideration, the flexural stiffness
contribution of the top angle can be determined.
4.2.3 Post-yield resistance
The shear force of the top angle following
yielding can be calculated by Equation (12), according to Garlock et al. (2003):
|
 ,
,
|
(12)
|
where
D is the movement of the top angle heel, as illustrated
in Figure 5; and a
is
the material hardening parameter of the steel. It should be noted that Kishi
and Chen (1990) also proposed a power-law-based model to simulate the post-yield
behavior of the steel angle connection. However, the power index in the Kishi
and Chen method (1990) should be calibrated by means of a series of experimental
data, which is not practical in engineering design; therefore, it is not adopted
in this study.
4.3
Model selection for steel angle
4.3.1 Steel angle database
In order to the compare the accuracies of
the different methods mentioned above, a total of 45 steel angle connection
specimens were collected from the literature (Garlock et al., 2003; Mender
et al., 1994; Bernuzzi et al., 1996; Calado and Ferreira, 1994; Li, 2007;
Komuro et al., 2004; Yuan, 2007; Yang and Jeon, 2009; Ahmed and Hasan, 2015).
Detailed information regarding these specimens can be found in the database
in Appendix Table 1.
Moreover, a benchmark FE model for the steel
angle connection in the experiments of Lin et al. (2018) is constructed using
MSC.Marc. Based on the benchmark model, 24 FE models with various design parameters
(bolt positions, angle thicknesses, and material strengths) are built to establish
the numerical database in Appendix Table 2.
The cyclic tests on steel angles conducted
by Garlock et al. (2003) are used to validate the accuracy and feasibility
of the FE models. Taking specimen L6-516-9 as an example, solid elements are
used to construct the models. The steel angle model is divided into four layers
along the thickness. The material parameters are assigned according to the
tension coupon results provided by Garlock et al. (2003). The simulated cyclic
response of specimen L6-516-9 is compared to the experimental result in Figure
6, which indicate that the above FE model can accurately reproduce the cyclic
behaviors of the steel angle in the tests.
Based on the above experimental and numerical
database, different analytical models for the steel angle connection are compared
and selected. Subsequently, the selected models are used to analyze the experimental
results of the MHRPC specimens.
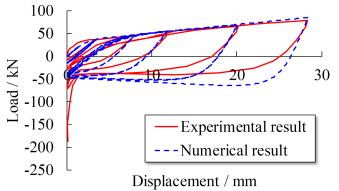
Figure 6. Validation of numerical model (specimen L6-516-9) (Garlock
et al., 2003)
4.3.2 Model selection
(1) Yield
strength
The ratios between the calculated yield strengths
and experimental results for the 45 specimens in the experimental database
are compared in Figure 7A. The blue hollow triangle data points indicate the
results from Method Y1 (Kishi and Chen, 1990; Garlock et al., 2003), while
the red solid diamond data points represent the results from Method Y2 (Mander
et al., 1994). The mean absolute errors (MAEs) of Methods Y1 and Y2 are represented
by the blue and red solid lines, respectively. Note that Method Y2 is only
suitable for beam-column joint specimens with top and seat angle connections,
and the corresponding data points for specimens 1 to 7 (Garlock et al., 2003)
are absent as these tests are cyclic tests of the steel angles.
The results indicate that both methods can
provide an accurate estimation of the yield strength of the steel angle connections.
The MAE of Method Y1 is 16.42% with a standard deviation of 0.163, while the
MAE of Method Y2 is 30.91% with a standard deviation of 0.197. Moreover, additional
data points from Method Y1 are within the range of ˇŔ20%, as illustrated in
Figure 7A.
The calculated yield strengths using Method
Y1 are compared to the numerical database results in Figure 7B. The results
demonstrate that Method Y1, validated by the experimental database, can accurately
calculate the yield strength of the steel angle connection model. The MAE
is 7.44% with a standard deviation of 0.064. Hence, Method Y1 is adopted in
this study to calculate the yield strengths of the steel angle connections.
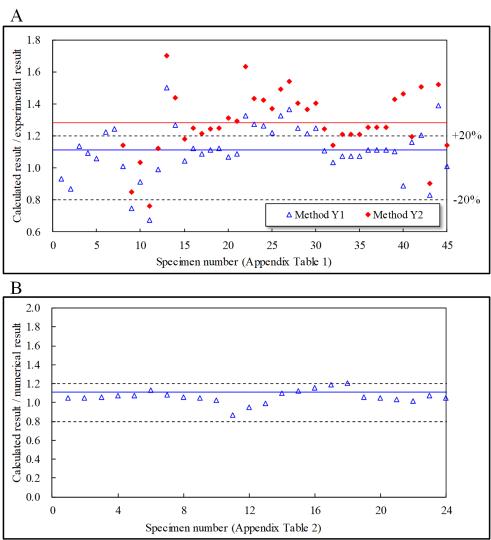
Figure 7. Comparison of different yield strength calculation
methods. (A) Comparison with experimental database. (B) Comparison
with numerical database.
(2) Initial
stiffness
Similarly, the ratios between the calculated
initial stiffness and experimental results for the specimens in the experimental
database are illustrated in Figure 8A. The blue hollow triangle data points
denote the results from Method S1 (Kishi and Chen, 1990), while the red solid
diamond data points represent Method S2 (Garlock et al., 2003). The MAEs of
Methods S1 and S2 are indicated by the blue and red solid lines, respectively.
The MAE of Method S1 is 89.61% with a standard deviation of 1.356, while that
of Method S2 is 133% with a standard deviation of 2.251. Both Methods S1 and
S2 can provide accurate predictions for certain specimens. In contrast, neither
of the two models can provide an effective prediction for the remaining specimens.
It should be noted that such errors may arise from either the analytical models
or experimental measurement errors. The errors of the analytical models may come from the
idealization of the connection, measured material strength and so on. The
experimental measurement errors may be caused by the installation of the tested
specimens (e.g., relative slide, content of stiffening, machining error, etc.),
the accuracy of the apparatus and so on. Actually, errors larger than 500%
are also found in existing literature when predicting the initial stiffness
of the top and seat angle connections (Kong and Kim, 2017). Hence a numerical database is necessary for selecting
a more accurate initial stiffness calculation method. Similar model selection
methodology is also adopted in many existing studies (Hasan et al., 2017;
Kong and Kim, 2017).
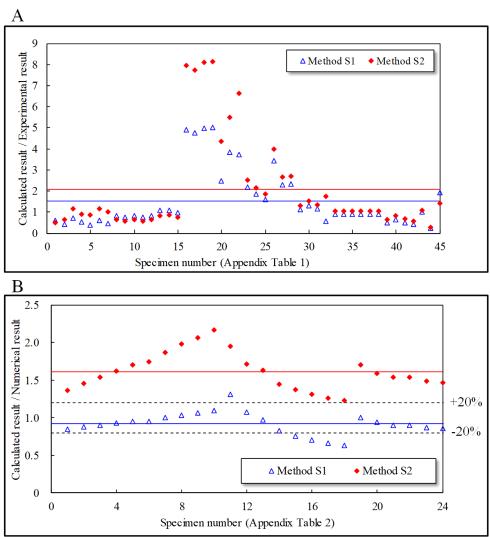
Figure 8. Comparison of different initial stiffness calculation
methods. (A) Comparison with experimental database. (B) Comparison
with numerical database.
Compared to the experimental results, the
FE model results can avoid errors from the experimental measurement. For all
of the models in the numerical database, the calculated initial stiffness
values are compared to the numerical results in Figure 8B. It is demonstrated
that the calculated initial stiffness of Method S1 is slightly smaller than
the numerical result. The MAE of Method S1 is 12.80% with a standard deviation
of 0.145. In contrast, the result of Method S2 is higher than the corresponding
numerical results. The MAE is 61.59% with a standard deviation of 0.247. Based
on the comparison of the two methods, Method S1 is suggested for calculating
the initial stiffness of the top angle in this study.
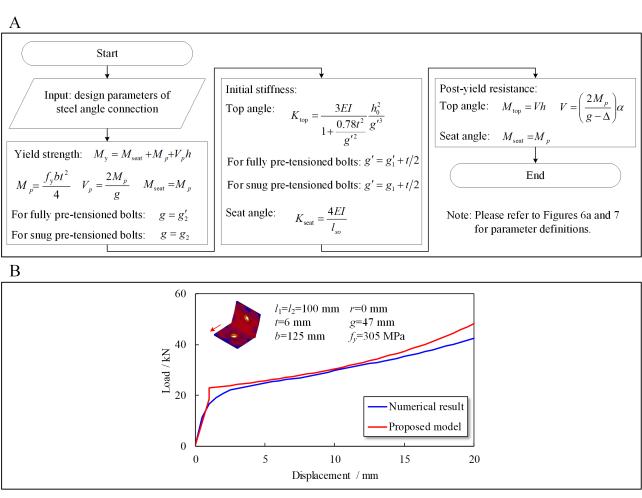
Figure 9. Calculation method for steel angle connection. (A)
Calculation procedure. (B) Validation of proposed method.
To conclude, the proposed calculation procedure
for the top and seat angle connection is summarized in Figure 9A. Taking model
T6 in Appendix Table 2 as an example, the calculated load-displacement curve
using the proposed method is compared to the numerical results, with strong
agreement, as indicated in Figure 9B.
5
Analytical model for MHRPC frame
5.1 Seismic resistance
According to El-Sheikh et al. (2000), during
the initial loading stage of the seismic cyclic test, the deformation of the
beam-column joint arises from the flexural deformation of the prefabricated
concrete beam until reaching the linear limit state. The initial stiffness
is defined as the secant stiffness when the component reaches the linear limit
state. El-Sheikh et al. (2000) suggested that the linear limit state moment
could be determined according to Equations 13 to 15.
where
Mll is the linear limit state moment corresponding to the
frame beam on one side of the beam-column joint; T is the pre-tension
force of a PT tendon; fpi is the initial stress of
a PT tendon; Ap is the total area of the PT tendons; h
is the beam height; fci is the initial stress of the
concrete under pre-tension; and fc' is the concrete
cylinder strength. Note that, in the seismic cyclic tests of Lin et al. (2018),
as the specimen is loaded at the beam ends on both sides of the joint, the
calculated linear limit state should be 2Mll.
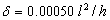
Before the specimen reaches the linear limit
state, the initial stiffness of the moment-rotation relationship for the MHRPC
joint specimens can be approximated by Equation 16.
|
 ,
,
|
(16)
|
where
E is the material elastic modulus, and for simplicity, the elastic
modulus of concrete is used in this study; Ig is the sectional
moment inertia; and L is the effective length of the frame beam on
one side of the joint, which can be taken as the distance between the edges
of two steel jackets. In the seismic cyclic tests of Lin et al. (2018), L
= 1.2 m. According to the drawings provided in Lin et al. (2018), the
calculated initial stiffness is 8138 kNˇ¤m for the MHRPC joint specimen. Moreover,
in the first test of this specimen (initial pre-stressing level: 42%), the
calculated linear limit state moment is 34.7 kNˇ¤m, corresponding to a joint
rotation of 0.426%. In the second test (initial pre-stressing level: 20%),
the linear limit state moment is 16.7 kNˇ¤m, corresponding to a joint rotation
of 0.205%.
According to Lin et al. (2018), in the seismic
cyclic test of the MHRPC frame joint specimen, the prefabricated beams rotate
along the corner points at the beam-column interfaces, as illustrated in Figure
4A. The steel angles begin to deform and contribute to the flexural resistance
once the specimen reaches the linear limit state. The deformation of the steel
angle heel (D) can be calculated according to Equation 17:
|
 ,
,
|
(17)
|
where
q is the joint rotation and qll is the joint rotation corresponding to the linear limit
state. Note that, when q is smaller than qll, D = 0. h is the beam height. The resistance from
the top and seat angle connection can be calculated according the procedure
illustrated in Figure 9A.
Moreover, the elongation of the top PT tendon
(Dtendon) can be calculated by Equation 18, according
to the deformation mode of the beam-column joint, as illustrated in Figure
10:
|
 ,
,
|
(18)
|
where
d1 and d2 are the distances from the PT
tendon centers to the bottom of the prefabricated beam, respectively. Note
that, in the MHPRC frame, the PT tendons are arranged symmetrically along
the sectional height, and the elongation of the bottom PT tendon can also
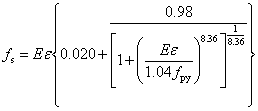
be calculated by Equation 18. When considering the total length of the PT
tendon (ltendon), the strain increment in Equation 1 can
be calculated following De = Dtendon/ltendon, based on which
the internal force of the PT tendon can be determined. Furthermore, the flexural
resistance contribution of the PT tendons can be obtained.
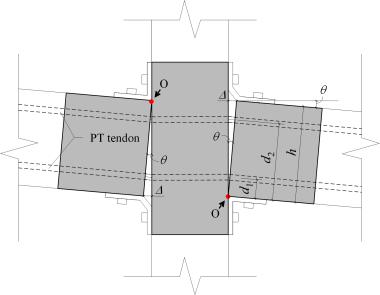
Figure 10. Joint region deformation of the seismic cyclic test
specimen
The moment-rotation relationship of the MHRPC
joint specimen can be approximated by summing the flexural resistance contributions
from the PT tendons and steel angle connections. Note that, in the seismic
cyclic tests of Lin et al. (2018), the MHRPC joint specimen is tested twice
in order to verify the reparability and self-centering capacity. During the
first test, the initial pre-stressing level is set as 42%, while in the second
test, it is 20%. The analytical backbone curves are compared to the experimental
results in Figure 11. It should be noted that the calculated tendon force-rotation
relationships in the two tests are also compared to the experimental measurements
in Figure 11. The results indicate that the calculated cyclic response of
the MHRPC joint specimen, including the tendon force-rotation relationship,
fits strongly with the test results. The proposed method can be used in the
seismic resistance design and analysis of such MHRPC frame structures.
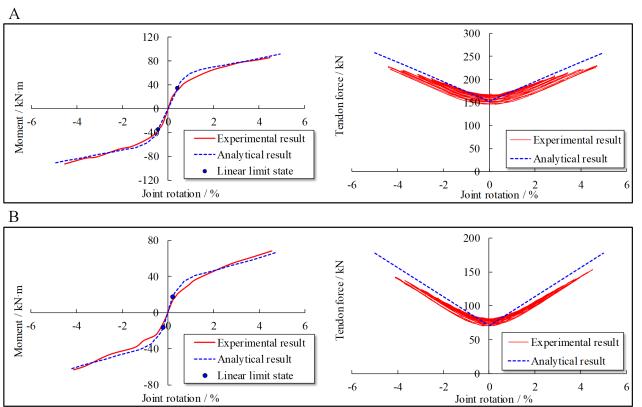
Figure 11. Comparison of seismic cyclic test results. (A) First
test of MHRPC joint specimen (initial pre-stressing level: 42%). (B)
Second test of MHRPC joint specimen (initial pre-stressing level: 20%).
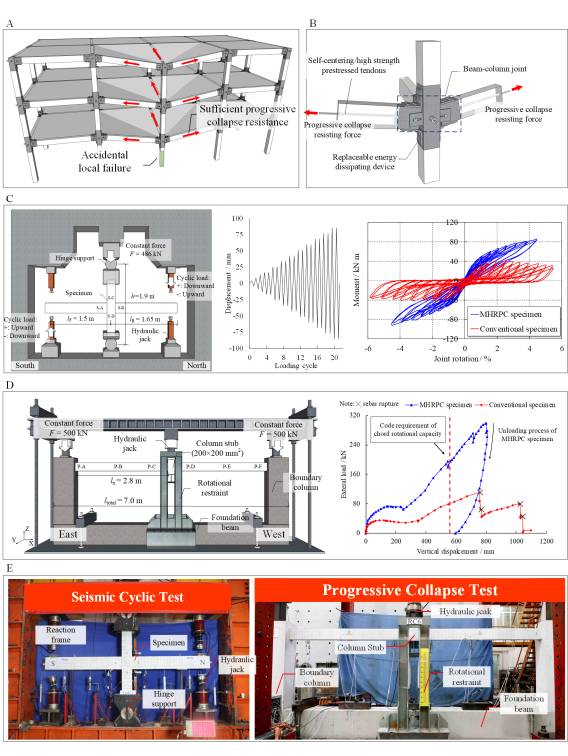
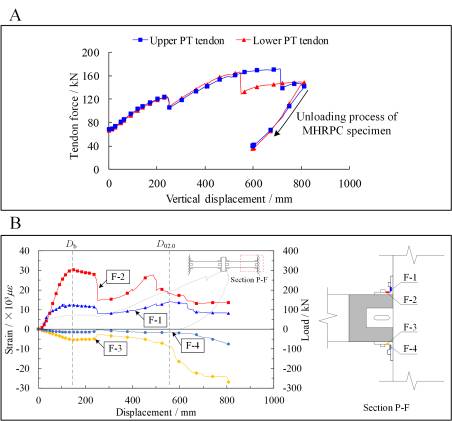
5.2 Progressive collapse test
As discussed previously, according to the
load-displacement curve in Figure 1D, the loading process of the progressive
collapse test of the MHRPC substructure can be divided into the beam mechanism
and catenary mechanism stages. Hence, the analytical model also includes the
beam mechanism and catenary mechanism parts.
5.2.1 Beam mechanism
The progressive collapse resistance of the
MHRPC substructure mainly originates from the CAA and flexural resistance
of the frame beam. The calculation method proposed by Lu et al. (2018) is
adopted in this study. The peak displacement corresponding to the peak CAA
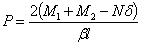
resistance can be estimated by Equation 19.
|
 ,
,
|
(19)
|
where
l is the total specimen length and h is the beam height. Furthermore,
the progressive collapse resistance can be calculated following the Park and
Gamble (2000) method (Equations 20 to 25).
|
|
(20)
|
|
|
(21)
|
|

|
(22)
|
|

|
(23)
|
|

|
(24)
|
|
 ,
,
|
(25)
|
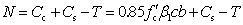
where
the parameter definitions are illustrated in Figure 12. A more detailed CAA
calculation procedure in RC frame beams can be found in Lu et al. (2018).
The calculated CAA resistance of the progressive
collapse test specimen in Lin et al. (2018) is 58.53 kN. Combined with the
previously estimated peak displacement, a typical loading point can be denoted
as illustrated in Figure 15A.
Figure 12. Definition of parameters in Park and Gamble model (2000)
5.2.2 Catenary mechanism
During the catenary mechanism stage, the
MHRPC substructure deforms, as illustrated in Figure 13. The elongation of
a PT tendon can be calculated by Equation 26, according to the geometry.
|
 ,
,
|
(26)
|
where
d is the column stub displacement and ln
is the net span of the prefabricated beam. Based on the tendon elongation,
the strain increment and tendon force can be calculated further. The progressive
collapse resistance contribution of the PT tendons is composed of the vertical
components of the tendon forces.
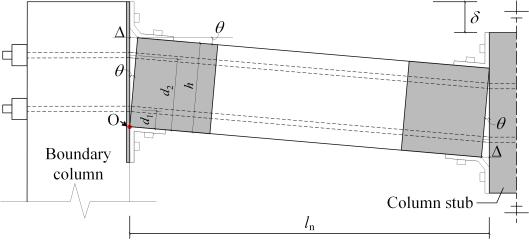
Figure 13. Deformation of progressive collapse test specimen
Moreover, according to Yang and Tan (2013),
the catenary force contribution of the steel angle connections is dependent
on the ultimate tensile force of the steel angles, which can be calculated
by Equation 27.
|
 ,
,
|
(27)
|
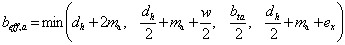
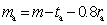
where
Na is the ultimate tensile force of the steel angle and beff,a
is the effective width of the steel angle, which is determined by Equations
28 and 29.
|
|
(28)
|
|
 ,
,
|
(29)
|
where
the parameter definitions are provided in Figure 14.
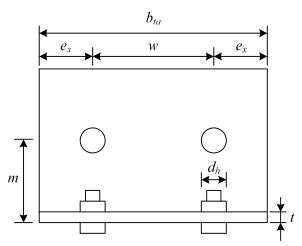
Figure 14. Definitions of angle parameters (Yang and Tan, 2013)
For the steel angle used in the progressive
collapse test of the MHRPC substructure, the calculated beff,a
and Na values are 62.5 mm and 130.54 kN, respectively. Furthermore,
the progressive collapse resistance contribution is composed of the vertical
components of tensile forces in the steel angles.
The calculated load-displacement curve of
the progressive collapse test is compared to the experimental result, as illustrated
in Figure 15A. It should be noted that the tendon force-displacement relationship
is also compared in Figure 15B. The results indicate the proposed method can
provide reasonable predictions of the progressive collapse resistances for
MHRPC substructures in the beam mechanism and catenary mechanism stages.
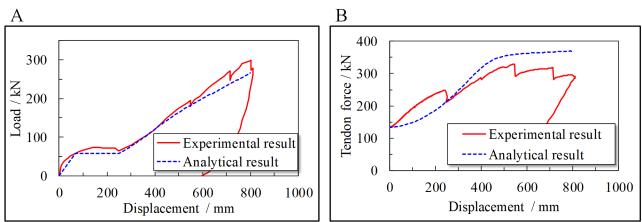
Figure 15. Comparison of initial stiffness. (A) First test.
(B) Second test.
6
Conclusion
A novel MHRPC frame system has been proposed
to improve the seismic and progressive collapse performance of commonly used
RC frames by Lin et al. (2018). In this study, based on the experimental tests
of the MHRPC frame specimens, an analytical model for the design of the MHRPC
frame is established and validated by means of experimental results. The main
contributions of this study include the following.
(1) The resistance contributions of different
components in the MHPRC frame are analyzed based on the experimental measurement
data, which lays a foundation for developing the proposed calculation methods
for the MHRPC frame.
(2) Two databases of steel angle connections
(experimental and numerical) are constructed based on the literature review
and FE modeling using MSC.Marc. An analytical model for the steel angle is
suggested and validated using the databases.
(3) The deformation modes of the MHRPC specimens
in the seismic cyclic and progressive collapse tests are analyzed to calculate
the deformation of steel angles and elongations of PT tendons. On this basis,
the resistance contributions of both the PT tendons and steel angle connections
are quantified using the tendon constitutive and steel angle models. Thereafter,
the seismic cyclic and progressive collapse responses of the MHRPC specimens
are calculated and validated using the experimental results.
This work could provide a reference for the
seismic and progressive collapse design of such MHRPC frame structures.
Acknowledgement
The authors are grateful for the financial
support received from the National Natural Science Foundation
of China (No. 51778341).
References
Ahmed, A., and Hasan, R. (2015). Effect and evaluation
of prying action for top-and seat-angle connections. Int. J. Adv. Struct.
Eng. 7(2), 159-169.
Ahmed, A., Kishi, N., Matsuoka, K. I.,
and Komuro, M. (2001). Nonlinear analysis on prying of top-and seat-angle
connections. J. Appl. Mech. 4, 227-236.
American Concrete Institute (ACI). (2013). Design specification
for unbonded post-tensioned precast concrete special moment frames satisfying
ACI 374.1 and Commentary. ACI 550.3-13. Farmington Hills, MI.
Bernuzzi, C., Zandonini, R., and Zanon, P. (1996). Experimental
analysis and modelling of semi-rigid steel joints under cyclic reversal loading.
J Constr. Steel. Res. 38(2), 95-123.
Calado, L., and Ferreira, J. (1994). Cyclic behaviour
of steel beam-to-column connections - an experimental research. Proc. of
International Workshop and Seminar on Behaviour of Steel Structures in Seismic
Areas. 381-389.
Department of Defense (DoD). (2016). Design of structures
to resist progressive collapse. Unified facility criteria, UFC 4-023-03, Washington,
DC.
Ellingwood, B. R. (2006) Mitigating risk from abnormal
loads and progressive collapse. J Perform. Constr. Facil. 20(4), 315-323.
El-Sheikh, M., Pessiki, S., Sause, R., and Lu L. W. (2000).
Moment rotation behavior of unbonded post-tensioned precast concrete beam-column
connections. ACI Struct. J. 97(1), 122-131.
ElSayed, M., El-Dakhakhni, W., and Tait, M. (2015). Resilience
evaluation of seismically detailed reinforced concrete-block shear walls for
blast-risk assessment. J Perform. Constr. Facil. 30(4), 04015087.
Fleischman, R. B., Chasten, C. P., Lu, W. L., and Driscoll,
G. C. (1989). Top and seat angle connections and end plate connections: snug
vs fully pre-tensioned bolts. ATLSS Report No. 89-06, Lehigh University.
Fujikura, S., Bruneau, M., and Lopez-Garcia, D. (2008).
Experimental investigation of multihazard resistant bridge piers having concrete-filled
steel tube under blast loading. J. Bridge Eng. 13(6), 586-594.
Garlock, M. M., Ricles, J. M., and Sause, R. (2003).
Cyclic load tests and analysis of bolted top-and-seat angle connections. J
Struct. Eng. 129(12), 1615-1625.
Gidaris, I., Padgett, J. E., Barbosa, A. R., Chen, S.,
Cox, D., Webb, B., and Cerato, A. (2017). Multiple-hazard fragility and restoration
models of highway bridges for regional risk and resilience assessment in the
United States: state-of-the-art review. J Struct. Eng. 143(3), 04016188.
Hasan, M. J., Ashraf, M., and Uy, B. (2017). Moment-rotation
behaviour of top-seat angle bolted connections produced from austenitic stainless
steel. J. Constr. Steel. Res. 136, 149-161.
Kamath, P., Sharma, U. K., Kumar, V., Bhargava, P., Usmani,
A., Singh, B., Singh, Y., Torero, J., Gillie, M. and Pankaj, P. (2015). Full-scale
fire test on an earthquake-damaged reinforced concrete frame. Fire Saf.
J. 73, 1-19.
Kishi, N., and Chen, W. F. (1990). Moment-rotation relations
of semirigid connections with angles. J Struct. Eng. 116(7), 1813-1834.
Kishi, N., Ahmed, A., Yabuki, N., and Chen, W. F. (2001).
Nonlinear finite element analysis of top-and seat-angle with double web-angle
connections. Struct. Eng. Mech. 12(2), 201-214.
Komuro, M., Kishi, N., and Chen, W. F. (2004). Elasto-plastic
FE analysis on moment-rotation relations of top-and seat-angle connections.
Connections in Steel Structures V-Amsterdam. 111-120.
Kong, Z., and Kim, S. E. (2017). Numerical estimation
for initial stiffness and ultimate moment of top-seat angle connections without
web angle. J. Struct. Eng. 143(10), 04017138.
Li, W. L. (2007). Behavior of semi-rigid beam-to-column
minor axis connections in steel frame. [dissertation]. [XiˇŻan]: XiˇŻan University
of Architecture & Technology. (in Chinese)
Li, Y., Ahuja, A., and Padgett, J. E. (2011). Review
of methods to assess, design for, and mitigate multiple hazards. J Perform.
Constr. Facil. 26(1), 104-117.
Lin, K. Q., Li, Y., Lu, X. Z., and Guan, H. (2017). Effects
of seismic and progressive collapse designs on the vulnerability of RC frame
structures. J Perform. Constr. Facil. 31(1), 04016079.
Lin, K. Q., Lu, X. Z., Li, Y., and Guan, H. (2018) Experimental
study of a multi-hazard resistant prefabricated reinforced concrete frame
structure. Soil Dyn. Earthq. Eng. doi: 10.1016/j.soildyn.2018.04.011
Lu, X.L., Cui, Y., Liu, J.J., and Gao W.J. (2015). Shaking
table test and numerical simulation of a 1/2©\scale self©\centering reinforced concrete frame. Earthq. Eng.
Struct. Dyn. 44(12), 1899-1917.
Lu, X. Z., Lin, K. Q., Li, C. F., and Li., Y. (2018)
New analytical calculation models for compressive arch action in reinforced
concrete structures. Eng. Struct. (168), 721-735.
Lu, X. Z., Ye, L. P., Ma, Y. H., and Tang, D. Y. (2012).
Lessons from the collapse of typical RC frames in xuankou school during the
great wenchuan earthquake. Adv. Struct. Eng. 15(1), 139-153.
Mander, J. B., Chen, S. S., and Pekcan, G. (1994). Low-cycle
fatigue behavior of semi-rigid top-and-seat angle connections. Eng. J.-Amer.
Inst. Steel Constr. 31(3), 111-122.
Mattock, A. H. (1979). Flexural strength of prestressed
concrete sections by programmable calculator. PCI J. 24(1), 32-54.
Park, R., and Gamble, W. L. (2000). Reinforced concrete
slabs. John Wiley & Sons.
Priestley, M.N., and Tao, J.R. (1993). Seismic response
of precast prestressed concrete frames with partially debonded tendons. PCI
J. 38(1), 58-69.
Shah, A. H., Sharma, U. K., Kamath, P., Bhargava, P.,
Reddy, G. R., and Singh, T. (2016). Effect of ductile detailing on the performance
of a reinforced concrete building frame subjected to earthquake and fire.
J Perform. Constr. Facil. 30(5), 04016035.
Song, L.L., Guo, T., and Chen, C. (2014). Experimental
and numerical study of a self©\centering prestressed concrete
moment resisting frame connection with bolted web friction devices. Earthq.
Eng. Struct. Dyn. 43(4), 529-545.
Song, L.L., Guo, T., and Cao, Z.L. (2015). Seismic response
of self-centering prestressed concrete moment resisting frames with web friction
devices. Soil. Dyn. Earthq. Eng. 71, 151-162.
Sozen, M. A., Thornton, C. H., Corley, W. G., and Sr,
P. F. M. (1998). The Oklahoma City bombing: structure and mechanisms of the
Murrah Building. J Perform. Constr. Facil. 12(3), 120-136.
Wolski, M., Ricles, J.M., and Sause, R. (2009). Experimental
study of a self-centering beam-column connection with bottom flange friction
device. J. Struct. Eng. 135(5), 479-488.
Yang, B., and Tan, K. H. (2013). Robustness of bolted-angle
connections against progressive collapse: mechanical modelling of bolted-angle
connections under tension. Eng. Struct. 57 153-168.
Yang, J. G., and Jeon, S. S. (2009). Analytical models
for the initial stiffness and plastic moment capacity of an unstiffened top
and seat angle connection under a shear load. Int. J. Steel Struct.
9(3), 195-205.
Yuan, Y. (2007). Bearing performance analysis for top
and seat angle connections to weak axis of H shaped column by pseudo-static
test. [MasterˇŻs thesis]. [XiˇŻan]: XiˇŻan University of Architecture & Technology.
(in Chinese)
Yi, W. J., He, Q. F., Xiao, Y., and Kunnath, S. K. (2008).
Experimental study on progressive collapse-resistant behavior of reinforced
concrete frame structures. ACI Struct. J., 105(4), 433.
|
 ,
, ,
,