|
4. Technical implementation
4.1 Seismic damage prediction based on BIM and
FEMA P-58
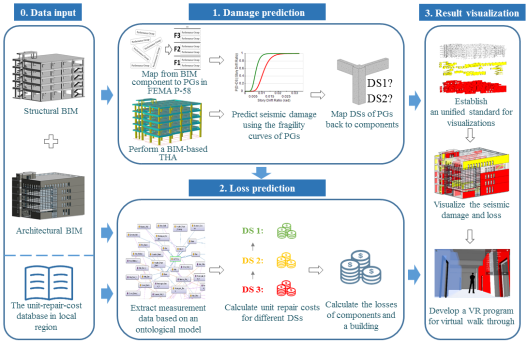
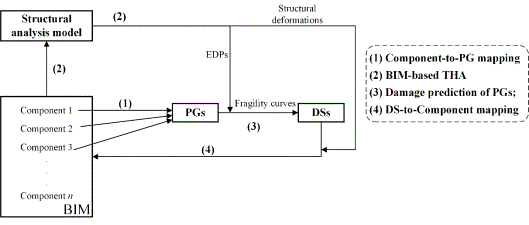
As shown in Figure 2, the seismic
damage prediction for the components includes four steps: (1) establish the
mapping relationships between the components in the BIM to the PGs in FEMA P-58; (2) convert the BIM into a structural analysis
model and perform THA for predicting the EDPs and structural deformations;
(3) predict the damage of the PGs based on the EDPs in step (2) and the fragility
curves in FEMA P-58; (4) reversely map the damage of the PGs to the components
and obtain the DSs of the components. The details of these four steps are
illustrated below.
|
|
|
Fig. 2. Flow chart of seismic damage prediction for components
|
Step 1: Mapping from components to PGs
In FEMA P-58, each PG has a unique
ID and a detailed classification criterion. The mapping from a component to
the PG is to determine the corresponding PGˇŻs ID for each component according
to its classification criterion. The classification of the PGs in FEMA P-58
considers the geometries, materials, constructions, and damage mechanisms.
Generally, the geometrical and material properties can be obtained from the
BIM; however, the information of construction and damage mechanism must be
added manually. Therefore, a solution combining the automatic and manual procedure
(see Figure 3) is adopted to establish the mapping relationships from the
components to the PGs herein.
|
|
|
Fig. 3. The process of mapping
from components to PGs
|
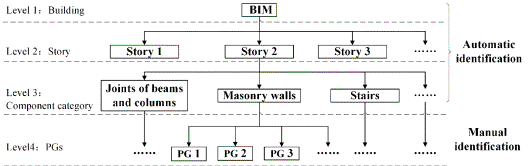
Specifically, the mapping process
is divided into four levels (as shown in Figure 3): building, story, component
category, and PG. In FEMA P-58, the seismic damage is predicted story by story;
therefore, the mapping is also conducted story by story to be consistent with
FEMA P-58. A BIM (Level 1) is first split by stories (Level 2) according to
the elevations of stories; then, different categories of components on each
story (Level 3) are identified in BIM; finally, the PGs (Level 4) are identified
manually according to the attributions of component categories in BIM and
the necessary information on constructions and damage mechanisms.
In this study, Revit [29],
a widely-used BIM program, is adopted for the modeling. Accordingly, the mapping
process of the above four levels can also be implemented on Revit as follows:
Level 1: A BIM including architectural
and structural information is created by Revit for the following mapping.
Level 2: The elevations of stories
are used to split a BIM into different story models. Specifically, the class
ElementCategoryFilter in the Revit API is used to collect the elevation
elements. Using the elevation elements and the class ElementLevelFilter,
the components on different stories
are filtered to generate the story models.
Level 3: Generally, the components
are named differently during the modeling, leading to difficulties on the
identification of the component categories. Consequently, Family Instance
is used to identify different component categories. In Revit, the hierarchy
of components includes Category, Family, Family Symbol,
and Family Instance. Each component is a Family Instance with
the information of its hierarchy. The name of Category is pre-defined
by Revit and cannot be changed by users, so that the component categories
can be identified by Category in the hierarchy of Family Instance.
In the Revit API, ElementCategoryFilter() can implement such an identification
function.
Level 4: In a component category,
each component will be marked with an ID manually according to the classification
criteria of the corresponding PG in FEMA P-58.
To store the IDs of the PGs, a new
attribute named P58_ID is added to the attribute table of each component.
It is noteworthy that a component may have more than one PGˇŻs ID. In FEMA
P-58, the corresponding PGs to calculate the damage of beams, slabs, and columns
are their common joints. Therefore, some structural components, such as beams,
slabs, and columns, will store multiple P58_IDs according to the numbers
of their joints.
Step 2:
THA based on BIM
Converting a BIM into a structural
analysis model can reduce the workload in modeling. Several structural analysis
programs contain such a conversion function, such as ETABS [30],
Robot [31], and YJK [32]. In this study, YJK is selected
as the structural analysis program. This is because numerous structural sub-models
for the joints and sections in Revit have been developed in YJK [33],
resulting in high conversion efficiency from a BIM to a structural analysis
model.
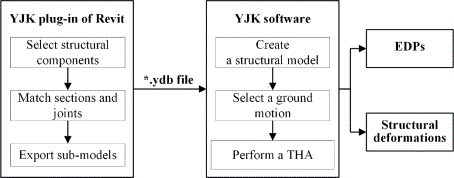
The process of THA based on the BIM
is shown in Figure 4. Using the YJK plug-in in Revit, the structural components
that will be converted to the structural analysis model are selected. These
selected components will be matched to the sections and joints (e.g., columns
and beams) with the predefined sub-models in YJK. Finally, these sub-models
are exported in the format of a .ydb file. In YJK, the structural model is
first created by importing the .ydb file. Subsequently, the structural loads
such as gravity are assigned to the model, and the corresponding ground motion
is selected for a nonlinear THA. Finally, the EDPs (e.g., IDRs and PFAs) and
structural deformations (e.g., plastic-hinge rotations) produced by the THA
are output for the following damage prediction of components.
|
|
|
Fig. 4. Flow chart of BIM-based
THA
|
Step 3:
Seismic damage prediction of PGs
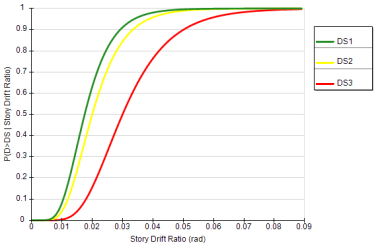
FEMA P-58 provides the fragility curves
for all PGs, as shown in Figure 5. Through the fragility curves, the probabilities
of a PG at different DSs can be determined under a given EDP.
|
|
|
Fig. 5. A typical fragility
curve of a PG in FEMA P-58
|
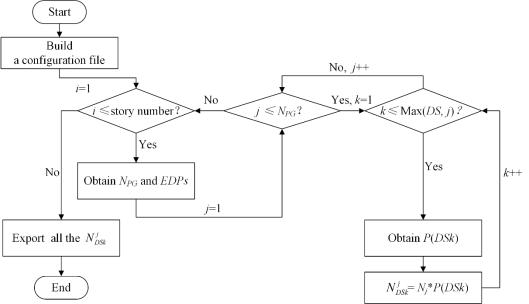
The algorithm of damage prediction
of the PGs is designed in this study, as illustrated in Figure 6. Generally,
the damage of PGs is predicted story by story. Firstly, a configuration file
including the numbers of PGs (denoted as NPG), and the required
EDPs on each story is built. On each story, the NPG and
the corresponding EDPs are obtained from the configuration file. Subsequently,
the numbers of components at different DSs are calculated for each PG. For
the jth PG (i.e., PGj), P(DSk)
represents the probability at damage state k, which can be obtained
through the fragility curves, and  denotes the number of components at DSk,
i.e., the product of P(DSk) and the total number of components
in PGj (denoted as Nj). It is noteworthy
that the function Max(DS, j)
represents the maximum DS of PGj. Finally, the values of
denotes the number of components at DSk,
i.e., the product of P(DSk) and the total number of components
in PGj (denoted as Nj). It is noteworthy
that the function Max(DS, j)
represents the maximum DS of PGj. Finally, the values of
 at different DSs of all PGs are exported
for calculating the damage of the components.
at different DSs of all PGs are exported
for calculating the damage of the components.
|
|
|
Fig. 6. The algorithm of damage
prediction of PGs
|
Step 4:
Reverse mapping of DSs from PGs to components
Even though the components belong
to the same PG on the same story, they may exhibit different DSs. For example,
in a PG of masonry walls on a certain story, the probabilities of DS1, DS2,
and no damage predicted by FEMA P-58 are 22%, 28%, and 50%, respectively,
when the corresponding peak IDR is 0.002. However, FEMA P-58 does not provide
the DS of each component. Hence,
a reverse mapping algorithm of DSs from PGs to components is designed to determine
the DS of each component.
The mapping principles of nonstructural and structural components are
different. For nonstructural components, the distribution of DSs on the same
story exhibits a large uncertainty [34,
35]. Therefore, DSs can
be randomly assigned to the components belonging to the same PG. For structural
components, the distribution of DSs should be consistent with the results
of the THA. The rotations of plastic hinges calculated by the THA are adopted
as an indicator to map the DSs to the joints of structural components (e.g.,
beams, slabs, and columns).
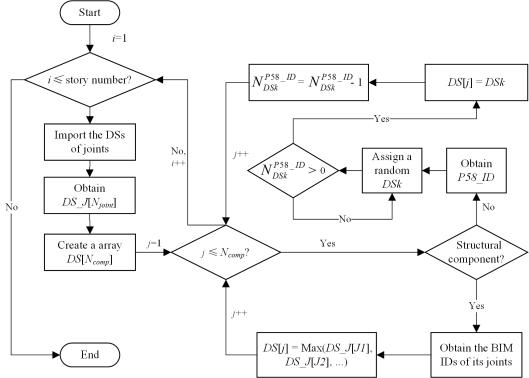
The detailed process of the reverse mapping of DSs can be implemented story by story,
as shown in Figure 7. First, the DSs of the joints of structural components
are imported, and the array DS_J[Njoint] that stores
the DSs of all the joints on the story (the total number is Njoint)
is obtained. Specifically, the higher DSs correspond to the joints with larger
plastic-hinge rotations in DS_J[Njoint]. Subsequently,
a new void array DS[Ncomp] is created to store the
DSs of all the components on the story (the total number is Ncomp).
Finally, for a component j, the DS[j] will be determined
in two different methods according to whether it is a structural component.
If it is a structural component, the maximum DS of the connected joints will
be assigned to this component. Specifically, DS[j] = Max(DS_J[J1],
DS_J[J2], ...). Here, J1 and J2
are the IDs of the joints connected to this component in the BIM. If the
component is a nonstructural component, a random DSk will be assigned
to this component according to the statistics of different DSs in the corresponding
PG. This process will be repeated until all components on this story have
been mapped with the corresponding DSs.
|
|
|
Fig. 7. A reverse mapping algorithm
of damage from PGs to components
|
The above process can be implemented
through the Revit API. The P58_IDs of the components are obtained from
the attribute tables through the function Element.get_Parameter().
The predicted DSs of the components are also written in the attribute tables for the
following prediction of seismic losses. The writing process of the DS to the
component can be implemented through functions ExternalDefinitonCreationOptions(),
InstanceBinding(), and Parameter.Set().
4.2 Loss prediction based on BIM and the unit-repair-cost
database
(1) Ontology-based acquisitions for the measurement
data of components
In the unit-repair-cost database,
there are plenty of deduction rules for measuring components. For instance,
the volume of a wall should subtract the holes of the windows and doors on
this wall. To calculate such deductions automatically, an ontology-based model
is created following these deduction rules strictly.
The creation of an ontology-based
model includes two important steps: (a) establish ontological relationships
of components; (b) define semantic reasoning rules for the deductions between
components.
(a) Establish ontological relationships
A free, open-source ontology editor,
Prot¨¦g¨¦ [36], and a widely-used semantic language, Web Ontology
Language (OWL) [37], are adopted to establish the ontological relationships.
The ontologies and instances of the components related to the seismic structural
losses (e.g., beams, columns and walls) and their attached components (e.g.,
doors and windows) are created using OWL in Prot¨¦g¨¦. The ontologies of different
types of components are created based on a root ontology Owl:Thing.
The instances correspond to specific components in a BIM. Thereby, they are
created by importing the data of component properties (e.g., ID, area and
volume) from a BIM.
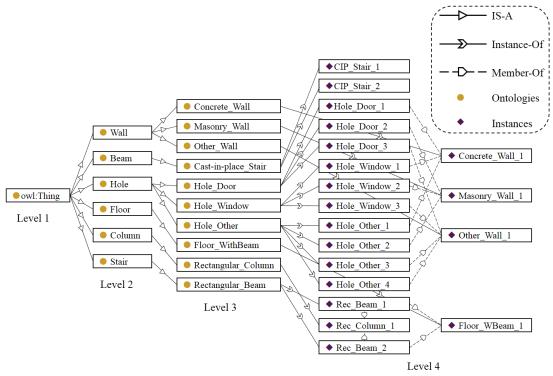
The ontological relationships of the
components are designed as illustrated in Figure 8. There are three types
of relationships: IS-A, Instance-Of and Member-Of. The
IS-A relationship means A is a subclass of B, e.g. a
masonry wall is a subclass of a wall; while the Instance-Of relationship
means A is an instance of B. The Member-Of relationship
means A is a member of B, e.g. a door is a member of a wall,
which can be used to calculate the deductions between components.
|
|
|
Fig. 8. The designed ontological relationships
|
(b) Define semantic reasoning
rules
A semantic web rule language (SWRL) [38], is adopted
to define the semantic reasoning rules of different ontologies following the
local unit-repair-cost database. Taking a Chinese database [12]
for example, the database demands that if the hole area of a window or a door
on a wall is greater than 0.3 m2, the hole must be subtracted from
the wall. The semantic reasoning rules in SWRL can be expressed as follows:
Hole(?name) ˇÄ elementID(?name, ?element_ID) ˇÄ
holeArea(?name, ?area) ˇÄ
swrlb:greaterThan(?area, 0.3) ˇú deducted(?name, true)
|
|

In the first line of the
above code, Hole means a type of an ontology, and the symbol of ˇ°?ˇ±
is used to extract the data of variables (e.g., name, element_ID
and area). In addition, the ˇ°ˇÄˇ± means ˇ°andˇ±. Thus,
the first line is used to obtain the information of windows and doors. In
the second line, the function of swrlb:greaterThan can judge whether
the area is greater than 0.3 m2. If so, the function of deducted(?name,
true) will deduct the corresponding component.
Similarly, the other deduction
rules of components (e.g., a beam should subtract its joints with columns)
can also be defined using SWRL, and the deducted results can be automatically
calculated according to the defined rules.
Based on the deduction results, the
exact measurement data of components can be easily extracted in a BIM. For
most components, the volumes and projected areas are selected as measurement
units for loss predictions. In the Revit API, the volume of each component
can be obtained through the function get_Parameter(), while the projected
area of a component can be obtained through the function get_BoundingBox().
The obtained measurement data will be used for the following loss predictions.
(2) Acquisitions of unit repair costs
Many governments and professional
associations have published the official construction codes, such as the MasterFormat code [10-11], and the Beijing repair code [12]. By using the unit-repair-cost
database in these codes, the loss prediction result will agree with the actual
situations in the local area. However, these cost data only correspond to the state of complete
damage. The consequence functions in FEMA P-58 provide the unit repair costs
corresponding to different DSs. Therefore, the ratio of costs between different
DSs in FEMA P-58 can be used to calculate the unit repair costs corresponding
to different DSs in the database.
In this study, the function F(P58_ID,
DSn) was established. This function will obtain the unit repair
cost of a component with a P58_ID at DSn from the consequence functions in FEMA P-58. Define the unit
repair cost of a component in the database as Unit_Cost_Max.
If this component is a nonstructural component, the unit repair
cost corresponding to DSn, denoted as Unit_Cost_DSn,
can be calculated by Equation
(1):
|

|
(1)
|
where, P58_ID is the ID of the corresponding
PG of this component, and DS_Max
represents the maximum DS
of the PG.
If the component is a structural component, it has more than one P58_IDs. Thus, the average of the repair costs for the
joints is used to calculate its repair cost. The unit repair cost of a structural
component corresponding to DSn is as shown in Equation (2):
|

|
(2)
|
where J means the number of joints connected to this component,
and P58_IDi is an ID of the PG of the joints.
(3) Loss predictions
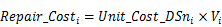
Assume the DS of component i
is DSn, and the corresponding measurement data is Vi,
the repair cost of this component, Repair_Costi, can be
calculated by Equation (3):
| |
|
(3)
|
where Unit_Cost_DSni is the corresponding
unit repair cost of the component.
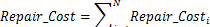
Repair_Cost, which
is the repair cost of the entire
building, can be calculated by Equation (4):
| |
|
(4)
|
where N represents the total number of components in this building.
4.3 Visualization of seismic damage and loss
(1) A unified visualization standard
According to FEMA P-58, the numbers
of DSs of the components are different. For example, the joints of beams and
columns generally contain three DSs, while masonry walls generally contain
two DSs. To visualize the DSs of the components in a unified manner, two different
visualization modes are designed in this study: the absolute mode and the
relative mode.
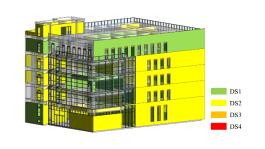
In the absolute mode, each DS is marked
with a certain color, as shown in Table 1. It is noteworthy that white with
half transparency is used to represent a non-damaged state, which can highlight
the other DSs.
Table 1 Colors of DSs in the absolute
mode
|
Damage states
|
Colors
|
|
No damage
|
 White with half transparency
|
|
DS1
|
 Green Green
|
|
DS2
|
 Yellow Yellow
|
|
DS3
|
 Orange Orange
|
|
DS4
|
 Red Red
|
The absolute mode can display the
DSs of a component directly; however, it is difficult to demonstrate whether
the components can be repaired. For example, a beam-column joint at DS2 can
be repaired, while a masonry wall at DS2 will be generally dismantled. Therefore,
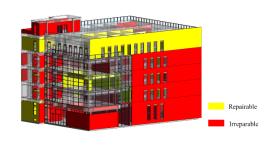
in this study, a relative mode is established to demonstrate the reparability
of the components. Specifically, DSs are classified as repairable and irreparable.
Hence, only three states need to be presented, using three colors, as shown
in Table 2.
Table 2 Colors of reparability
states in the relative mode
|
Reparability states
|
Colors
|
|
No damage
|
 White with half transparency
|
|
Repairable
|
 Yellow Yellow
|
|
Irreparable
|
 Red Red
|
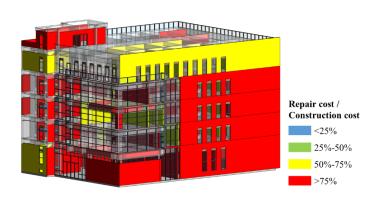
The losses of different components
vary significantly. Therefore, a relative mode is used. The losses are divided
into four categories based on the ratio of repair cost and construction cost.
Four colors are used to represent the four categories, as shown in Table 3.
Table 3 Colors of seismic losses
of components
|
Repair cost / Construction cost
|
Colors
|
|
0¨C25%
|
 Blue Blue
|
|
25¨C50%
|
 Green Green
|
|
50¨C75%
|
 Yellow Yellow
|
|
>75%
|
 Red Red
|
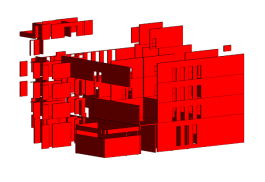
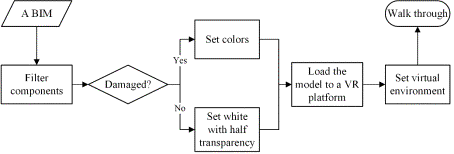
(2) 3D Visualization and virtual walk through
Taking the DSs of the components for
example, the 3D visualization process and the virtual walk through is shown
in Figure 9. First, the components in the BIM are divided into two groups
by filtering their DSs. For damaged components, different colors will be assigned
to them corresponding to their DSs. For undamaged components, their color
is white with half transparency to highlight the damaged components. Subsequently,
a 3D model with different colors is loaded into the VR platform, and the parameters
of the virtual environment (e.g., lights and the sky) are set. Finally, a
virtual walk through is performed to observe the distribution of seismic damage
inside the building. It is noteworthy that the 3D visualization process and
the walk through of the losses is similar to that of the DSs.
|
|
|
Fig. 9. 3D visualization process
and virtual walk through for DSs
|
The 3D visualization of damage and
losses is implemented through the Revit API. Specifically, the FilteredElementCollector
class is used to filter the components according to their DSs or losses. Functions
SetColorFaceColor() and SetSurfaceTransparency() are used to
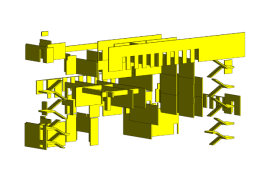
set the color and transparency of the components. In addition, function IsolateElementsTemporary() can be used to isolate the components according to their
DSs, and therefore display the components at a certain DS independently.
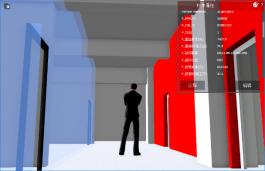
Fuzor [39] is used as the
VR platform in this study, because it can load a BIM into the VR scene with
sufficient information corresponding to the components. Through the "Fuzor
Plugin" in Revit, the colored BIM is synchronized to the VR scene for
a walk through. During the walk through, not only the distribution of the
DSs or losses can be observed by the colored components, but also the value
of loss of each component can be checked in the VR scene of Fuzor, which benefits
the decision making of repair strategies.
|