1 Introduction
Buildings and populations are being concentrated rapidly in urban areas (UN-Habitat, 2016), and are facing multiple risks once an earthquake occurs (Yamazaki et al., 2005; Zhao et al., 2009; Mousavi et al., 2008; Xu et al., 2016; Yang et al., 2015). The collapse resistances of buildings have been continuously improved in recent years (Lu et al., 2013; Li et al., 2014). However, the damage of non-structural components is still severe. In consequence, a large number of falling debris-induced casualties occurred in past earthquakes (Peek-Asa et al., 1998; Chan et al., 2006; Qiu et al., 2010). Moreover, falling debris will cover the roads and hindered the pedestrian movement in densely built-up areas (Goretti & Sarli, 2006; Hirokawa & Osaragi, 2016). Pedestrian evacuation to emergency shelters will be blocked by the falling debris, and the evacuation velocity will also be reduced (D��Orazio et al., 2014; Bernardini et al., 2016). Therefore, the influence of falling debris needs to be considered in earthquake evacuation, and two corresponding key issues need to be addressed: (1) How to predict the falling debris distribution; (2) How to model the influence of falling debris distribution on the pedestrian movement.
There are some existing studies about the falling debris of non-structural components induced by earthquakes. Liu et al. (2015) analyzed the debris of indoor partition walls and suspended ceilings based on the fragility curves of non-structural components. In their work, falling debris of non-structural components was assumed to cover the floor evenly and completely. Cimellaro et al. (2017) assumed the hazard ranges of existing obstacles during an earthquake. Satellite photographs were also utilized to identify building damage and outdoor debris distribution (Saito et al., 2004; Quagliarini et al., 2016). For example, on the basis of satellite images, Quagliarini et al. (2016) proposed ruins formation models using regression method, where ruins were assumed to uniformly distribute along the street. However, collision and motion of falling debris after hitting the ground are seldom considered in the aforementioned literature. Moreover, in the real world, the falling debris of non-structural components isn��t uniformly distributed. As a result, there is no suitable model to predict the distribution of falling debris of non-structural components.
Many factors need to be considered in pedestrian evacuation simulation after an earthquake. Xiao et al. (2016) adopted social force model to implement the evacuation simulation and proposed safety escape time criteria. Wijerathne et al. (2013) conducted pedestrian evacuation in a city, which investigated the behavior of human with different familiar extents. Osaragi et al. (2014) studied the roads covered by collapsed buildings and the influence of fire following earthquake, and also evaluated the risk areas during evacuation. D��Orazio et al. (2014) proposed human behavior model through analyzing human behaviors in earthquakes, in which the influence of debris induced by collapsed buildings was also included. Note that during the outdoor evacuation, people will encounter areas covered by debris. Existing studies mostly focus on the influence of debris caused by building collapse, while the studies of falling debris induced by non-structural components are limited (Alexander 1990). Neglecting the falling debris of non-structural components will underestimate their influence on evacuation. Meanwhile, the assumption that people can��t pass through the areas covered by some falling debris will overestimate the influence of falling debris on evacuation (Quagliarini et al., 2016). Particularly, if the roads are assumed to be entirely blocked due to the overestimation of falling debris influence, the predicted evacuation process and total time will be significantly changed.
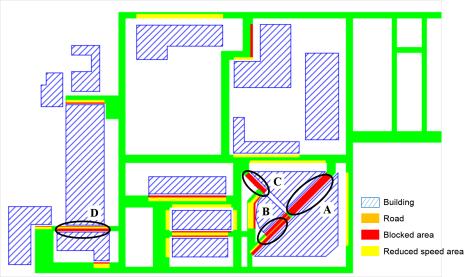
Therefore, it��s necessary to study the distribution of the falling debris of non-structural components under an earthquake, quantify the influence of debris on pedestrians�� velocity, investigate the evacuation process in the scenario with debris, and identify areas with high risk during the outdoor evacuation. In this work, a framework of regional evacuation simulation considering falling debris is proposed. Subsequently, the methodology to predict the distribution of falling debris of masonry infilled wall is proposed through experimental and numerical simulations. Furthermore, the influence of debris distribution on pedestrian movement is quantified through experiment. Finally, the teaching area in Tsinghua University campus is selected as a case to demonstrate the proposed frame herein, and post-earthquake evacuation simulation is conducted. The influence of falling debris on evacuation is analyzed, and roads with high risk are identified.
2 Methodology
2.1 Framework of pedestrian evacuation simulation
As shown in Figure 1, the proposed framework consists of four modules: (1) Database of regional buildings and roads; (2) Nonlinear time-history analysis of regional buildings; (3) Prediction of falling debris distribution; (4) Pedestrian evacuation simulation considering the influence of falling debris.
|
|
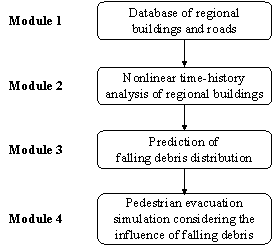
Figure 1 The proposed framework of pedestrian evacuation simulation
Module 1: Database of regional buildings and roads
GIS platform is employed to store and organize building and road information, which will provide the necessary data for seismic response analysis and evacuation scenario construction.
Module 2: Nonlinear time-history analysis of regional buildings
Nonlinear time-history analysis of regional buildings will provide the necessary data for the prediction of falling debris distribution. Multi-degree-of-freedom (MDOF) shear model and MDOF flexural-shear model proposed by Xiong et al. (2016, 2017) will be adopted due to their accuracy and efficiency. Time histories of the displacement and velocity on each story of each building are then obtained.
Module 3: Prediction of falling debris distribution
Nonstructural components such as masonry infilled walls will crack and induce falling debris when exceed their failure criteria (ASCE, 2010; Xu et al., 2016). The falling debris will collide the ground and jump to a certain range. The general finite element (FE) code LS-DYNA (LSTC, 2014) is chosen to simulate the movement of falling debris, based on which the distribution of debris can be predicted.
Module 4: Pedestrian evacuation simulation considering the influence of falling debris
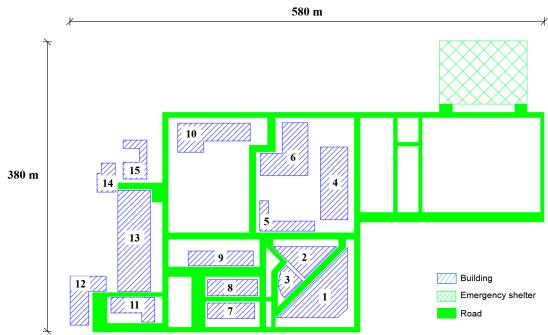
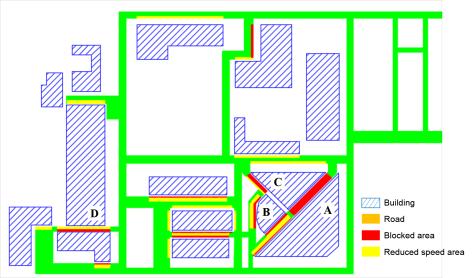
Based on the database in Module 1, the locations of buildings and emergency shelters, the road information and the population in each building can be determined. According to the results in Modules 2 and 3, regions covered by falling debris are established in the evacuation scenario. Considering the velocity reduction when people pass through the area covered by falling debris, social force model (Helbing & Molnar, 1995) is adopted to perform the pedestrian evacuation simulation.
Details of the above four modules are introduced one-by-one in the following sections.
2.2 Database of regional buildings and roads
Database of regional buildings and roads are the basis of building response analysis and evacuation scenario construction. Building information, road information, emergency shelter location and population distribution are contained in the database, which are stored and organized in a GIS platform. Here, a widely used commercial software ArcGIS is employed as the GIS platform (Dong et al., 2012; Karimzadeh et al., 2014; Lu et al., 2014). Attribute data of buildings such as building height, occupancy, number of stories, structural type, construction year, planar area can be obtained through city database (Xiong et al., 2015) or field investigation (Zeng et al., 2016). The location of buildings and emergency shelters, as well as the information of roads, can be obtained from various resources such as Google Map (Wu et al., 2007) or OpenStreetMap (Haklay & Patrick, 2008). Population in each building should also be confirmed during the evacuation simulation. FEMA P-58 provides the building population models, which define the number of people per 1000 square feet of building floor area with different occupancies (FEMA, 2012). Consequently, the population in each building can be predicted using FEMA P-58 and building attribute data.
2.3 Nonlinear time-history analysis of regional buildings
Nonlinear time-history analysis of regional buildings provides necessary data for falling debris distribution prediction. There are large amounts of buildings in an urban region, and detailed information like construction drawings is hard to acquire. Moreover, conventional FE analysis will result in an enormous workload, which isn��t applicable in urban seismic simulation. In order to overcome the aforementioned challenges and achieve satisfactory computational accuracy and efficiency, Xiong et al. (2016, 2017) proposed the nonlinear MDOF models (including the nonlinear MDOF shear model for multi-story frame structures and masonry structures, and the nonlinear MDOF flexural-shear model for tall buildings) to simulate the buildings in an urban region. Based on the corresponding design codes and massive experimental data, Xiong et al. (2016, 2017) proposed the methodology to determine the parameters of the nonlinear MDOF models, with which all parameters (e.g., inter-story stiffness, yield and peak strengths and drift ratios) in the nonlinear MDOF models can be determined by using attribute data of buildings in the GIS platform only (i.e. building height, number of stories, structural type, construction year, functionality and planar area). Subsequently, nonlinear MDOF models of regional buildings are established, and seismic response results (e.g., the time history results of the displacement and velocity on each story) can be obtained through nonlinear time-history analysis.
2.4 Prediction of falling debris distribution
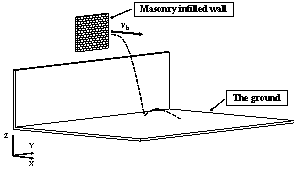
Masonry infilled walls are widely used as exterior building envelope. Previous seismic damage investigations indicated that: masonry infilled wall could be severely damaged during an earthquake (Dizhur et al., 2011; Miranda et al., 2012), and roads could be covered by the falling bricks of masonry infilled walls. Therefore, masonry infilled wall is selected in this work as a typical example to study the falling debris distribution. The prediction of falling debris distribution of infilled walls includes three parts: (1) Falling criteria of infilled walls; (2) Spatial motion of falling bricks; (3) Motion after hitting the ground and the final distribution of bricks.
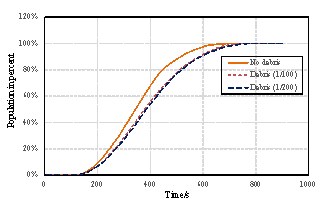
The nonlinear time-history analysis of each building in Module 2 will generate the time-history of drift ratios on each story. According to ASCE-07 (ASCE, 2010), the failure of masonry infilled walls is controlled by drift ratio. Existing studies found that the corresponding drift ratio limits of infilled wall failure range from 1/143 to 1/50 (ASCE, 2010). For example, Restrepo & Bersofskyb (2011) conducted quasi-static cyclic tests of 8 infilled walls, and the failure drift ratios ranged from 1/200 to 1/33. Belleri et al. (2016) investigated the seismic performance of cladding panels. The drift ratio when the cladding panels failed ranged from 1/100 to 1/48 due to the difference in connections. These works show that the drift ratio limit corresponding to infill wall failure has considerable deviation. Consequently, in this work, in order to consider the uncertainty of infill wall failure, two drift ratio limits (i.e. Dfall = 1/100, Dfall = 1/200) are selected for parametric discussion. The debris distribution and pedestrian evacuation subjected to these two limits are calculated, respectively. Infilled walls can be divided into two types: (1) thick walls and (2) flexible walls (Kaushik et al., 2006; Lee et al., 2007). Thick walls move simultaneously with the attached floor (Figure 2(a)), while the bricks of the flexible walls have different velocity time-histories from the floor (Figure 2(b)). Due to the thermal performance requirement, most Chinese buildings have thick envelop walls. Consequently, only thick walls are considered in this work. When the infilled wall fails, bricks are assumed to undergo a horizontal projectile motion (Xu et al., 2016). The initial velocity of the falling bricks equals to the floor velocity at the moment of failure.
|
|
|
|
(a) Thick walls |
(b) Flexible walls |
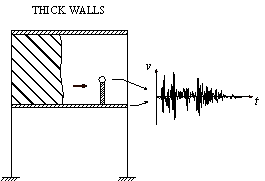
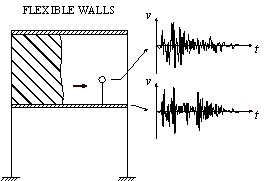
Figure 2 Simplified models of two types of infilled walls
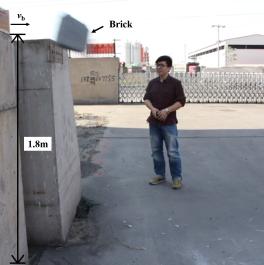
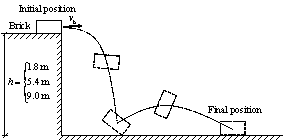
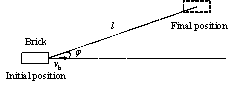
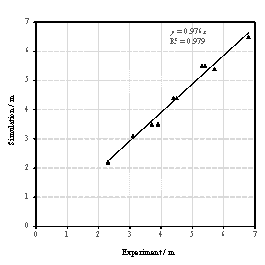
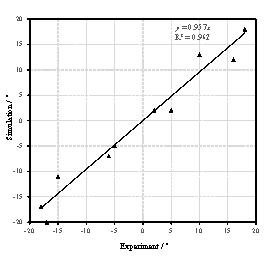
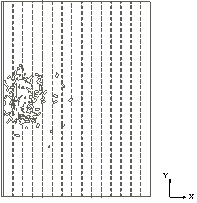
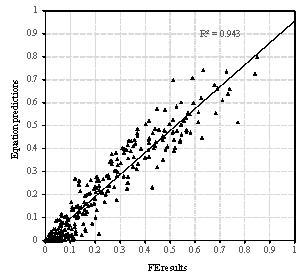
Note that when the bricks hit the ground, the bricks will jump again and move in a certain range. Therefore, the final positions of bricks are different from their first landing positions. Motions of the bricks after hitting the ground haven��t been considered or modeled in existing studies (Xu et al., 2016; Quagliarini et al., 2016). Hence, this work studied the motion of bricks after hitting the ground. Specifically, brick falling experiment was conducted first, in which bricks were thrown horizontally from three different heights, and the final positions of bricks were recorded. Next, the movements of bricks in the brick falling experiment were simulated using FE analysis to validate the reliability of the FE model and parameters in the FE analysis. After that, the falling behaviors of masonry infilled wall from different heights were repeatedly simulated with different initial horizontal velocities using the validated FE model. Finally, the percentages of areas covered by bricks on the ground were counted, and the models to prediction the falling debris distribution were obtained through regression. This methodology is one of key contributions of this study, which will be presented in detail in Section 3. Based on the nonlinear time-history results of buildings and the falling debris distribution models, the hazard ranges of debris and the percentage of the road surface covered by debris can then be predicted.
2.5 Pedestrian evacuation simulation considering the influence of falling debris
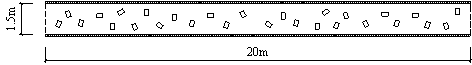
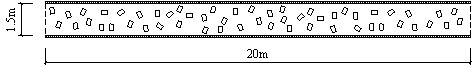
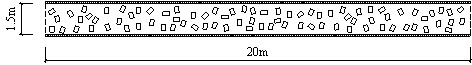
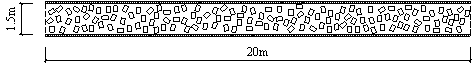
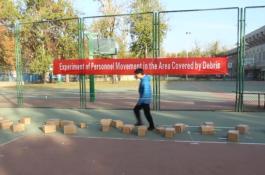
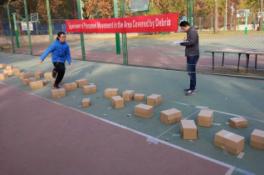
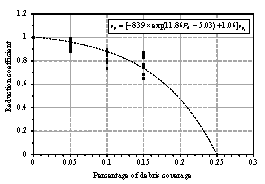
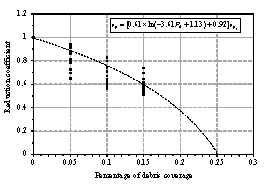
The pedestrian evacuation simulation considering the influence of falling debris consists of two parts: evacuation environment construction and human behavior modeling. Building locations, road information, emergency shelter locations and the number of people in the evacuation environment can be determined according to the database in Module 1, where debris distribution on the road can be determined according to Module 3. As for human behavior, cellular automaton, network model and social force model are the most widely used models in evacuation simulation (Duives et al., 2013). Social force model is a microscopic model, which is able to consider various crowd self-organization phenomena. This model has been well validated by real evacuation events (Johansson et al., 2008; Li et al., 2015). Consequently, it is widely employed in evacuation simulation (Parisi et al., 2009; Wan et al., 2014; Xiao et al., 2016). In this work, social force model is also adopted to conduct the evacuation simulation. The pedestrian evacuation scenario is generated in this work using the evacuation simulation software of Viswalk (Henningsson & Blomstrand, 2015; PTV, 2016). For areas without debris, pedestrians pass through with normal velocity. By contrast, for areas covered by debris, the velocity of pedestrians will change, which has a significant influence on the evacuation process. Some literature assumed that pedestrian can��t pass through the areas covered by debris (Liu et al., 2015; Cimellaro et al., 2017), which may overestimate the evacuation time. In order to investigate the influence of falling debris on the pedestrian velocity, pedestrian movement experiment with different percentages of debris coverage were designed in this work, in which four scenarios were set (i.e., debris coverage percentages are 0%, 5%, 10% and 15%, respectively). The time of pedestrian needed to pass through the debris-covered area was recorded. The relationship between pedestrian velocity and the percentage of debris coverage were determined through data fitting. The pedestrian movement experiment will be introduced in detail in Section 4.
The influence of the percentage of debris coverage on the pedestrian velocity will be inputted to the pedestrian evacuation software Viswalk. Specifically, the lanes of roads that are covered by debris have smaller maximum pedestrian velocity than the lanes free from falling debris. Evacuation scenario is then established and pedestrian evacuation simulation can be conducted.