1. Introduction
Reinforced concrete (RC) frameĘCshear wall structures are extensively used in urban areas for office and residential buildings. Sheltering numerous city functionalities and a large number of people, RC frameĘCshear wall structures in urban areas play an important role.
RC frameĘCshear wall structures typically exhibit a good collapse prevention performance [1], but the seismic damages of such structures can still cause severe economic losses. For example, in the 2011 Christchurch Earthquake, a number of RC frameĘCshear wall buildings were severely damaged. Because the damages of shear wall components are very difficult to repair, numerous buildings were demolished, resulting in considerable direct and indirect losses to the area [2,3].
The performance-based [4] and resilience-based [5] seismic designs of RC frameĘCshear wall structures are effective measures for addressing the aforementioned problems, and both of the methods rely on an accurate seismic damage assessment of shear wall components. The seismic damage assessment method of shear wall components mainly involves two parts, namely, (1) engineering demand parameter (EDP) calculation and (2) damage limit determination. The details of these two parts are presented in the following.
(1) EDP calculation
The EDPs adopted for the damage assessment of shear wall components mainly have three categories, namely, material-, component-, and story-level EDPs.
The material strain is a common material-level EDP for damage assessment of shear wall panels. The strain of different materials can be obtained from the numerical simulations of refined finite element (FE) models or experimental measurements. Using the material-level EDP is a straightforward approach, and the EDP can clearly reflect the damage of the corresponding material. For example, Yang et al. [6] conducted a damage assessment for a 42-story high-rise building, in which the compressive strain was adopted as an EDP to assess the damage state of shear wall boundary elements. However, owing to the different strains in various parts of the shear wall panel, determining the damage states of a specific story based on the strains is not easy.
ASCE 41 [7] recommended two component-level EDPs for the damage assessment of shear walls. The first one is the demand capacity ratio (DCR) and the second one is the plastic hinge rotation. The DCR is defined as the ratio of the component demand to the component strength. Yang et al. [6] adopted the maximum shear DCR as the EDP to assess the shear wall of a 42-story building. Birely [8] also utilized the DCR values of shear, moment, and axial demand to assess the damage states of four high-rise buildings. However, the DCR is often calculated on the basis of the action demands from a linear static procedure (LSP) or linear dynamic procedure (LDP), which cannot capture the nonlinear behavior of shear walls. The plastic hinge rotation is also recommended in ASCE 41 [7] as the component-level EDP. ASCE 41 [7] specified the computational method and the damage limits for the plastic hinge rotation at the bottom of the shear wall, but the damages at the upper part of the shear wall panel cannot be considered. Note that owing to the significant contribution of high-order vibration modes of tall buildings, damages located at the upper parts of tall buildings were frequently observed in numerical simulations [1].
Story-level EDPs are simple and are extensively used for the seismic damage assessment of individual and urban buildings [8-14]. The data required to compute the story-level EDP can be easily obtained from numerical simulations or structural health monitoring.
One of the most frequently used story-level EDPs is the inter-story drift ratio (IDR). The IDR can be used to determine the story-level damages of multi-story buildings that exhibit shear deformation modes. However, it is inappropriate for the damage assessments of shear wall components of high-rise buildings because the responses of these buildings follow a flexuralĘCshear deformation mode, and a large proportion of the IDR at the upper story is contributed by the rigid-body rotation [15]. To address this problem, a new story-level EDP, called inter-story pure translation ratio (ISPT), is presented by Ji et al. [15], as shown in Eq. 1.
![]() (1)
(1)
where Hn is the height of the nth story; dxn and dyn are the horizontal/vertical inter-story displacements, respectively; and q1 is the bottom rotation of the nth story.
The ISPT can effectively remove the rigid-body rotation and is reliable for the damage assessment of shear wall components. It has also been adopted by Alwaeli et al. [16] to assess the seismic damage of RC high-rise wall buildings.
In the seismic damage assessment method of FEMA P58 [4], the effective drift ratio is adopted as the EDP of the slender concrete shear walls. The effective drift ratio is defined as the ratio of the lateral drift at the effective height to the effective height. The effect height of a shear wall can be calculated as the ratio of the base moment to the base shear. The fragility data of the slender concrete shear walls are also provided in the FEMA P58 fragility database, which can be used to assess the damages of the concrete shear walls reliably.
(2) Damage limit determination
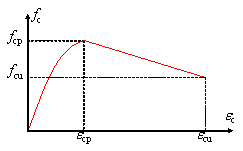
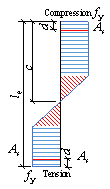
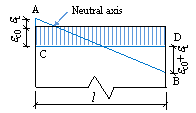
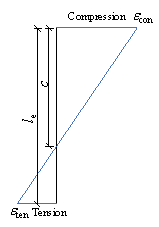
The drift ratio (DR) results of shear wall experiments, defined as shown in Fig. 1 and Eq. 2, are typically used as the basis to determine the damage limits of shear wall components [4]. Notably, directly using the DR limits of shear wall specimens as the IDR criteria for buildings is sometimes inappropriate. The reason is that the aspect ratio of a slender shear wall specimen often differs from the story height to shear wall length ratio, as shown in Fig. 1. Therefore, the DR of a shear wall specimen is not equivalent to the IDR of a building, as expressed by Eqs. 2 and 3, respectively.
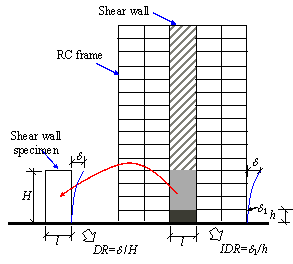
Fig. 1. Comparison of DR and IDR
![]() (2)
(2)
![]() (3)
(3)
where d is the top displacement of the shear wall specimen, d1 is the inter-story displacement, H is the height of the shear wall specimen, and h is the story height.
Moreover, the damage limits of shear walls are influenced by axial load ratio, material properties, length of the shear wall, etc. According to the statistical results of shear wall experiments, the maximum DR limit of a specific damage state for different shear wall specimens can be up to 10 times higher than the minimum one [8]. Therefore, the statistical results of damage limits for specimens with various design parameters can be extremely dispersed. Consequently, assessing the damage states of a shear wall component by using the dispersed damage limits can lead to unreliable results [17,18].
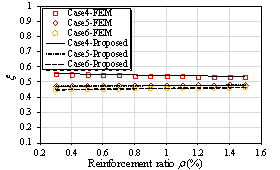
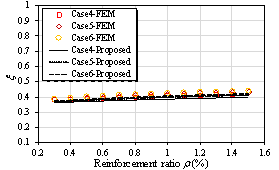
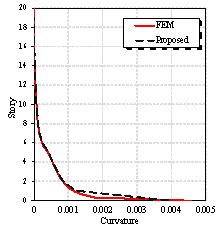
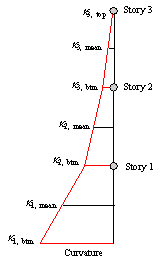
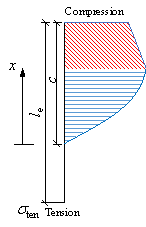
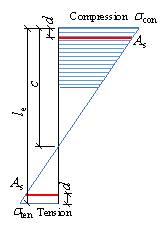
Although shear failure or flexure-shear failure can be observed in shear walls in certain cases [19], most shear wall components are expected to fail in flexure, because the shear strength of a shear wall is guaranteed according to the capacity design principle of shear wall components [20]. Therefore, the method proposed in this study mainly focuses on assessing the flexural damage of shear walls. Note that the flexural failure is strongly related to the component curvature [21]. The curvature distribution in shear wall components is adopted to estimate the damage state at different story levels of a shear wall component. Specifically, the maximum curvature within each story level is adopted as the story curvature EDP in this study to assess the story-level seismic damage of the shear wall components, and the proposed method can be very useful when it is applied in simplified nonlinear methodologies for building seismic performance assessment [22].
The method proposed in this study is characterized by the following features: (1) the proposed method can consider the damage in the middle region of a shear wall, caused by higher-order building vibration. However, certain conventional methods, for example, the method that adopts the effective drift ratio as the EDP, can only consider the damage at the bottom of shear walls, induced by first-order building vibration. (2) The proposed method can estimate the shear wall damage at all story levels, which facilitates the future repair time and repair cost simulation [4]. (3) The damage limit determination method presented in this study can make full use of the key design parameters of a shear wall, thereby yielding more reliable damage limits.
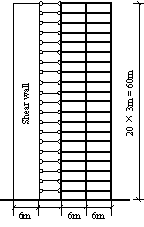
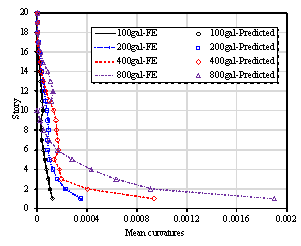
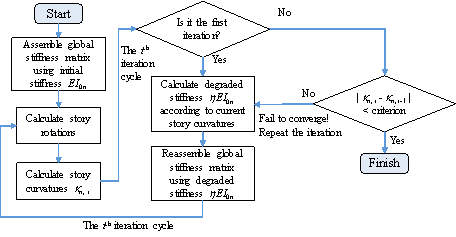
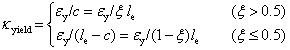
In particular, a story curvature calculation method is proposed in Section 2. Based on the piecewise linear assumption of the curvature distribution, the story curvature can be obtained with story drifts and several shear wall key design parameters as inputs, which is best suited to cases in which shear wall rotation distribution data are difficult to obtain (for example, structural health monitoring). A damage limit determination method is presented in Section 3. Based on the plane cross-sectional assumption and sectional analysis, the method can consider the influences of the axial load ratio, shear wall length, and material information, thereby yielding more accurate damage limits. In Section 4, the proposed methods are validated by means of comparison with the numerical results obtained from several shear wall panels and from a shear wall structure. Furthermore, the effectiveness of the method is demonstrated by means of comparison with the damage assessment method of FEMA P58 in Section 4.2. The methods are further validated by comparison with the experimental results obtained from six shear wall specimens as well as the shaking table test results of a seven-story shear wall building. The outcomes of this work are expected to provide a useful reference for performance-based [4] and resilience-based [5] seismic design in the cases of RC frameĘCshear wall structures.
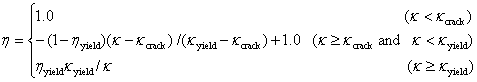
 (4)
(4) (5)
(5)
 (9)
(9)
 (16)
(16)