8. Conclusions
Based on a typical case study of a core-tube frame structure Building 2A provided by PEER (Moehle et al., 2011), Building 2N is generated through a redesign process according to the Chinese seismic design code. The design procedures of these two buildings and their seismic performances under different earthquake intensities are compared and evaluated in some detail. The study indicates that the seismic design forces determined by the Chinese response spectrum are larger than the US counterparts at the same seismic hazard level. In addition, a higher requirement for the inter-story drift ratio is specified by the Chinese code, thereby resulting in larger seismic design forces. These two aspects together have led to a higher level of material consumption for Building 2N than Building 2A. Nonetheless, the global level performance assessment, including the story drift ratio and plastic hinge distribution, indicates that the two designs exhibit approximately similar structural performances under different levels of earthquakes. The comparison at the component level indicates that Building 2N has stronger columns and core walls, but weaker beams and coupling beams.
Acknowledgements
The authors are grateful for the financial support received from the National Natural Science Foundation of China (No. 51222804, 51261120377), the National Key Technology R&D Program (No. 2013BAJ08B02) and the Beijing Natural Science Foundation (No. 8142024).
References
ACI. 2008. Building code requirements for structural concrete and commentary (ACI 318-08): American Concrete Institute.
ASCE. 2005. Minimum design loads for buildings and other structures (ASCE/SEI 7-05): American Society of Civil Engineers.
Bai ZZ, Au FTK. 2013a. Flexural ductility design of high-strength concrete columns. The Structural Design of Tall and Special Buildings 22(1): 92-115.
Bai ZZ, Au FTK. 2013b. Flexural ductility design of high-strength concrete beams. The Structural Design of Tall and Special Buildings 22(1): 521-542.
CABR. 2010. User guide documentation of PKPM Software: China Academy of Building Research, Beijing, China. (in Chinese)
Chen MK. 2003. Suitable height of flat plate-shear wall structure in seismic zone. Journal of Building Structures 24(1): 1-6. (in Chinese)
CMC. 2010a. Code for Seismic Design of Buildings (GB50011-2010). China Ministry of Construction, China Architecture and Building Press: Beijing, China. (in Chinese)
CMC. 2010b. Technical Specification for Concrete Structures of Tall Building (JGJ3-2010). China Ministry of Construction, China Architecture and Building Press: Beijing, China. (in Chinese)
CMC. 2010c. Code for Design of Concrete Structures (GB50010-2010). China Ministry of Construction, China Architecture and Building Press: Beijing, China. (in Chinese)
Dong P. 2011. Research needs for use of capacity design of RC frame structures in China. Advances in Structural Engineering 14(5): 891-902.
Duan H, Hueste MBD. 2012. Seismic performance of a reinforced concrete frame building in China. Engineering Structures 41: 77-89.
Guan N. 2012. Comparison of load combination between Chinese and American standards. Engineering Journal of Wuhan University 45(Sup): 343-346. (in Chinese)
ICC. 2006. International Building Code (IBC 2006): International Code Council.
Khaleel GI, Shaaban IG, Elsayedand KM, Makhlouf MH. 2013. Strengthening of reinforced concrete slab-column connection subjected to punching shear with FRP systems. International Journal of Engineering and Technology 5(6): 657-661.
LATBSDC. 2008. An alternative procedure for seismic analysis and design of tall buildings located in the Los Angeles region: Los Angeles Tall Buildings Structural Design Council.
Luo KH, Wang YY. 2004. Comparison of regulations of earthquake loads and seismic design: GB 50011-2001-IBC-2003. Proceedings of the 3rd International Conference on Earthquake Engineering: New Frontier and Research Transformation, Nanjing, China.
Luo KH, Wang YY. 2006. Research on conversion relationships among the parameters of ground motions in seismic design codes of China, America and Europe. Building Structure 36(8): 103-107. (in Chinese)
Moehle J, Bozorgnia Y, Jayaram N et al. 2011. Case studies of the seismic performance of tall buildings designed by alternative means: Pacific Earthquake Engineering Research Center.
Rha C, Kang THK, Shin M, Yoon JB. 2014. Gravity and lateral load-carrying capacities of reinforced concrete flat plate systems. ACI Structural Journal 111(4): 753-764.
Ruiz MF, Mirzaei Y, Muttoni A. 2013. Post-punching behavior of flat slabs. ACI Structural Journal 110(5): 801-812.
Smith R. 2011. Deflection limits in tall buildings - Are they useful? Proceedings of the 2011 Structures Congress, Las Vegas, Nevada.
Song C, Zheng HJ. 2012. Introduction to ASCE7 seismic design and the comparison with Chinese code GB 50011-2010. Applied Mechanics and Materials 238: 881-885.
Sun YP, Zhao SC, Ye LP. 2011. Comparative study of seismic design method for reinforced concrete structures in China and Japan. Building Structure 41(5): 13-19. (in Chinese)
Tang BX, Ye LP, Lu XZ, Sun YP. 2013. Comparison of the seismic performances of reinforced concrete frame structures designed according to the seismic codes in China and Japan. Journal of Yangzhou University (Natural Science Edition) 16(4): 64-69. (in Chinese)
Yang TY, Hurtato G, Moehle JP. 2010. Seismic modeling and behavior of gravity frames in high-rise building. Proceeding of 9th National Conference on Earthquake Engineering, Toronto, Canada.
Yi WJ, Zhang FZ, Kunnath SK. 2014. Progressive collapse performance of RC flat plate frame structures. Journal of Structural Engineering 140(9).
Zhang WY, Christopoulos C. 2011. A discussion on some key issues for seismic design of concentrically braced frames according to Canadian and Chinese codes. Advanced Materials Research 163: 211-221.
Zhao ZH, Jiang ZN. 2012. Comparison of base shear force method in the seismic design codes of China, America and Europe. Applied Mechanics and Materials 166: 2345-2352.
Zhou J, Fang XD. 2012. Comparison of near-fault effect considered in seismic design codes for building. Advanced Materials Research 378: 270-273.
Zhuang XT, Li SM. 2006. Calculational comparison of reinforcement between Chinese concrete code and US concrete code. Sichuan Building Science 32(2): 72-75. (in Chinese)
List of Tables
Table 1 Seismic design parameters used for Building 2A (Moehle et al., 2011)
Table 2 Vertical design load (Moehle et al., 2011) for both buildings
Table 3 The effective seismic weight and design periods
Table 4 The material properties and dimensions of the main structural members in Buildings 2A and 2N
Table 5 Material properties and dimensions for the main structural members in Building 2N
Table 6 Peak values of component level responses in Buildings 2A and 2N
List of Figures
Figure 1 3D view and typical floor plan of Buildings 2A and 2N (units: mm)
Figure 2 Comparison between the site-specific MCE spectrum and Chinese response spectra
Figure 3 The design lateral forces and seismic response coefficients in Buildings 2A and 2N
Figure 4 The design story drift ratio of Buildings 2A and 2N
Figure 5 The material consumptions in Buildings 2A and 2N
Figure 6 Base shear force-displacement relationships of Buildings 2A and 2N
Figure 7 Displacement responses of Buildings 2A and 2N
Figure 8 Plastic hinge distribution of Buildings 2A and 2N subjected to CHICHI_CHY101-N (PGA=510 gal)
Table 1 Seismic design parameters used for Building 2A (Moehle et al., 2011)
|
Ss |
1.725 g |
|
Sl |
0.602 g |
|
Fa |
1 |
|
Fv |
1.3 |
|
SMS |
1.718 g |
|
SMl |
0.782 g |
|
SDS |
1.145 g |
|
SDl |
0.521 g |
|
R |
7.0 |
|
Site Class |
C |
|
Cd |
5.5 |
|
Cs |
0.051 |
|
Seismic weight (W) |
45372 kN |
|
Modal combination method |
Complete quadratic combination (CQC) |
|
Redundancy factor (r) |
1.0 |
|
Accidental eccentricity |
5% |
|
Base shear ˇ°Vˇ± (See section 12.8 in ASCE 7-05) |
23140 kN |
|
Modal Base shear ˇ°Vtˇ± (See section 12.9.2 in ASCE 7-05) |
Vtx=50870/R=7267 kN |
|
Vty=52311/R=7473 kN |
|
|
Modal base shear scaled to match 0.85V |
0.85ˇÁ23140=19669 kN |
Table 2 Vertical design load (Moehle et al., 2011) for both buildings
|
Application |
Location |
Superimposed dead load (units: kN/m2) |
Live load (units: kN/m2) |
|
Parking |
4 stories below ground |
0.1435 |
2.392 |
|
Retail |
Ground level inside area |
5.263 |
4.785 |
|
Cladding |
Tower perimeter |
0.7177 |
0 |
|
Outside plaza |
Ground level outside area |
16.747 |
4.785 |
|
Corridors and exit areas |
Inside elevator core |
1.340 |
4.785 |
|
Residential |
2nd-42nd floor |
1.340 |
1.914 |
|
Mechanical |
At roof floor only |
444.528 kN |
1.196 |
|
Roof |
Roof floor |
1.340 |
0.9569 |
Table 3 The effective seismic weight and design periods
|
Building 2N |
Building 2A (Moehle et al., 2011) |
|||
|
Effective seismic weight (units: ton) |
57,306.0 |
46298.0 |
||
|
Period (units: s) |
T1 |
2.565 |
4.456 |
Translation mode in the X direction |
|
T2 |
2.383 |
4.026 |
Translation mode in the Y direction |
|
|
T3 |
1.992 |
2.478 |
Torsion mode |
|
|
Note: The X and Y directions of Buildings 2N and 2A are illustrated in Figure 1. |
||||
Table 4 The material properties and dimensions of the main structural members in Buildings 2A and 2N
|
Building 2A (Moehle et al., 2011) |
Building 2N |
|||
|
Beams |
Material property (units: MPa) |
Specified strength |
34.5 |
26.8 |
|
Expected strength |
44.8 |
36.1 |
||
|
Dimension (units: mm) |
762ˇÁ914 |
250ˇÁ500, 450ˇÁ900 |
||
|
Columns |
Material property (units: MPa) |
Specified strength |
34.5, 41.4, 55.2, 69.0 |
26.8, 32.4, 38.5 |
|
Expected strength |
44.8, 53.8, 71.7, 89.6 |
36.1, 42.9, 50.1 |
||
|
Dimension (units: mm) |
1170ˇÁ1170 - 915ˇÁ915 |
1500ˇÁ1500 - 800ˇÁ800 |
||
|
Shear walls |
Material property (units: MPa) |
Specified strength |
34.5, 41.4 |
26.8, 32.4, 38.5 |
|
Expected strength |
44.8, 53.8 |
36.1, 42.9, 50.1 |
||
|
Thickness (units: mm) |
610, 460 |
400 - 600 |
||
Table 5 Material properties and dimensions for the main structural members in Building 2N
|
Element |
Member location (Figure 1b) |
Floor |
Specified strength of concrete |
Dimension (units: mm) |
|
Slabs |
All positions of 1st-41th floor and inside core tube of 42nd floor |
36.1 |
140 |
|
|
Outside core tube of 42nd floor and all positions of 43rd floor |
36.1 |
150 |
||
|
Moment Frame beams |
Beam 1 |
All floors |
36.1 |
250ˇÁ500 |
|
All Beams except Beam 1 |
All floors |
36.1 |
450ˇÁ900 |
|
|
Moment Frame Columns |
Column 1 |
1st-10th floor |
50.1 |
1500ˇÁ1500 |
|
11th-20th floor |
50.1 |
1300ˇÁ1300 |
||
|
21st-30th floor |
42.9 |
1200ˇÁ1200 |
||
|
31st-42nd floor |
36.1 |
1000ˇÁ1000 |
||
|
Column 2 |
1st-10th floor |
50.1 |
1300ˇÁ1300 |
|
|
11th-20th floor |
50.1 |
1200ˇÁ1200 |
||
|
21st-30th floor |
42.9 |
1100ˇÁ1100 |
||
|
31st-42nd floor |
36.1 |
900ˇÁ900 |
||
|
Column 3 |
1st-10th floor |
50.1 |
1100ˇÁ1100 |
|
|
11th-20th floor |
50.1 |
1000ˇÁ1000 |
||
|
21st-30th floor |
42.9 |
900ˇÁ900 |
||
|
31st-42nd floor |
36.1 |
800ˇÁ800 |
||
|
Core Walls |
Internal walls in the X direction |
1st-10th floor |
50.1 |
470 |
|
11th-20th floor |
50.1 |
400 |
||
|
21st-30th floor |
42.9 |
400 |
||
|
31st-42nd floor |
36.1 |
400 |
||
|
External walls in the X direction |
1st-20th floor |
50.1 |
600 |
|
|
21st-30th floor |
42.9 |
600 |
||
|
31st-43rd floor |
36.1 |
500 |
||
|
All walls in the Y direction |
1st-10th floor |
50.1 |
550 |
|
|
11th-20th floor |
50.1 |
450 |
||
|
21st-30th floor |
42.9 |
400 |
||
|
31st-43rd floor |
36.1 |
400 |
||
|
Coupling Beams |
Same as core walls |
Same as core walls |
Same as core walls |
600 in depth |
|
Note: All reinforcement consists of HRB400 reinforcing bar, whose specified strength is 400 MPa and expected strength 455.7 MPa. |
||||
Table 6 Peak values of component level responses in Buildings 2A and 2N
|
Beam rotation (units: rad) |
Normalized column axial force |
Column rotation (units: rad) |
Core wall compression strain |
Coupling beam rotation (units: rad) |
|
|
Building 2A |
0.012 |
0.80 |
0.0043 |
0.0018 |
0.019 |
|
Building 2N |
0.016 |
0.55 |
0.0045 |
0.0011 |
0.025 |
Note: The normalized column axial force represents the column axial force which is normalized by Agfc, where Ag is the column cross sectional area and fc the expected concrete strength.
|
|
|
|
(a) Building 2A (Moehle et al., 2011) |
(b) Building 2N |
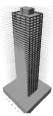
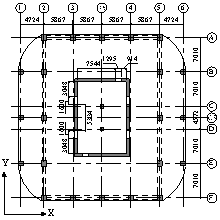
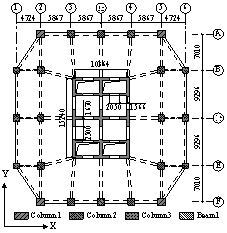
Figure 1 3D view and typical floor plan of Buildings 2A and 2N (units: mm)
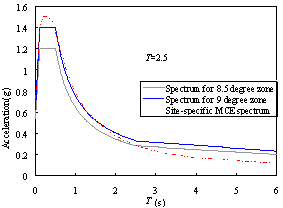
Figure 2 Comparison between the site-specific MCE spectrum and Chinese response spectra
|
|
|
|
(a) Design lateral force |
(b) Seismic response coefficient |
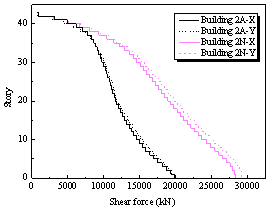
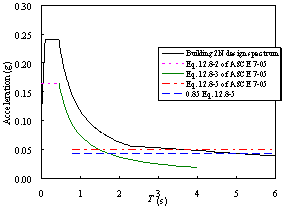
Figure 3 The design lateral forces and seismic response coefficients in Buildings 2A and 2N
|
|
|
|
(a) The design story drift ratio of Building 2N |
(b) The design story drift ratio of Building 2A (Moehle et al., 2011) |
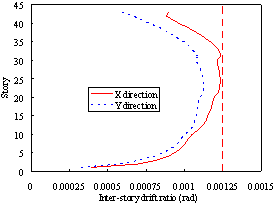
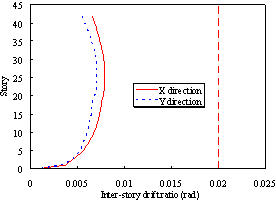
Figure 4 The design story drift ratio of Buildings 2A and 2N
|
|
|
|
(a) Concrete (ˇÁ103 m3) |
(b) Reinforcement steel (ˇÁ103 ton) |
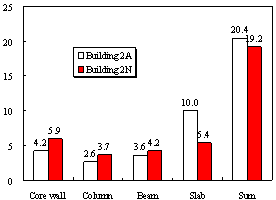
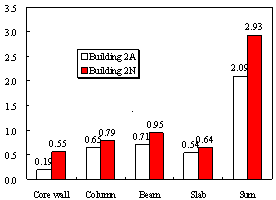
Figure 5 The material consumptions in Buildings 2A and 2N
|
|
|
|
(a) Pushover capacity curves of Buildings 2N and 2A |
|
|
|
|
|
(b) Base shear distribution of Building 2N |
(c) Base shear distribution of Building 2A |
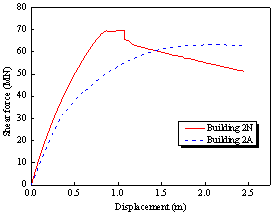
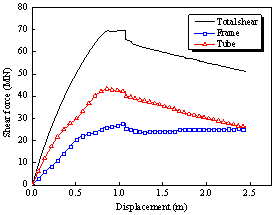
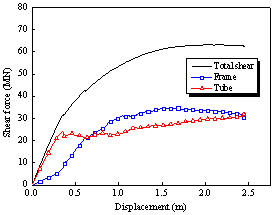
Figure 6 Base shear force-displacement relationships of Buildings 2A and 2N
|
|
|
|
(a) Story displacement under frequent earthquakes (PGA = 110 gal) |
(b) Story drift ratio under frequent earthquakes (PGA = 110 gal) |
|
|
|
|
(c) Story displacement under fortification level earthquakes (PGA = 300 gal) |
(d) Story drift ratio under fortification level earthquakes (PGA = 300 gal) |
|
|
|
|
(e) Story displacement under severe earthquakes (PGA = 510 gal) |
(f) Story drift ratio under severe earthquakes (PGA = 510 gal) |
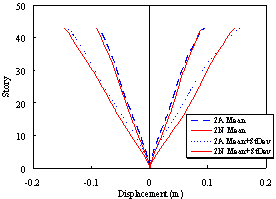
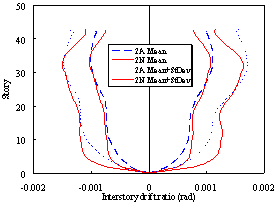
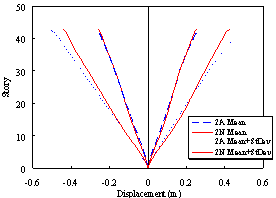
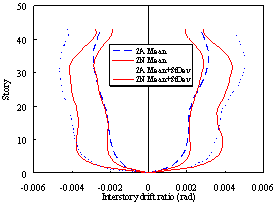
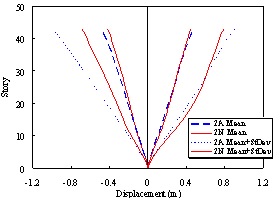
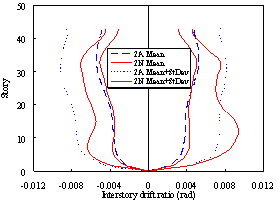
Figure 7 Displacement responses of Buildings 2A and 2N
|
|
|
|
(a) Building 2A |
(b) Building 2N |
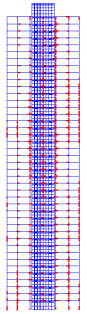
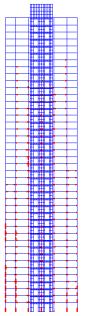
Figure 8 Plastic hinge distribution of Buildings 2A and 2N subjected to CHICHI_CHY101-N (PGA=510 gal)