Acknowledgements
The authors are grateful
for the financial support received from the National Key Technology R&D
Program (No. 2015BAK14B02), the National Natural Science Foundation of China
(No. 51578320, 51308321), and National Non-profit Institute Research Grant
of IGP-CEA (Grant No: DQJB14C01).
References:
American Red Cross (ARC) (2002) Standards for hurricane evacuation shelter selection,
ARC 4496. Washington, DC
American Society of Civil Engineers (ASCE) (2010) Minimum design loads for buildings
and other structures, ASCE 7�C10. Reston, VA
Antoniou S, Pinho R (2004) Advantages and limitations of adaptive and non-adaptive
force-based pushover procedures. J Earthq Eng 8:497�C522
Azarbakht A, Dolšek M (2007) Prediction of the median IDA curve by employing
a limited number of ground motion records. Earthq Eng Struct D 36(15): 2401�C2421
Behr RA (1998) Seismic performance of architectural glass in mid-rise curtain
wall. Journal of Architectural Engineering�CASCE 4:94�C98
Braga F, Manfredi V, Masi A, Salvatori A, Vona M (2011) Performance of non-structural
elements in RC buildings during the L��Aquila, 2009 earthquake. Bull Earthq
Eng 9:307�C324
CECS127 (2001) Technical specification for point supported glass curtain wall.
China Association for Engineering Construction Standardization, Beijing (In
Chinese)
Chan YF, Alagappan K, Gandhi A, Donovan C, Tewari M, Zaets SB (2006) Disaster
management following the Chi-Chi Earthquake in Taiwan. Prehospital and Disaster
Medicine 21:196�C202
Construction Standardization Information Network (CCSN) (2014) Design code for
urban disasters emergency shelter (for public comment). http://www.ccsn.gov.cn/
(In Chinese)
Ellidokuz H, Ucku R, Aydin UY, Ellidokuz E (2005) Risk Factors for Death and
Injuries in Earthquake: Cross-sectional Study from Afyon, Turkey. Croat Med
J 46:613�C618
Federal Emergency Management Agency (FEMA) (2008) Design and construction guidance
for community safe rooms, FEMA P361. Washington, DC
Federal Emergency Management Agency (FEMA) (2009) Quantification of building
seismic performance factors, FEMA P695. Washington DC
Federal Emergency Management Agency (FEMA) (2012) Multi-hazard loss estimation
methodology HAZUS�CMH 2.1 advanced engineering building module (AEBM) technical
and user��s manual. Washington, DC
Ferracuti B, Pinho R, Savoia M, Francia R (2009) Verification of displacement-based
adaptive pushover through multi-ground motion incremental dynamic analyses.
Eng Struct 31:1789�C1799
GB21734 (2008) Emergency shelter for earthquake disasters�Csite and its facilities.
Standards Press of China, Beijing (In Chinese)
GB50011 (2010) Code for seismic design of building. China Architecture Industry
Press, Beijing (In Chinese)
GB50413 (2007) Standard for urban planning on earthquake resistance and hazardous
prevention. China Architecture Industry Press, Beijing (In Chinese)
Goulet CA, Haselton CB, Mitrani-Reiser J, Beck JL, Deierlein GG, Porter KA,
et al. (2007) Evaluation of the seismic performance of a code-conforming reinforced-concrete
frame building�Cfrom seismic hazard to collapse safety and economic losses.
Earthq Eng Struct D 36:1973�C1997
Hamada M, Aydan O, Sakamoto A (2007) A quick report on Noto Peninsula Earthquake
on March 25, 2007, Japan Society of Civil Engineers Report. Tokyo
Iervolino I, Cornell CA (2005) Record selection for nonlinear seismic analysis
of structures. Earthq Spectra 21:685�C713
Iervolino I, Manfredi G, Cosenza E (2006) Ground motion duration effects on
nonlinear seismic response. Earthq Eng Struct D 35:21�C38
Iervolino I, Galasso C, Cosenza E (2010) REXEL: computer aided record selection
for code-based seismic structural analysis. Bull Earthq Eng 8:339�C362
International Code Council (ICC) (2009) International Building Code. Country
Club Hills, IL
JGJ102 (2003) Technical code for glass curtain wall engineering. China Architecture
Industry Press, Beijing (In Chinese)
JGJ133 (2001) Technical code for metal and stone curtain walls engineering.
China Architecture Industry Press, Beijing (In Chinese)
Johnston D, Standring S, Ronan K, Lindell M, Wilson T, Cousins J, et al. (2014)
The 2010/2011 Canterbury earthquakes: context and cause of injury. Nat Hazards
73(2): 627�C637
Kaisera A, Holden C, Beavan J, Beetham D, Benites R, Celentano A, et al. (2012)
The Mw 6.2 Christchurch earthquake of February 2011: preliminary report. New
Zealand Journal of Geology and Geophysics 55(1): 67�C90
Katsanos EI, Sextos AG, Manolis GD (2010) Selection of earthquake ground motion
records: A state-of-the-art review from a structural engineering perspective.
Soil Dyn Earthq Eng 30:157�C169
Li
Y, Lu XZ, Guan H, Ye LP (2014a) An energy-based assessment on dynamic amplification
factor for linear static analysis in progressive collapse design of ductile
RC frame structures. Adv Struct Eng 17:1217�C1225
Li Y, Lu XZ,
Guan H, Ye LP (2014b) Progressive collapse resistance demand of RC frames
under catenary mechanism, ACI Structural Journal, 111 (5): 1225�C1234
Lu
X, Lu XZ, Guan H, Ye LP (2013a) Collapse simulation of reinforced concrete
high-rise building induced by extreme earthquakes. Earthq Eng Struct D 42:705�C723
Lu X, Lu
XZ, Guan H, Ye LP (2013b) Comparison and selection of ground motion intensity
measures for seismic design of super high-rise buildings. Adv Struct Eng 16(7):
1249�C1262
Lu X, Ye LP, Lu XZ, Li MK,
Ma XW (2013c) An improved ground motion intensity measure for super high-rise
buildings. Sci China Technol Sc 56(6): 1525�C1533
Lu
XZ, Han B, Hori M, Xiong C, Xu Z (2014) A coarse-grained parallel approach
for seismic damage simulations of urban areas based on refined models and
GPU/CPU cooperative computing. Adv Eng Softw 70: 90�C103
Ma YH, Xie LL (2002) Determination of frequently occurred and seldom occurred
earthquakes in consideration of earthquake environment. Journal of Building
Structures 23:43�C47 (In Chinese)
Mahdavinejad M, Bemanian M, Abolvardi G, Elhamian SM (2012) Analyzing the state
of seismic consideration of architectural non-structural components (ANSCs)
in design process (based on IBC). International Journal of Disaster Resilience
in the Built Environment 3:133�C147
McLaren TM, Myers JD, Lee JS, Tolbert NL, Hampton SD, Navarro CM (2008) MAEviz:
an earthquake risk assessment system. In: Proceedings of the 16th ACM SIGSPATIAL
International Conference on Advances in Geographic Information Systems, ACM
New York, pp 88
Memari AM, Behr RA, Kremer PA (2003) Seismic behavior of curtain walls containing
insulating glass units. Journal of Architectural Engineering�CASCE 9:70�C85
Mwafy AM, Elnashai AS (2001) Static pushover versus dynamic collapse analysis
of RC buildings. Eng Struct 23:407�C424
Pacific Earthquake Engineering Research Center (PEER) (2014) Preliminary notes
and observations on the August 24, 2014, South Napa Earthquake, Report No.
2014/13. University of California, Berkeley
Padgett J, Desroches R (2007) Sensitivity of seismic response and fragility
to parameter uncertainty. J Struct Eng-ASCE 133:1710�C8
Peek-Asa C, Kraus JF, Bourque LB, Vimalachandra D, Yu J, Abrams J (1998) Fatal
and hospitalized injuries resulting from the 1994 Northridge earthquake. Int
J Epidemiol 27:459�C465
Qiu J, Liu G, Wang S, Zhang X, Zhang L, Li Y, et al. (2010) Analysis of injuries
and treatment of 3 401 inpatients in 2008 Wenchuan earthquake based on Chinese
Trauma Databank. Chinese Journal of Traumatology (English Edition) 13:297�C303
Roy N, Shah H, Patel V, Coughlin RR (2002) The Gujarat earthquake (2001) experience
in a seismically unprepared area: community hospital medical response. Prehospital
and Disaster Medicine 17:186�C95
Shi W, Lu XZ, Guan H, Ye LP
(2014) Development of seismic collapse capacity spectra and parametric study.
Adv Struct Eng 17:1241�C1256
Shi
W, Lu XZ, Ye LP (2012) Uniform-risk-targeted seismic design for collapse safety
of building structures. Sci China Technol Sc 55:1481�C1488
Sucuoǧlu H, Vallabhan CV (1997) Behaviour of window glass panels during
earthquakes. Eng Struct 19:685�C694
Tothong P, Luco N (2007) Probabilistic seismic demand analysis using advanced
ground motion intensity measures. Earthq Eng Struct D 36:1837�C1860
Villaverde R (2007) Methods to assess the seismic collapse capacity of building
structures: State of the art. J Struct Eng-ASCE 133:57�C66
Xu Z, Lu XZ,
Guan H, Han B, Ren AZ (2014) Seismic damage simulation in urban areas based
on a high-fidelity structural model and a physics engine. Nat Hazards 71(3):1679�C1693
Xu Z, Lu
XZ, Guan H, Lu X, Ren AZ (2013) Progressive-collapse simulation and critical
region identification of a stone arch bridge. J Perform Constr Fac -ASCE 27
(1): 43�C52
Zareian F, Krawinkler H (2007) Assessment of probability of collapse and design
for collapse safety. Earthquake Eng Struct Dyn 36(13): 1901�C1914
Figure captions:
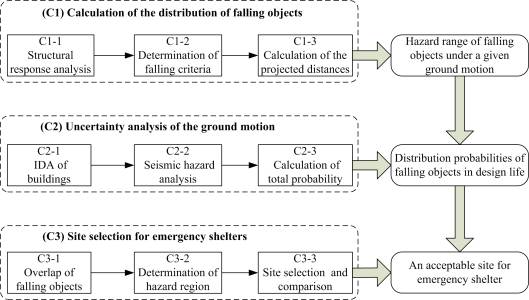
Fig. 1 Proposed simulation
framework
Fig. 2 The MCS model
for a building
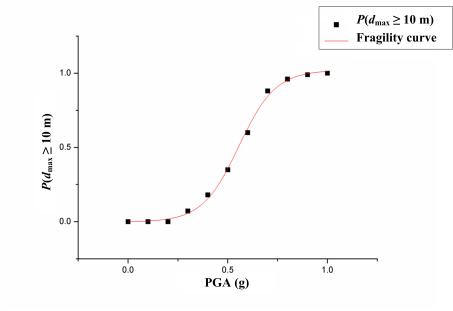
Fig. 3 Fragility curve of P(dmax��10
m) against different PGAs
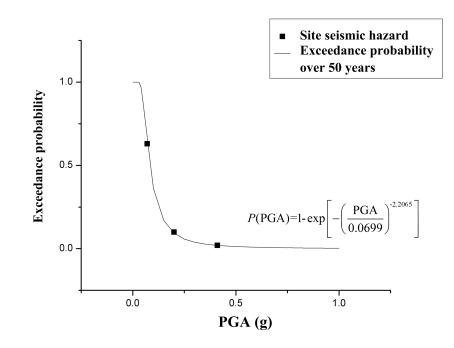
Fig. 4 Seismic hazard
curve over 50 years for the site in the case study
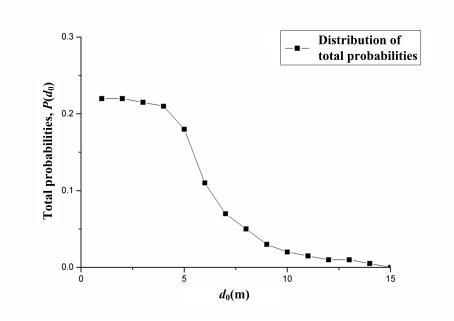
Fig. 5 Distribution
of total probabilities for falling objects over 50 years
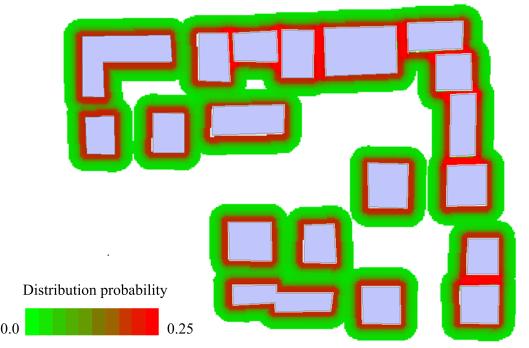
Fig. 6 Distribution
probabilities of falling objects in the selected community area
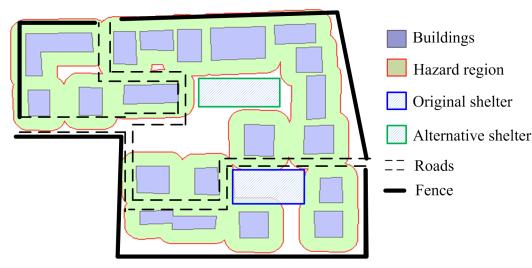
Fig. 7 Hazard regions
of falling objects and site location of emergency shelter
Table captions:
Table 1 Comparison
between the proposed MCS model and the Hazus method
Table 2 Allowable story drift
 (ASCE 2010)
|