3 Optimal Design of Structural
System
3.1 Two options for
the structural system
Due
to the height of the supertall building, its structural responses are more
sensitive to the lateral loads (wind and seismic loads) than those of the
ordinary frames or shear wall structures; in most cases the design of a supertall
building is dominated by the lateral stiffness (Moon, 2014). Therefore, choosing
a reasonable lateral force resisting system has a great influence on the cost
and safety of supertall buildings. CTBUH (2015b) has conducted an investigation
on the lateral force resisting systems of 75 supertall buildings constructed
between 1961 and 2010 worldwide. They include 20 framed-tube buildings, 4
bundled-tube buildings, 15 tube-in-tube buildings, 10 diagonalized buildings,
19 mega column/core tube/outrigger buildings and 7 mega column/core tube/brace
buildings. The statistics also indicate that the framed-tube, bundled-tube
and tube-in-tube structures are mainly applied in the tall buildings lower
than 90 stories. Among the 15 supertall buildings constructed between 2001
and 2010, 11 adopted the mega column/core tube/outrigger system and 3 adopted
the mega column/core tube/brace system. Conclusively, the mega structural
systems (e.g., the mega column/core tube/outrigger system and mega column/core
tube/brace system) have become the best choice for the lateral force resisting
systems of modern supertall buildings.
Consequently, the supertall building
studied herein also adopts such a mega structural system. In August 2011,
two design schemes with different lateral force resisting systems are proposed
at the preliminary design stage according to the requirement of architectural
features. The differences of these two schemes are briefly described as follows.
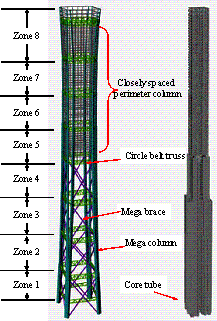
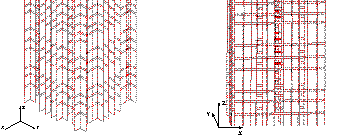
The first scheme is referred to as the
��half-braced scheme��. The lateral force resisting system at the lower four
zones involves mega columns, core tube and mega braces; while in the upper
four zones, the mega columns, core tube and outriggers are adopted as the
main lateral force resisting system, as shown in Figure 4(a). The mega columns,
located at four corners, are constructed by CFST and their cross sections
decrease along the building height. Each mega column at the corner is separated
into two columns from Zone 2 and extends to the top of the building. The mega
braces are arranged at the periphery of the building between Zone 1 and Zone
4. For the upper four zones, closely spaced perimeter columns are used instead
of mega braces. Nine circle belt trusses are arranged along the building height
at 13 to 15-story intervals. The outriggers are built between Zone 5 and Zone
8.
|
|
|
|
(a) Half-braced scheme
|
(b) Fully-braced scheme
|
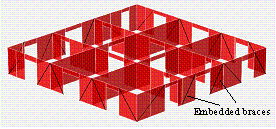
Figure 4. The sketch of the
two design schemes
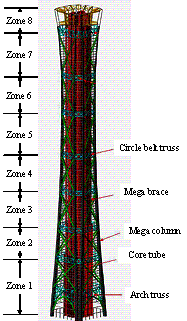
The other design scheme is referred to
as the ��fully-braced scheme�� and the main lateral force resisting system includes
mega columns, core tube and mega braces, as shown in Figure 4(b). The mega
columns are also constructed by CFST and the layout of the mega columns is
similar to the half-braced scheme except for the following two differences:
(a) Each corner has two mega columns; (b) the mega columns only extend to
the top of Zone 7. Zone 8, which is a sightseeing region, has no mega column.
The mega braces are arranged throughout the building height. The number of
circle belt trusses is reduced to eight comparing to the half-braced scheme.
The core tube of the fully-braced scheme is similar to the half-braced scheme.
3.2 Material consumption
The
fundamental vibration periods of the half-braced and fully-braced design schemes
are 7.44 s and 7.38 s, respectively. This implies that the lateral stiffness
of the fully-braced scheme is larger than that of the half-braced scheme.
The material consumption of these two schemes is compared in Table 2. Note
that both design schemes are for the preliminary design phase, therefore only
the concrete and steel consumptions of the main structural components are
calculated and compared; whereas the material consumption of non-structural
components is not considered.
Table 2. Comparison of the total
material consumption of the two design schemes
| |
Half-braced scheme
|
Fully-braced scheme
|
Relative deviation
|
|
Total mass (ton)
|
753 720
|
669 382
|
-11.19%
|
|
Concrete consumption (ton)
|
652 938
|
565 211
|
-13.44%
|
|
Steel consumption in mega
columns (ton)
|
29 074
|
23 934
|
-17.68%
|
|
Steel consumption in all
steel components (ton)
|
65 408
|
73 936
|
13.04%
|
|
Steel consumption in slab (ton)
|
6 300
|
6 093
|
-3.29%
|
|
Total steel consumption (ton)
|
100 783
|
103 963
|
3.16%
|
The comparison shows that the total material consumption (concrete
and steel) of the fully-braced scheme is 11.19% less than that of the half-braced
scheme. This is mainly because the mega columns and shear walls in the fully-braced
scheme have smaller cross sections, which results in a reduction of 13.44%
in concrete consumption. The steel consumption of the two design schemes,
on the other hand, is very similar. Specifically, the steel consumption of
the mega columns in the fully-braced scheme is 17.68% less than that of the
half-braced scheme; while the steel consumption of the mega braces increases
13.04% comparing to the half-braced scheme. Consequently, the total steel
consumption of the fully-braced scheme is only 3.16% larger than that of the
half-braced scheme. Overall, although the mega braces in the fully-braced
scheme result in a larger steel consumption, due to more uniform lateral stiffness
in the fully-braced scheme, the cross sections of other components have been
reduced and in turn resulted in a similar amount of the total steel consumption
of these two design schemes. In addition, the total mass of the fully-braced
scheme is smaller than that of the half-braced scheme.
3.3 Seismic performance
Although
the fully-braced scheme is advantageous in material consumption, the seismic
performances and collapse resistances of these two design schemes need to
be further studied. The seismic performances of the two design schemes are
comprehensively compared through nonlinear time history analysis (THA) using
different ground motions at various intensities. The seismic responses of
the two schemes subjected to the widely used ground motion records, El-Centro
EW 1940, are illustrated herein as typical cases. The PGA of the El-Centro
EW 1940 ground motion record is scaled to 400 cm/s2, 510 cm/s2
and 620 cm/s2, which correspond to the MCE level ground motion
of the seismic design intensities of 8, 8.5 and 9 degrees, respectively, as
specified by the Chinese code (CMC, 2010a). The classical Rayleigh damping
is adopted with a damping ratio of 5% in the nonlinear THA. Note that the
design intensity of this building is 8 degree. However, given the special
functionality and importance of this supertall building, stronger ground motions
are considered as the seismic input for the structure to evaluate the performance
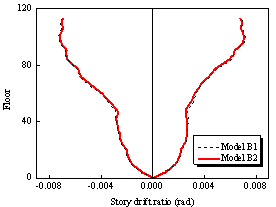
of the building subjected to extreme earthquakes. The envelopes of story drift
responses of the two schemes are shown in Figure 5.
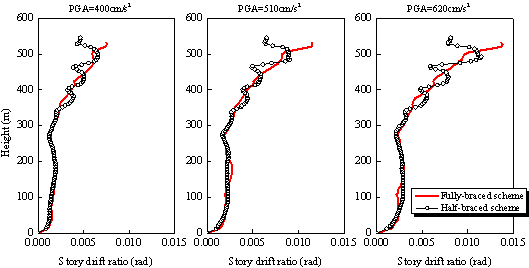
Figure 5. The story drift responses
of the two design schemes
It indicates that the story drift ratio
in the lower four zones is uniform and has no significant difference between
the two design schemes. Meanwhile, the story drift ratio in the upper zones
of the fully-braced scheme is slightly smaller than that of the half-braced
scheme; and this trend increases with the increase of earthquake intensity.
At the top of the building, the story drift ratio of the fully-braced scheme
is larger than that of the half-braced scheme. This is because the top three
stories of the fully-braced scheme are the sightseeing region. Hence, fewer
lateral force resisting components are allowed in this region according to
the requirement of the architectural function. Correspondingly, the lateral
stiffness of this region is relatively smaller than that of the other zones.
In addition, the story drift ratio in the upper zones of the half-braced scheme
has significant reductions at the location of each circle belt truss. This
phenomenon is due to the arrangement of the outriggers between Zone 5 and
Zone 8, which significantly enhance the local structural stiffness and hence
decrease the story drift ratio.
Generally, the seismic responses at the
MCE level of the two design schemes are very similar and the nonlinear THA
does not distinguish one scheme better than the other. Hence, earthquake-induced
collapse analysis based on IDA is necessary to be performed to evaluate the
ultimate collapse resistance of the two design schemes.
3.4 Collapse analysis
Due
to the absence of the site-specified ground motion records at the preliminary
design stage, the widely used 22 far-field ground motion records suggested
by FEMA P695 (2009) and the El-Centro EW 1940 ground motion are adopted as
the basic seismic input for the following two considerations.
(1) This work focuses on the relative
collapse capacity between the half-braced and fully-braced schemes in order
to identify the better design. For this reasion, the seismic input of these
two designs are kept the same, thereby the relative collapse capacities of
these two buildings can be obtained and differentiated; yet, the absolute
seismic performance of each design may not be as so accurate. Note that, at
the final design stage, a more accurate ground motion record set, which matches
the site-specified spectrum, has been adopted to further assess the seismic
performances of the improved designs.
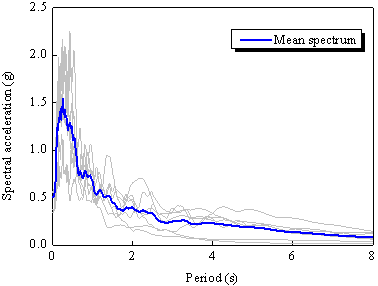
(2) Although the 22 far-field ground
motion record set is primarily intended for buildings with natural (first-mode)
periods less than or equal to 4 seconds, FEMA P695 (2009) also indicates that
most records obtained from the newer seismographs are typically accurate to
at least 10 seconds. As such, most records in far-field and near-field record
sets are accurate to a period of at least 10 seconds. The fundamental periods
of the two buildings are 7.44 s and 7.38 s, which are within the range of
10 seconds. Hence, the reliability of the evaluated seismic performances by
22 far-field ground motion record set is considered acceptable at the preliminary
design stage.
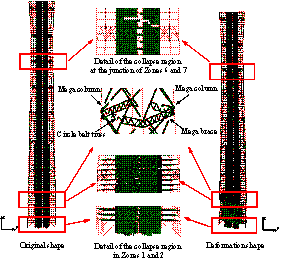
The earthquake-induced collapses of these
two design schemes subjected to extreme earthquakes are conducted using the
proposed method presented in Section 2.3. And a typical earthquake-induced
collapse process of the fully-braced scheme subjected to El-Centro EW 1940
ground motion with a PGA = 2058 cm/s2 is shown in Figure 6. At
the initial stage when t = 2.055 s (Figure 6(a)), the coupling beams
at the bottom of the core tube begin to fail due to shear. When t =
2.955 s (Figure 6(b)), the shear walls at Zone 6 begin to fail due to concrete
crushing. When t = 10.810 s (Figure 6(c)), as the shear walls at Zone
6 have already been damaged severely, the internal forces are redistributed
to other structural components. This results in gradually increased vertical
and horizontal loads in the mega columns. Subsequently, the mega columns at
the top of Zone 6 begin to fail due to the combined overturning moment and
compression. When t = 14.500 s (Figure 6(d)), the mega braces at Zone
6 begin to fail. When t = 15.360 s (Figure 6(e)), most of the core
tube, mega columns and mega braces are damaged in Zone 6 leading to the loss
of the vertical load carrying capacity of the building. Consequently, the
collapse of the whole building takes place. Meanwhile, large horizontal displacement
responses of the upper zones induce an additional overturning moment due to
the P-D
effect. From the collapse process described above, the progress of structural
failure generally follows: from the coupling beams at the bottom of the core
tube, to the shear walls at Zone 6, then to the mega columns at Zone 6, and
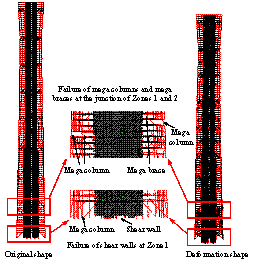
finally to the mega braces at Zones 6. In contrast, as discussed by
Lu et al. (2013a), a different pattern of the collapse process was found for
the half-braced scheme subjected to El-Centro EW 1940 ground motion, where collapse starts from the core tube at the bottom, then
to the shear walls and coupling beams in the higher zones, and finally
to the mega columns in Zones 1 and 2.
|
|
|
(a) t = 2.055 s, initiation of
failure of coupling beams at the bottom of core tube
|
|
|
|
(b) t = 2.955 s��failure of shear walls at Zone 6
|
|
|
|
(c) t = 10.810 s��failure of mega columns at Zone 6
|
|
|
|
(d) t = 14.500 s��failure of mega braces at Zone 6
|
|
|
|
(e) t = 15.360 s, most of the core
tube, mega columns and mega braces are damaged at Zone 6
|
|
Figure
6 Collapse details of fully-braced scheme subjected to El-Centro
EW (PGA = 2058
cm/s2)
|
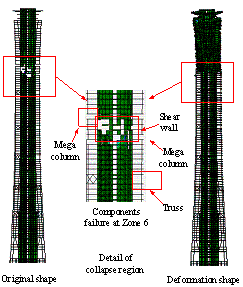
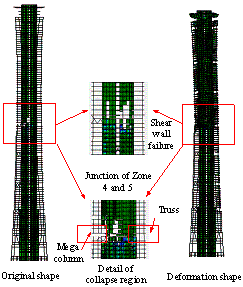
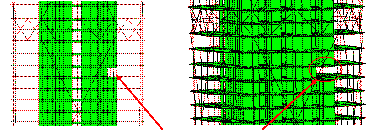
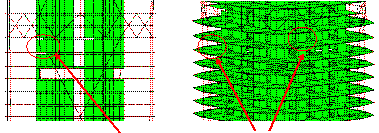
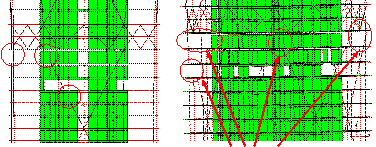
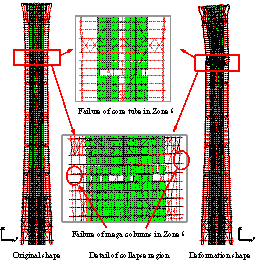
The collapse modes of the two schemes
subjected to the ground motion of El-Centro EW 1940 are compared in Figure
7. It clearly shows that the initial collapse region of the half-braced scheme
occurs at the bottom of Zone 2. In addition, the junction of Zones 6 and 7
also exhibit severe damage. In contrast, the earthquake-induced collapse of
the fully-braced scheme begins at Zone 6.
|
El-Centro EW (PGA = 2940
cm/s2)
|
KOBE_SHI000 (PGA
= 1764 cm/s2)
|
|
(a) Half-braced scheme
|
|
El-Centro EW (PGA
= 2058 cm/s2)
|
KOBE_SHI000 (PGA
= 2058 cm/s2)
|
|
(b) Fully-braced scheme
|
Figure 7. Typical collapse modes
of the two design schemes subjected to extreme earthquakes
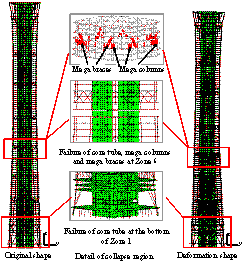
Giving the randomness nature of earthquakes,
different failure modes may be triggered by different ground motions. The
collapse mode of the fully-braced scheme subjected to KOBE_SHI000 ground motion
is also shown in Figure 7. The collapse progresses as follows: failure is
initiated from the coupling beams at the bottom of the core tube, then to
the shear walls at Zone 3, subsequently to the mega columns at Zone 3, and
finally to the mega braces at Zone 3, which is followed by the collapse of
the entire structure. However, as described by Lu et al. (2013a), the collapse
process of the half-braced scheme subjected to KOBE_SHI000 ground motion starts
from the failure of shear walls at the bottom of the building. Subsequently,
the mega columns and shear walls at Zone 2 are severely damaged. All these
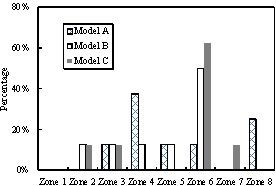
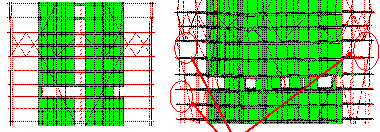
failures lead to the collapse of the entire building. The initial collapse
regions of these two schemes subjected to the 23 ground motion records are
shown in Figure 8. It is evident that Zone 2 is the main collapse region for
the half-braced scheme and it accounts for approximately 69.57% of all the
potential collapse regions. In contrast, the initial collapse regions of the
fully-braced scheme are more uniformly distributed in each zone. Zone 6, which
has the smallest planar layout, has a higher possibility to become the initial
collapse region than the other zones. Such initial collapse regions can also
be treated as the weakest points of the building when performing design optimization
of the structural components.
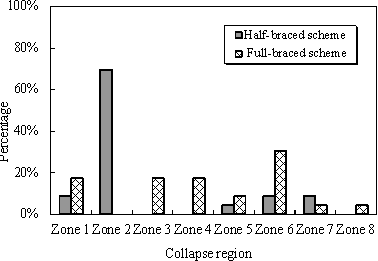
Figure 8 Collapse regions of
the two design schemes
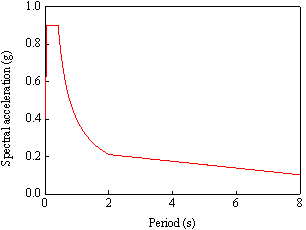
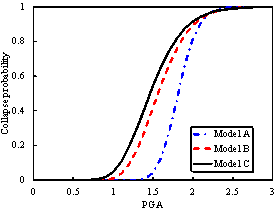
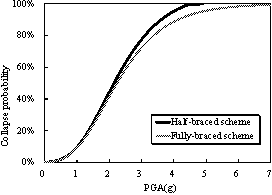
The collapse fragility curves for these
two schemes are compared in Figure 9. Because of the complicated nature of
ground motion records, the intensity measure (IM) may affect the shape
of the fragility curves. The authors have previously discussed the rationality
of different IMs for supertall buildings and proposed a more efficient
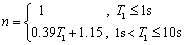
IM as shown in Eq.(1) (Lu et al, 2013c,d).
|
 , ,
|
(1)
|
where Sa(Ti) is the spectral acceleration
for the ith period; n is the number of the translational
vibration modes to be considered;  reflects the geometric mean of the spectral
acceleration at the first n periods of the structure, which contributes
the most to the structural seismic responses. The collapse fragility curves
for the two design schemes using PGA and reflects the geometric mean of the spectral
acceleration at the first n periods of the structure, which contributes
the most to the structural seismic responses. The collapse fragility curves
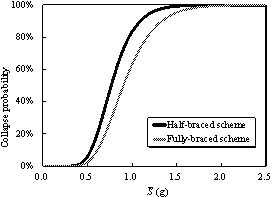
for the two design schemes using PGA and  as IMs are shown in Figure 9. Generally,
the collapse probability of the half-braced scheme is higher than that of
the fully-braced scheme subjected to the same ground motion intensity. The
dispersions of the fragility curves based on as IMs are shown in Figure 9. Generally,
the collapse probability of the half-braced scheme is higher than that of
the fully-braced scheme subjected to the same ground motion intensity. The
dispersions of the fragility curves based on  (Figure 9(b)) are significantly smaller
than those based on PGA (Figure 9(a)). For example, the IM of each
ground motion that triggers a collapse is recorded, which is referred to as
��IMcollapse�� (e.g., ��PGAcollapse �� or �� (Figure 9(b)) are significantly smaller
than those based on PGA (Figure 9(a)). For example, the IM of each
ground motion that triggers a collapse is recorded, which is referred to as
��IMcollapse�� (e.g., ��PGAcollapse �� or ��
 ��). The coefficient of variation (COV) of PGAcollapse
for the half-braced scheme is 0.426. In contrast, the corresponding COV of ��). The coefficient of variation (COV) of PGAcollapse
for the half-braced scheme is 0.426. In contrast, the corresponding COV of
 is only 0.282. Thus, is only 0.282. Thus,  is able to significantly reduce the dispersion
of collapse resistances due to different ground motions. It
should be noted that the Chinese building code adopts PGA to quantify the
earthquake intensity, which is also popularly used in engineering practices.
Note also that although different IMs will affect the dispersion of
collapse resistances, they will not necessarily affect the relative collapse
resistances of different design schemes. Therefore, PGA is selected as the
IM to facilitate the following discussion in this work. is able to significantly reduce the dispersion
of collapse resistances due to different ground motions. It
should be noted that the Chinese building code adopts PGA to quantify the
earthquake intensity, which is also popularly used in engineering practices.
Note also that although different IMs will affect the dispersion of
collapse resistances, they will not necessarily affect the relative collapse
resistances of different design schemes. Therefore, PGA is selected as the
IM to facilitate the following discussion in this work.
|
|
|
|
(a) Based on PGA
|
(b) Based on 
|
|
Figure 9. The collapse
fragility curves for the two design schemes
|
The CMR proposed in FEMA P695
(2009) is adopted to quantify the structural collapse resistance capacity,
which is defined by the following equation.
|

|
(2)
|
where,
IMCT is the ground motion intensity subject to which the
collapse possibility is 50%; IMMT is the ground motion intensity
corresponding to the design MCE level. For both design schemes, the PGA corresponding
to the MCE level is 0.4 g as specified in the design code, and the PGAs inducing
a 50% of the building collapse are 2.35 g and 2.70 g, respectively, for the
half- and fully-braced schemes. Consequently, the CMRs of the two schemes
are 5.88 and 6.75, respectively, according to Eq. (2). This evidently demonstrates
that the fully-braced scheme has a relatively higher collapse resistance than
the half-braced scheme.
According to FEMA P695 (2009), the total
system collapse uncertainty (bTOT) considered
in this work is estimated to be 0.675. Thus, the CMR corresponding
to a 5% collapse possibility at MCE level is 3.04 (FEMA P695 2009). Both the
CMRs of the two design schemes readily meet this requirement. It is
noteworthy that these CMRs don��t account for the expected epsilon (e) for the building site
and collapse hazard intensity. To slove this issuse, Haselton et al, (2011)
and FEMA P695 (2009) suggested a simplified spectral shape factors (SSF)
to get a more accurate CMR prediction (ACMR=SSF��CMR, where
ACMR is the adjusted collapse margin ratio). SSF depends
on the building dynamic characteristics, inelastic performances and e parameters. Given that
the e parameters are not provided
in the seismic hazard map of China, it becomes problematic to compute the
SSF and ACMR. Note that this work focuses on the relative collapse
capacity between the half-braced and fully-braced design schemes. As the locations
of the two buildings have the same site conditions, and both buildings have
similar vibration periods, their SSF values are expected to be very
close. Thus, the unadjusted collapse margin ratio can still be used to distinguish
which design is a better one.
Furthermore, the collapse probabilities
of these two buildings at the MCE level earthquake are approximately 1.34%
and 1.29%, respectively,
for half-braced and fully-braced schemes. Clearly, such low collapse probabilities
also meet the requirements of both ASCE 7-10 (i.e., < 6% at the MCE level
for Risk Category III) (ASCE, 2010) and the Code for anti-collapse design
of building structures of China (i.e., < 5% at the MCE level)
(CAECS, 2015). Note that the fully-braced scheme exhibits a higher collapse
resistance, having a CMR 14.8% higher than that of the half-braced
scheme. Furthermore, the total material consumption of the fully-braced scheme
is 11.2% lower than that of the half-braced scheme. As a result, the fully-braced
scheme is suggested as the lateral force resisting system for the supertall
building studied herein.
|