5. Conclusions
In this work, a framework for physics-based
simulation and high-fidelity visualization of FFE, considering the building
seismic damage, are proposed. A case study of the FFE simulation of downtown
Taiyuan City is performed. The conclusions can be drawn as follows:
(1)
The seismic damage of regional buildings is simulated using the nonlinear
MDOF building model and nonlinear THA, which is necessary for FFE simulation.
Consequently, the influence of different ground motions and different building
seismic resistances on the fire ignition locations and fire spread can be considered,
which leads to a more rational and accurate FFE simulation.
(2)
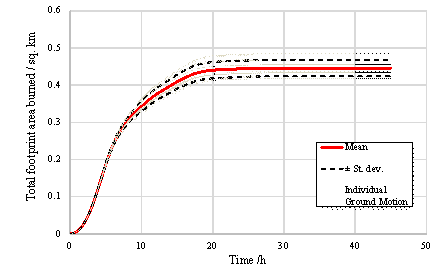
The fire spread outcomes of different ground motions are similar to
each other in the initial stage of FFE; however they deviate with time. The
seismic damage to an exterior façade will induce a larger burned area.
(3)
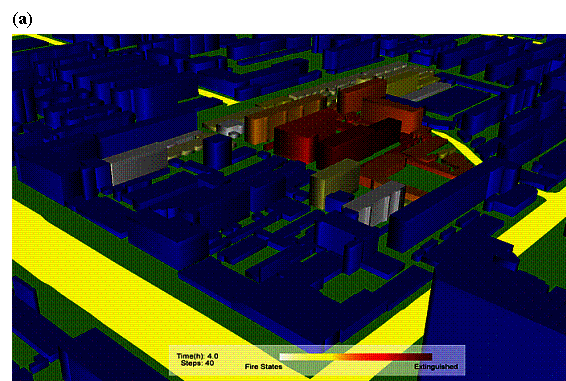
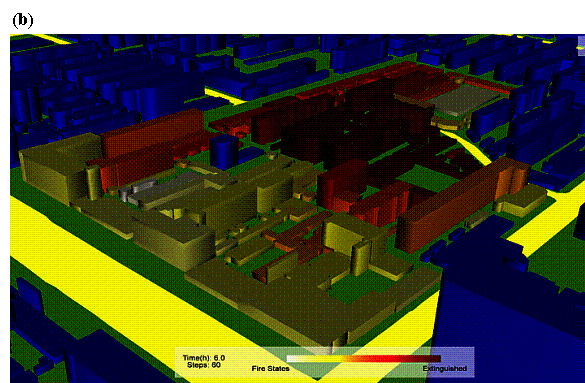
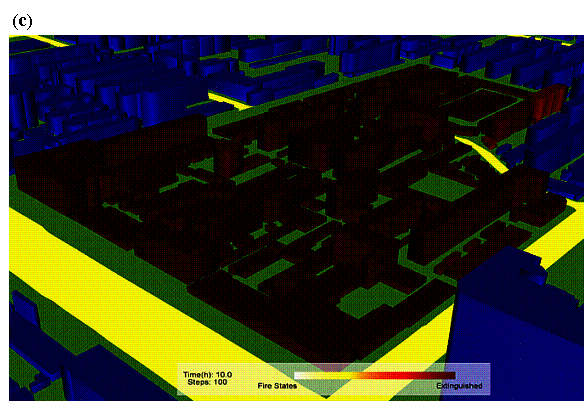
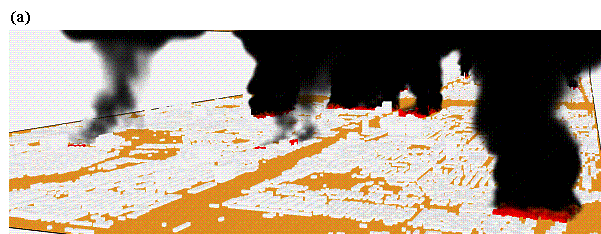
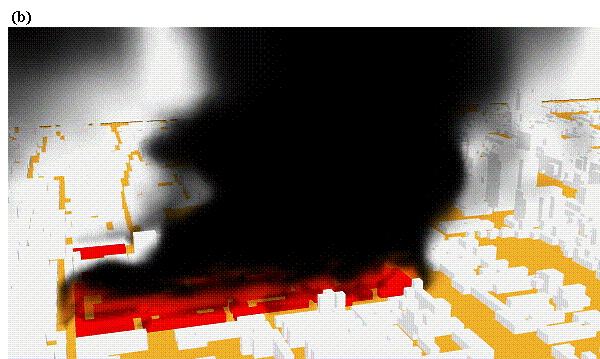
Based on the OSG graphics engine, the dynamic process of fire development
can be clearly displayed using different color contours; using FDS and Smokeview,
the smoke effects can be visualized realistically. Such results will facilitate
non-professional users in their efforts in preventing and mitigating the FFE.
Acknowledgements
Professor Kincho Law in Stanford University
gave constructive suggestions on this paper. The authors are grateful for the
financial support received from the National Natural Science Foundation of China
(No. 51578320), and the China Scholarship Council. The authors are also grateful
for the Thunderhead Engineering Consultants, Inc. for providing the PyroSim
software for free.
References
Anderson, D., Davidson, R. A., Himoto, K. and Scawthorn, C. [2016]
"Statistical modeling of fire occurrence using data from the thoku, japan
earthquake and tsunami," Risk Analysis 36(2), 378-395.
Chaljub, E., Moczo, P., Tsuno, S., Bard, P. Y., Kristek, J., Käser,
M., Stupazzini, M. and Kristekova, M. [2010] "Quantitative comparison of
four numerical predictions of 3D ground motion in the grenoble valley, france,"
Bulletin of the Seismological Society of America 100(4), 1427-1455.
Cheng, H. and Hadjisophocleous, G. V. [2011] "Dynamic modeling
of fire spread in building," Fire Safety Journal 46(4), 211-224.
China Ministry of Construction (CMC) [2010] Code for seismic design
of buildings, GB50011-2010. China Architecture and Building Press, Beijing (in
Chinese)
Cousins, J., Thomas, G., Heron, D. and Smith, W. [2012] "Probabilistic
modeling of post-earthquake fire in wellington, new zealand," Earthquake
Spectra 28(2), 553-571.
Davidson, R. A. [2009] "Modeling postearthquake fire ignitions
using generalized linear (mixed) models," Journal of Infrastructure Systems
15(4), 351-360.
Diao, F., Wang, R., Aochi, H., Walter, T. R., Zhang, Y., Zheng, Y.
and Xiong, X. [2016] "Rapid kinematic finite-fault inversion for an mw
7+ scenario earthquake in the marmara sea: an uncertainty study," Geophysical
Journal International 204(2), 813-824.
Federal Emergency Management Agency (FEMA) [2012] Seismic performance
assessment of buildings volume 1 - methodology, Technical report FEMA P-58,
Washington, DC.
Hayashi, Y., Inoue, M., Kuo, K. C. and Suita, K. [2005] "Damage
ratio functions of steel buildings in 1995 hyogo-ken nanbu earthquake,"
Proc. of ICOSSAR 2005, Rotterdam, Nederland, pp. 633-639.
Himoto, K. and Tanaka, T. [2000] "A preliminary model for urban
fire spread-building fire behavior under the influence of external heat and
wind", Thirteenth meeting of the UJNR panel on fire research and safety,
pp. 309-319.
Himoto, K. and Tanaka, T. [2003] "A physically-based model for
urban fire spread," Fire Safety Science 7129-140.
Himoto, K. and Tanaka, T. [2008] "Development and validation of
a physics-based urban fire spread model," Fire Safety Journal 43(7), 477-494.
Himoto, K., Mukaibo, K., Akimoto, Y., Kuroda, R., Hokugo, A. and Tanaka,
T. [2013] "A physics-based model for post-earthquake fire spread considering
damage to building components caused by seismic motion and heating by fire,"
Earthquake Spectra 29(3), 793-816.
Lee, S. W. and Davidson, R. A. [2010a] "Application of a physics-based
simulation model to examine post-earthquake fire spread," Journal of Earthquake
Engineering 14(5), 688-705.
Lee, S. W. and Davidson, R. A. [2010b] "Physics-based simulation
model of post-earthquake fire spread," Journal of Earthquake Engineering
14(5), 670-687.
Lee, S., Davidson, R., Ohnishi, N. and Scawthorn, C. [2008] "Fire
following earthquake��reviewing the state-of-the-art of modeling," Earthquake
Spectra 24(4), 933-967.
Li, S. and Davidson, R. [2013] "Application of an urban fire simulation
model," Earthquake Spectra 29(4), 1369-1389.
Lu,
X. Z., Han, B., Hori, M., Xiong, C. and Xu, Z. [2014] "A coarse-grained
parallel approach for seismic damage simulations of urban areas based
on refined models and GPU/CPU cooperative computing," Advances in
Engineering Software 70, 90-103.
Mousavi, S., Bagchi, A. and Kodur, V. K. [2008] "Review of post-earthquake
fire hazard to building structures," Canadian Journal of Civil Engineering
35(7), 689-698.
National Institute of Standards and Technology (NIST) [2016] Fire Dynamics
Simulator (FDS) and Smokeview (SMV). https://pages.nist.gov/fds-smv/.
Omidvar, B. and Kivi, H. K. [2016] "Multi-hazard failure probability
analysis of gas pipelines for earthquake shaking, ground failure and fire following
earthquake," Natural Hazards 82(1), 703-720.
OpenSceneGraph (OSG) [2016] Openscenegraph
Website. http://www.openscenegraph.org/
Pacific Earthquake Engineering Research Center (PEER) [2016] PEER ground
motion database. http://ngawest2.berkeley.edu/
Ren, A. Z. and Xie, X. Y. [2004] "The simulation of post-earthquake
fire-prone area based on GIS," Journal of Fire Sciences 22(5), 421-439.
Sathiparan, N. [2015] "Mesh type seismic retrofitting for masonry
structures: critical issues and possible strategies," European Journal
of Environmental and Civil Engineering 19(9), 1136-1154.
Scawthorn, C., Eidinger, J. and Schiff, A. [2005] "Fire following
earthquake,�� Technical Council on Lifeline Earthquake Engineering Monograph
No. 26, American Society of Civil Engineers, Reston, VA.
Sekizawa, A. [2003] "Development of seismic-induced fire risk
assessment method for a building.," Fire Safety Science 7309-320.
Taiyuan [2015]
Taiyuan yearbook 2015, Taiyuan, Shanxi, China.
Thomas, G., Heron, D., Cousins, J. and de R��iste, M. [2012] "Modeling
and estimating post-earthquake fire spread," Earthquake Spectra 28(2),
795-810.
Thunderhead [2016] Pyrosim: fire dynamics and smoke control, http://www.thunderheadeng.com/pyrosim/.
Xiong, C., Lu, X. Z.,
Guan, H. and Xu, Z. [2016a] "A nonlinear computational model for
regional seismic simulation of tall buildings," Bulletin of Earthquake
Engineering 14(4), 1047-1069.
Xiong, C., Lu,
X. Z. and Lin, X. C. [2016b] "Parameter determination and damage
assessment for tha-based regional seismic damage prediction of multi-story
buildings," Journal of Earthquake Engineering, doi: 10.1080/13632469.2016.1160009
Xu,
Z., Lu, X. Z., Guan, H., Chen, C. and Ren, A. Z. [2014a] "A virtual
reality based fire training simulator with smoke hazard assessment capacity,"
Advances in Engineering Software 68(2), 1-8.
Xu,
Z., Lu, X. Z., Guan, H., Han, B. and Ren, A. Z. [2014b] "Seismic
damage simulation in urban areas based on a high-fidelity structural model
and a physics engine," Natural Hazards 71(3), 1679-1693.
Xu, Z., Lu, X.
Z., Guan, H., Tian, Y. and Ren, A. Z. [2016a] "Simulation of earthquake-induced
hazards of falling exterior non-structural components and its application
to emergency shelter design," Natural Hazards 80(2), 935-950.
Xu,
Z., Lu, X. Z. and Law, K. H. [2016b] "A computational framework for
regional seismic simulation of buildings with multiple fidelity models,"
Advances in Engineering Software 99, 100-110.
Yildiz, S. S. and Karaman, H. [2013] "Post-earthquake ignition
vulnerability assessment of k��ç��kçekmece district," Natural
Hazards and Earth System Sciences Discussions 1(3), 2005-2040.
Zeng,
X., Lu, X. Z., Yang, T. Y. and Xu, Z. [2016] "Application of the
FEMA-P58 methodology for regional earthquake loss prediction," Natural
Hazards 83(1), 177-192.
Zhao, S. J. [2006] "Study on risk assessment and simulation of
urban post-earthquake fire based on GIS, " Ph.D. thesis, Dept. of Civil
Engineering, Tsinghua University, Beijing. (in Chinese)
Zhao, S. J. [2010] "GisFFE��an integrated software system for the
dynamic simulation of fires following an earthquake based on GIS," Fire
Safety Journal 45(2), 83-97.
Zolfaghari, M. R., Peyghaleh, E. and Nasirzadeh, G. [2009] "Fire
following earthquake, intra-structure ignition modeling," Journal of Fire
Sciences 27(1), 45-79.
Table 1. Descriptions of the parameters in
the equations of the probabilistic model.
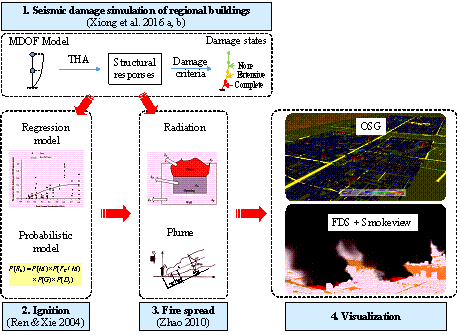
Figure 1. The
proposed framework of FFE simulation and visualization.
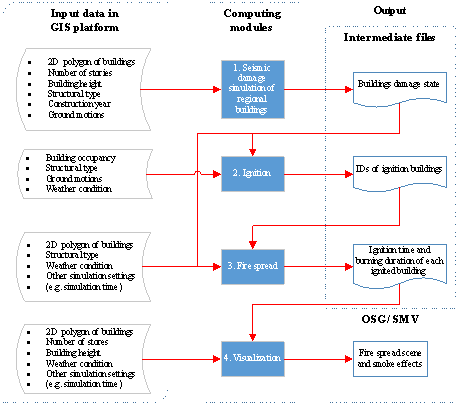
Figure 2. Data
exchanges among computing modules.
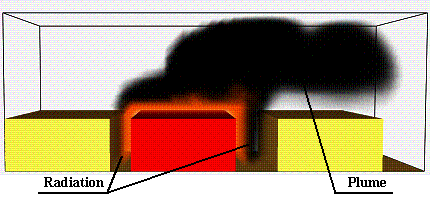
Figure 3. Two
main mechanisms affecting fire spread among buildings: thermal radiation and
thermal plume.
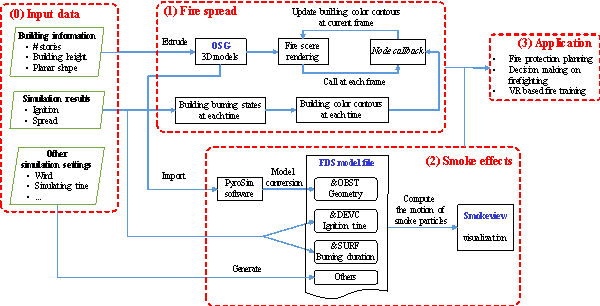
Figure 4. Flowchart
of the high-fidelity visualization.
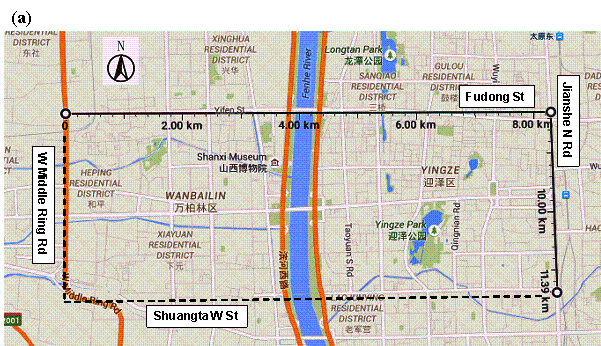
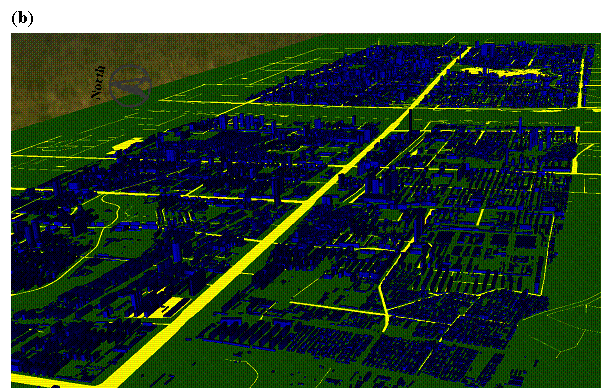
Figure 5. Case
study region, downtown Taiyuan City, China: (a) The region (Source: Google maps),
(b) 3D sketch.
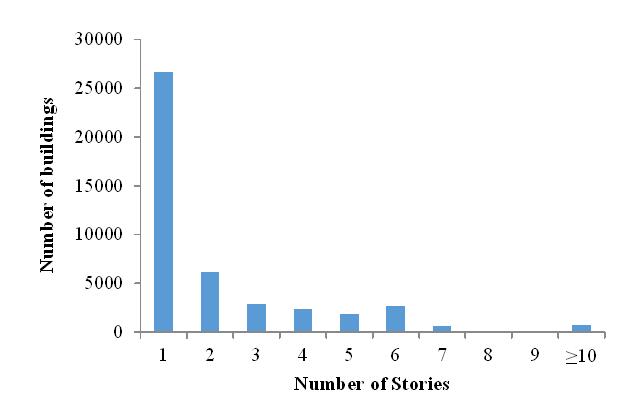
Figure 6. Statistics
of the number of buildings with different stories in downtown Taiyuan City.
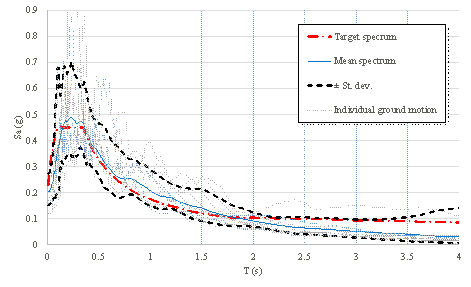
Figure 7. Response
spectra of the input ground motions and the target spectrum.
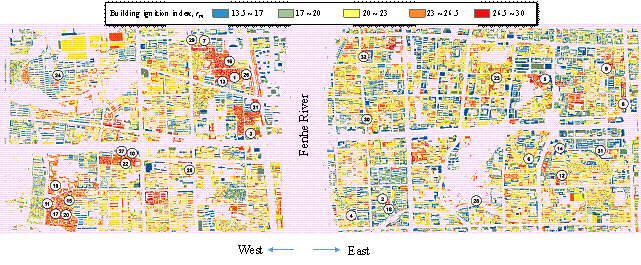
Figure 8. The
mean ignition index of each building and the locations of the 32 ignited buildings.
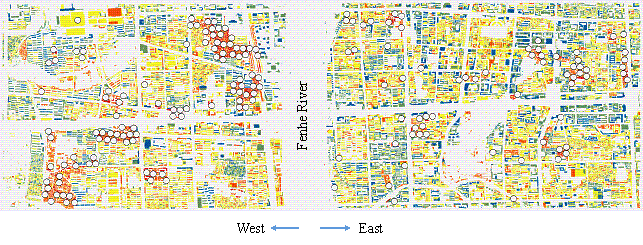
Figure 9. The
locations of top 1000 most severely damaged buildings.
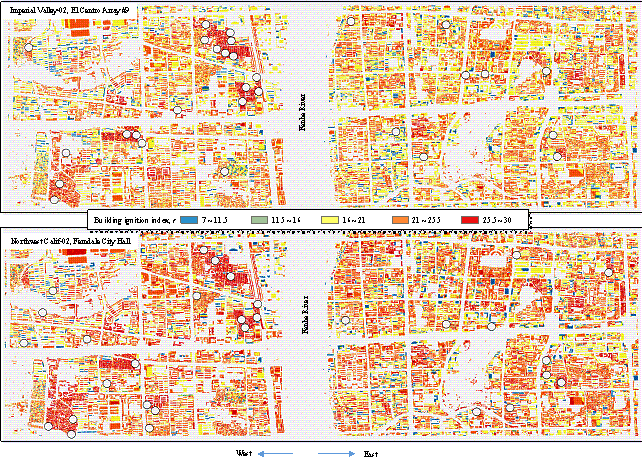
Figure 10.
The building ignition indices under the two selected ground motions.
Figure 11.
Total footprint area burned vs. time: the mean and standard deviation.
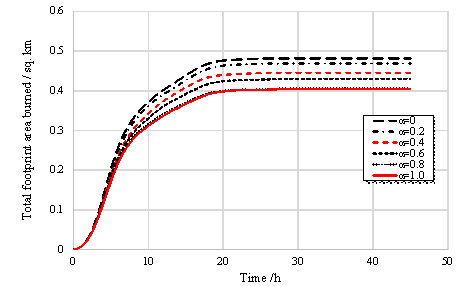
Figure 12.
Total footprint area burned vs. time for different values of  .
.
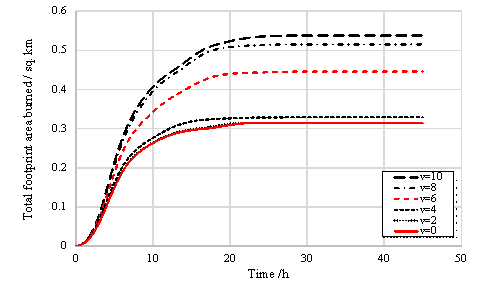
Figure 13.
Total footprint area burned vs. time for different wind speeds. v stands
for wind speed (unit: m/s).
Figure 14.
Fire spread effects using OSG: (a) t = 4 h, (b) t = 6 h, (c) t
= 10 h.
Figure 15.
Smoke effects displayed in Smokeview: (a) global view, (b) local view.
|