5 Case study
5.1 Overview
A total of 199 reinforced masonry
buildings located at Tsinghua University campus are considered in this study.
According to the Chinese ��Code for seismic design of buildings�� (MOHURD
2010), these buildings have a 8-degree seismic design intensity (with the
PGA of 0.20g at the 10% probability of exceedance in 50-year hazard level),
with the site condition of Class �� specified in the Chinese code, which approximately
corresponds to site classes C and D in ASCE 7-10 of the United States (Luo
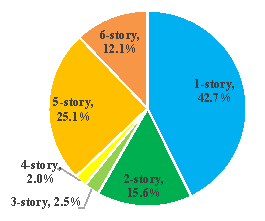
and Wang 2012, ASCE 2010). Fig. 4 illustrates the percentage of different
story numbers and construction years. Table 2 provides the mean of story numbers,
story heights, and floor areas of the buildings. In this study, three typical
buildings of 1-story, 3-story, and 6-story (denoted as RM-1, RM-3, and RM-6)
are analyzed before the regional seismic damage prediction. During the analysis,
the parameters of different buildings are considered to be independent from
each other. In addition, the interaction between different buildings is not
considered for simplification.
|
|
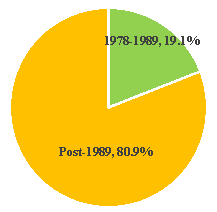
*Different codes are used in periods of
1978 to 1989, and after 1989
|
|
(a) Percentage of different story numbers
|
(b) Percentage of different construction years
|
Fig. 4 Composition of regional reinforced masonry buildings
Table 2 Mean of typical
parameters of regional reinforced masonry buildings
| |
Story number
|
Story height
|
Floor area
|
|
Mean
|
2.87
|
3.43 m
|
505.05 m2
|
5.2 Sensitivity analysis results of
individual reinforced masonry building
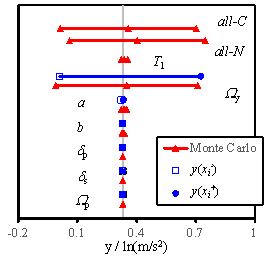
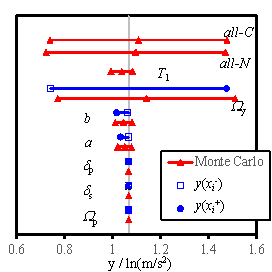
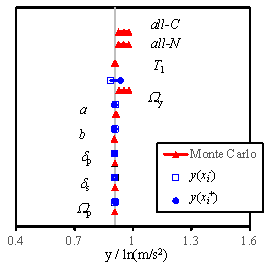
Tornado diagram is a widely used
tool to illustrate the sensitivity analysis results (Porter et al. 2002, Lee and Mosalam
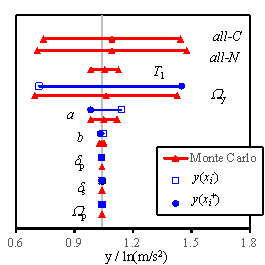
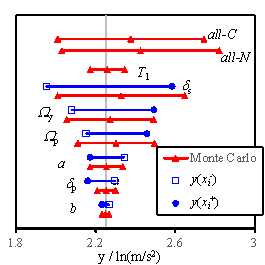
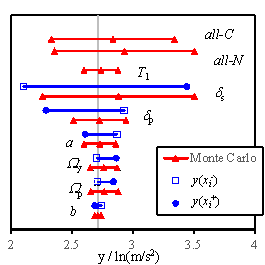
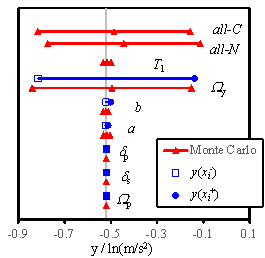
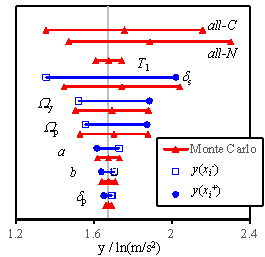
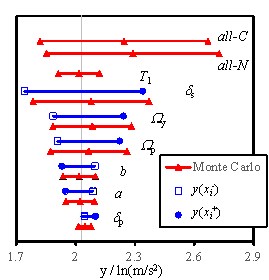
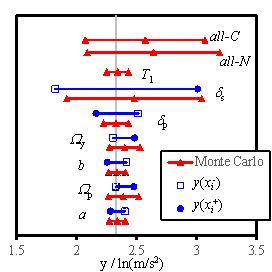
2005, Na et al. 2008, Shin and Kim 2014). Figs. 5 to 7 show the sensitivity analysis
results obtained for RM-1, RM-3, and RM-6, considering 4 damage states. The
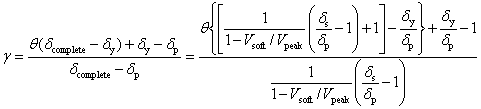
gray vertical line in each figure denotes my defined in Eq. (14). The blue
solid lines denote the results obtained using the FOSM method, and the red
lines symbolize the results of the Monte Carlo simulation. Here, the hollow
square refers to  , and the solid dot represents
  , which are expressed in Eq. (18). For the Monte Carlo simulation outcomes,
the difference between the left/right triangles and the middle one indicates
the standard deviation of the results. Furthermore, ��all-C��
implies that all the random variables change simultaneously with the consideration
of the conditional distribution; ��all-N�� denotes the simultaneous
change of all the random variables without the consideration of the conditional
distribution; ��T1�� stands for the results being obtained
when a and b are changed simultaneously; other symbols denote
the results obtained when only the specific variable is varied during the
analysis.
, which are expressed in Eq. (18). For the Monte Carlo simulation outcomes,
the difference between the left/right triangles and the middle one indicates
the standard deviation of the results. Furthermore, ��all-C��
implies that all the random variables change simultaneously with the consideration
of the conditional distribution; ��all-N�� denotes the simultaneous
change of all the random variables without the consideration of the conditional
distribution; ��T1�� stands for the results being obtained
when a and b are changed simultaneously; other symbols denote
the results obtained when only the specific variable is varied during the
analysis.
|
|
|
|
(1) Slight damage
|
(2) Moderate damage
|
|
|
|
|
(3) Extensive damage
|
(4) Complete damage
|
Fig. 5 Tornado diagrams of the uncertainty analysis results
for RM-1
|
|
|
|
(1) Slight damage
|
(2) Moderate damage
|
|
|
|
|
(3) Extensive damage
|
(4) Complete damage
|
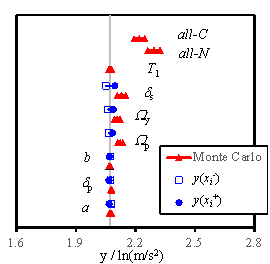
Fig. 6 Tornado diagrams of the uncertainty analysis results
for RM-3
|
|
|
|
(1) Slight damage
|
(2) Moderate damage
|
|
|
|
|
(3) Extensive damage
|
(4) Complete damage
|
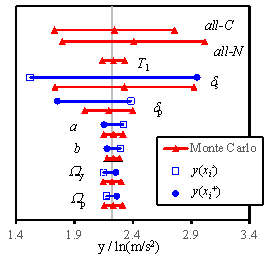
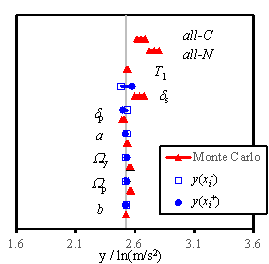
Fig. 7 Tornado diagrams of the uncertainty analysis results
for RM-6
From the results displayed in
Figs. 5 to 7, the following observations with regard to the seismic damage
sensitivity of reinforced masonry buildings can be drawn:
(1) The relative sensitivity of each
parameter is similar for buildings with different story numbers;
(2) The yield overstrength ratio Wy is important for the ��Slight��,
��Moderate�� and ��Extensive�� damage states, and its influence cannot be neglected
even for the ��Complete�� damage state;
(3) The peak overstrength ratio Wp is important for the ��Extensive��
damage state, but has little or no influence to the ��Slight�� and ��Moderate��
damage states, and its influence to the ��Complete�� damage state is small;
(4) The IDR at the peak point dp is important for the ��Complete��
damage state, whereas no influence is found to the ��Slight�� and ��Moderate��
damage states;
(5) The IDR at the softening point
ds is an important parameter for
the ��Extensive�� and ��Complete�� damage states; however no influence is observed
to the ��Slight�� and ��Moderate�� damage states;
(6) The parameters for estimating
the fundamental periods, a and b, have a minor influence to
all the damage states;
(7) Based on the observations provided
above, the accuracy of the individual building analysis can be further improved
by using more accurate critical parameters which have greater influence on
the seismic performance of the individual building.
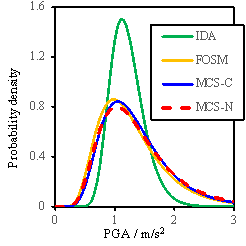
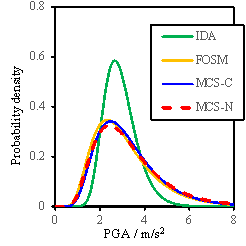
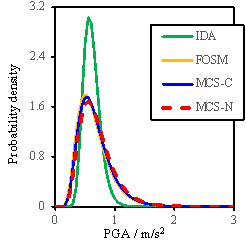
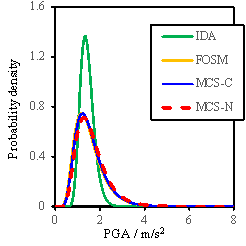
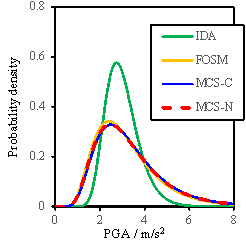
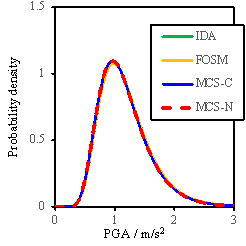
Based on the results obtained
from the FOSM method and the Monte Carlo simulation, the probability density
curves or the fragility curves can also be determined as shown in Figs. 8
to 10. Note that the density curves can illustrate the sensitivity results
more clearly than the cumulative fragility curves. In these figures, ��IDA��
denotes the results obtained when only the uncertainty of ground motions is
considered; ��FOSM�� denotes the results due to the FOSM method; ��MCS-C�� refers
to the results of the Monte Carlo simulation considering the conditional distribution;
and ��MCS-N�� represents the results of the Monte Carlo simulation without consideration
of the conditional distribution.
|
|
|
|
(1) Slight damage
|
(2) Moderate damage
|
|
|
|
|
(3) Extensive damage
|
(4) Complete damage
|
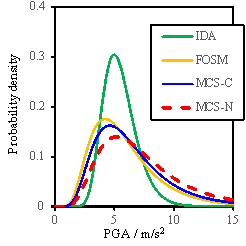
Fig. 8 Probability density results for RM-1
|
|
|
|
(1) Slight damage
|
(2) Moderate damage
|
|
|
|
|
(3) Extensive damage
|
(4) Complete damage
|
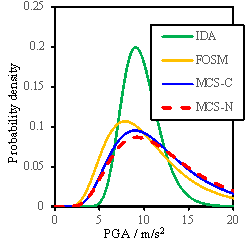
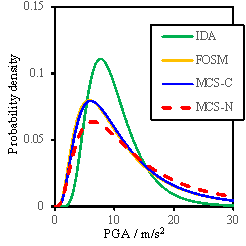
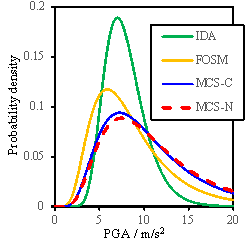
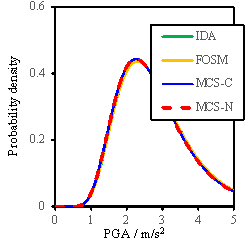
Fig. 9 Probability density results for RM-3
|
|
|
|
(1) Slight damage
|
(2) Moderate damage
|
|
|
|
|
(3) Extensive damage
|
(4) Complete damage
|
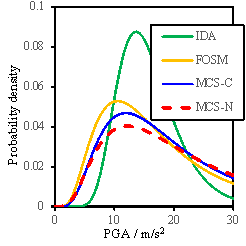
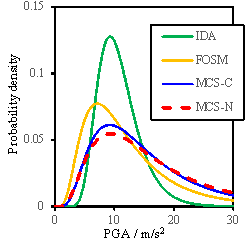
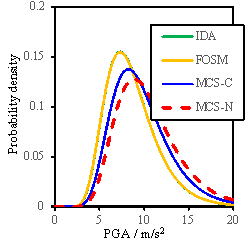
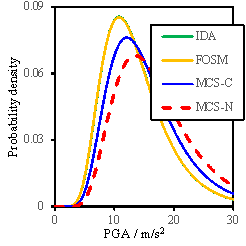
Fig. 10 Probability density results for RM-6
Results shown in Figs.8-10 lead
to the following additional observations:
(1)
The FOSM
method, with significantly reduced workload, can produce similar results as
the Monte Carlo simulation;
(2)
When
all the random variables change simultaneously in the Monte Carlo simulation,
a larger value of my is obtained compared to the assumed value
of my used for the FOSM method, suggesting that
the assumption for my used in the FOSM method is conservative;
(3)
The consideration
of conditional distribution yields a smaller standard deviation of results,
especially for the ��Complete�� damage state, and is closer to the results obtained
from the FOSM method.
(4)
When
analyzing the seismic performance of an individual building, the influence
of uncertainty of model parameters is significant and cannot be neglected.
5.3 Sensitivity analysis results of
regional reinforced masonry buildings
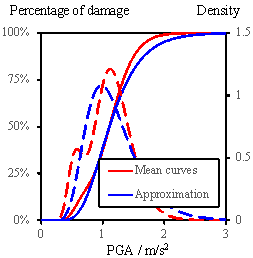
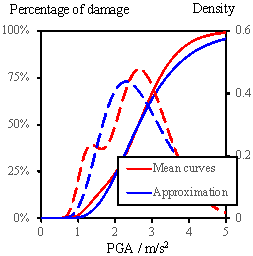
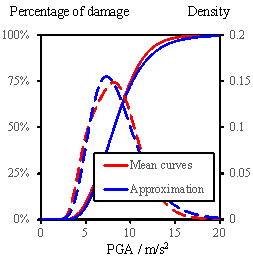
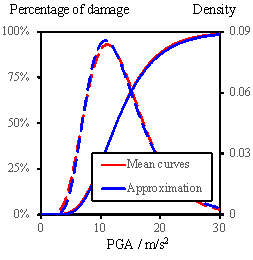
With respect to the regional buildings,
the mean fragility curves (or the probability density curves) are obtained
by evaluating the mean probability (or probability density) of exceeding each
damage state for all the buildings under a certain level of PGA, as shown
in Fig. 11 (the solid lines are the fragility curves, and the dashed lines
are corresponding probability density curves). Note that these fragility curves
are not in a precise lognormal distribution form. Notwithstanding, the lognormal
distribution can still be used as an approximation of these curves. Similar
to Section 5.2, the tornado diagram results are illustrated in Fig. 12.
|
|
|
|
(1) Slight damage
|
(2) Moderate damage
|
|
|
|
|
(3) Extensive damage
|
(4) Complete damage
|
Fig. 11 Mean fragility curves of regional buildings
|
|
|
|
(1) Slight damage
|
(2) Moderate damage
|
|
|
|
|
(3) Extensive damage
|
(4) Complete damage
|
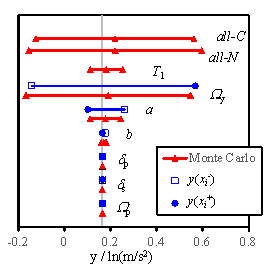
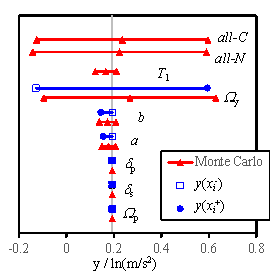
Fig. 12 Tornado diagram of results for regional reinforced
masonry buildings
Comparing the results presented
in Figs. 5 to 7 and Fig. 12, it can be found that the sensitivity relationship
of each parameter for the regional buildings is similar to the results of
individual buildings. The influence by parameter uncertainty of the regional
buildings, however, becomes much smaller than that of individual buildings.
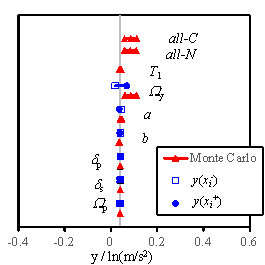
To quantify the relationship of
sensitivity between the regional building analysis and the individual building
analysis, the ratios of bMDL,RM-Urban (the standard deviation of regional
analysis induced by parameter uncertainty) over bMDL,RM-i (the standard deviation of individual
building analysis induced by parameter uncertainty) for each case are provided
in Fig. 13.
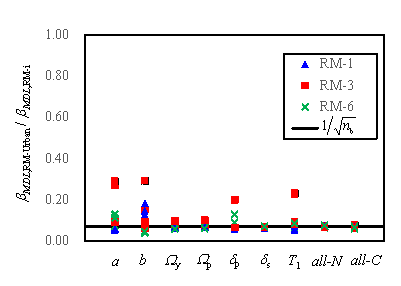
Fig. 13 Comparison of sensitivity between regional and individual
building analyses
In Fig. 13, each point represents the ratio obtained
only when the specific variable (denoted along the horizontal axis) changes
during the analysis. The sensitivity of the regional buildings decreases when
the number of buildings (denoted as nb) increases, and it
approaches approximately  of the corresponding sensitivity of an individual building. Note
that, if a group of variables follows independent and identical normal distribution
of N(m, s),
then the mean of these variables will follow a normal distribution of N(m,
s/
of the corresponding sensitivity of an individual building. Note
that, if a group of variables follows independent and identical normal distribution
of N(m, s),
then the mean of these variables will follow a normal distribution of N(m,
s/  ). Therefore the value of
  can be mathematically obtained when
the region consists of nb independent
and identical buildings. This is particularly true when all the
parameters are changing concurrently (i.e. ��all-N�� and ��all-C��
in Fig. 13), which may reduce the dispersion contributed by each parameter
alone.
can be mathematically obtained when
the region consists of nb independent
and identical buildings. This is particularly true when all the
parameters are changing concurrently (i.e. ��all-N�� and ��all-C��
in Fig. 13), which may reduce the dispersion contributed by each parameter
alone.
|
|
|
|
(1) Slight damage
|
(2) Moderate damage
|
|
|
|
|
(3) Extensive damage
|
(4) Complete damage
|
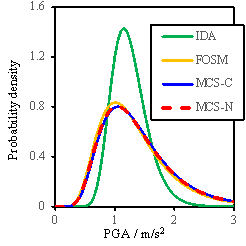
Fig. 14 Probability density results for regional reinforced
masonry buildings
The probability density curves
considering the model parameter uncertainty are illustrated in Fig. 14, from which several observations can be obtained:
(1)
The influence
of uncertainty of model parameters for the regional seismic damage prediction
is very small.
(2)
The FOSM
method, with significantly reduced workload, can achieve similar results as
the Monte Carlo simulation for the regional seismic damage prediction. Therefore,
the FOSM method can be used as an approximation of the Monte Carlo simulation;
(3)
The assumption
for my used in the FOSM method is conservative
compared to the my adopted in the Monte Carlo simulation;
(4)
The consideration
of conditional distribution can lead to a smaller standard deviation, especially
for the ��Complete�� damage state, and is closer to the results obtained by
the FOSM method.
6 Conclusions
The FOSM and Monte Carlo methods
are adopted in this study to perform the parametric sensitivity study for
the regional seismic damage prediction of reinforced masonry buildings. Several
important conclusions are drawn as follows:
(1) The relative sensitivity of each
parameter is similar for individual building and regional building analyses;
(2) The uncertainty of model parameters
should be considered for the seismic damage prediction of an individual building.
This is however not necessary for regional buildings, when the interaction
between buildings is not considered and the parameters of different buildings
are assumed to be independent from each other;
(3) The conditional distribution is
necessary to be considered for the Monte Carlo simulation which reduces the
variance of the results;
(4) The FOSM method, with significantly
reduced workload, can produce similar results as the Monte Carlo simulation,
and can therefore be used as an approximation of the Monte Carlo simulation.
The seismic damage prediction
method used herein can also be implemented to other types of structures. It
is worth noting that certain limitations still exist in this study, such as
the ignorance of the interaction of different buildings with respect to their
dynamic responses. Such dynamic effects will be investigated by further developing
an improved computation model to simulate the interactions between the buildings
and the sites.
Acknowledgement
The authors would like to acknowledge the financial supports
of the National Natural Science Foundation of China (No. 51578320, 51378299)
and the National Key Technology R&D Program (No. 2015BAK14B02). The authors
would like also to acknowledge Professor Quanwang Li and Mr. Xiang Zeng for
their contributions to this work.
Reference
American Society of Civil Engineers (ASCE) (2010) Minimum
design loads for buildings and other structures, ASCE/SEI 7-10, Reston, VA.
Anderson TW (1984) Multivariate statistical analysis. Wiley,
New York.
Atamturktur S, Hemez FM, Laman JA (2012) Uncertainty quantification
in model verification and validation as applied to large scale historic masonry
monuments. Engineering Structures 43:221-234.
ATC (1985) Earthquake damage evaluation data for California
(ATC-13). Applied Technology Council, Redwood, California.
Bayraktar A, Altunışık AC, Muvafık M (2016)
Field investigation of the performance of masonry buildings during the October
23 and November 9, 2011, Van Earthquakes in Turkey. Journal of Performance
of Constructed Facilities 30(2), 04014209.
D��ayala D, Meslem A, Vamvatsikos D, Porter K, Rossetto T,
Crowley H, Silva V (2014) Guidelines for Analytical Vulnerability Assessment
of low/mid-rise Buildings: Methodology. Vulnerability Global Component Project.
Del Gaudio C, Ricci P, Verderame GM, Manfredi G (2016) Observed
and predicted earthquake damage scenarios: the case study of Pettino (L��Aquila)
after the 6th April 2009 event. Bulletin of Earthquake Engineering 14:2643-2678.
Fang L (2009) Experimental research on seismic shear strength
and seismic behavior of autoclaved fly ash brick wall. Dissertation, Changsha
University of Science & Technology, Changsha, China. (in Chinese)
Fellin W, King J, Kirsch A, Oberguggenberger M (2010) Uncertainty
modelling and sensitivity analysis of tunnel face stability. Structural Safety
32(6):402-410.
FEMA (2009) Quantification of building seismic performance
factors (FEMA P695). Federal Emergency Management Agency; Washington, DC,
USA.
FEMA (2012a) Multi-hazard Loss Estimation Methodology: Earthquake
Model (HAZUS-MH 2.1 Technical Manual). Federal Emergency Management Agency,
Washington, DC.
FEMA (2012b) Seismic Performance Assessment of Buildings.
Volume 1 Methodology (FEMA-P58). Federal Emergency Management Agency, Washington,
DC.
Galasso C, Maddaloni G, Cosenza E (2014) Uncertainly analysis
of flexural overstrength for capacity design of RC beams. Journal of Structural
Engineering 140(7):04014037.
Galasso C, Stillmaker K, Eltit C, Kanvinde A (2015) Probabilistic
demand and fragility assessment of welded column splices in steel moment frames.
Earthquake Engineering & Structural Dynamics 44(11):1823-1840.
Gong YN (2008) Experimental research on the seismic performance
of concrete perforated brick shear wall. Dissertation, School of Civil Engineering,
Zhengzhou University, Zhengzhou, China. (in Chinese)
Gu XL, Chen GL, Ma JY, Li X (2010) Experimental study on mechanical
behavior of concrete perforated brick walls under cyclic loading. Journal
of Building Structures 31(12):123�C131. (in Chinese)
Guo ZG, Wu CW, Sun WM, Ni TY (2014) Seismic behavior of recycled
concrete perforated brick masonry. Journal of Basic Science and Engineering
22(3):539�C547. (in Chinese)
Han C (2009) Experimental research on the behavior of brick
masonry column and the seismic behavior of autoclaved fly ash brick. Dissertation,
Xi��an University of Architecture and Technology, School of Civil Engineering,
Xi��an, China. (in Chinese)
Hao T, Liu LX, Wang RY (2008) Experimental study on the seismic
performance of concrete perforated brick walls. Building Block & Block
Building 4:22-25. (in Chinese)
Haselton CB, Liel AB, Taylor-Lange S, Deierlein GG (2008)
Beam-column element model calibrated for predicting flexural response leading
to global collapse of RC frame buildings. Pacific Engineering Research Center
(PEER Report 2007/03), University of California, Berkeley, CA.
He CR, Zhang R, Chen Q, Han SL (2011) Earthquake characteristics
and building damage in high-intensity areas of Wenchuan earthquake I: Yingxiu
town. Natural Hazards 57(2):435-451.
He XQ. Multivariate statistical analysis (2nd Edition) (2008)
Beijing: China Renmin University Press. (in Chinese)
Homma S, Fujita K, Ichimura T, Hori M, Citak S, Hori T (2014)
A physics-based Monte Carlo earthquake disaster simulation accounting for
uncertainty in building structure parameters. Procedia Computer Science 29:855-865.
Hori M (2006) Introduction to Computational Earthquake Engineering.
Imperial College Press, London.
Hori M, Ichimura T (2008) Current state of integrated earthquake
simulation for earthquake hazard and disaster. Journal of Seismology 12(2):307-321.
Huang WW (2006) Seismic test of small-sized concrete block
masonry walls. Cities and Towns Construction in Guangxi 1:69-71. (in Chinese)
Ibarra LF, Krawinkler H (2004) Global collapse of deteriorating
MDOF systems. 13th World Conference on Earthquake Engineering, Vancouver,
BC, Canada.
Ibarra LF, Medina RA, Krawinkler H (2005) Hysteretic models
that incorporate strength and stiffness deterioration. Earthquake Engineering
& Structural Dynamics 34(12):1489-1511.
Jiang HJ, Fu B, Liu L, Yin XW (2014) Study on seismic performance
of a super-tall steel-concrete hybrid structure. The Structural Design of
Tall and Special Buildings 23(5): 334-349.
Kalpić D, Hlupić N (2011) Multivariate Normal Distributions.
International Encyclopedia of Statistical Science. Springer Berlin Heidelberg,
907-910.
Kircher CA, Reitherman RK, Whitman RV, Arnold C (1997) Estimation
of earthquake losses to buildings. Earthquake Spectra 13(4):703-720.
Lee TH, Mosalam KM (2005) Seismic demand sensitivity of reinforced
concrete shear-wall building using FOSM method. Earthquake Engineering &
Structural Dynamics 34(14):1719-1736.
Liel AB, Haselton CB, Deierlein GG, Baker JW (2009) Incorporating
modeling uncertainties in the assessment of seismic collapse risk of buildings.
Structural Safety 31(2):197-211.
Lin XC, Zhang HY, Chen HF, Lin JQ (2015) Field investigation
on severely damaged aseismic buildings in 2014 Ludian earthquake. Earthquake
Engineering and Engineering Vibration 14(1):169-176.
Liu XH, Zhang HX, Liu JW, Liu LQ (1981) A Study of Aseismic
characteristics of masonry building with reinforced concrete tie-columns.
Journal of Building Structures 6:47-55. (in Chinese)
Liu Y, Xu YF, Zhang H (2011) Experimental study on mechanical
behavior of fly ash block walls restricted by constructional columns and top
beam. Industrial Construction 41(8):38�C41. (in Chinese)
Lu
X, Lu XZ, Guan H, Ye LP (2013a) Collapse simulation of reinforced concrete
high-rise building induced by extreme earthquakes. Earthquake Engineering
& Structural Dynamics 42(5):705-723.
Lu
XZ, Lu X, Guan H, Zhang WK, Ye LP (2013b) Earthquake-induced collapse
simulation of a super-tall mega-braced frame-core tube building. Journal
of Constructional Steel Research 82:59-71.
Lu
XZ, Han B, Hori M, Xiong C, Xu Z (2014) A coarse-grained parallel approach
for seismic damage simulations of urban areas based on refined models
and GPU/CPU cooperative computing. Advances in Engineering Software 70:90-103
Lu
XZ, Xie LL, Guan H, Huang YL, Lu X (2015a) A shear wall element for nonlinear
seismic analysis of super-tall buildings using OpenSees. Finite Elements
in Analysis and Design 98:14-25.
Lu XZ, Chen L, Zeng X, Lu WQ (2015b) Numerical simulation
for seismic responses of engineering structures based on cloud computing.
Journal of Shenyang Jianzhu University (Natural Science) 31(5):769-777. (in
Chinese)
Lu
X, Lu XZ, Guan H, Xie LL (2016) Application of earthquake�\induced
collapse analysis in design optimization of a supertall building. The
Structural Design of Tall and Special Buildings, 25(17):926-946.
Lu
XZ, Guan H (2017) Earthquake Disaster Simulation of Civil Infrastructures:
From Tall Buildings to Urban Areas. Springer, Singapore.
Luo KH, Wang YY (2012) Researches about the conversion relationships
among the parameters of ground motions in the seismic design codes of China,
America and Europe. 15th World Conference on Earthquake Engineering, Lisbon,
Portugal.
MAE (2006) Earthquake risk assessment using MAEviz 2.0, a
tutorial. Mid-America Earthquake Center, University of Illinois at Urbana-Champaign,
Urbana-Champaign, Illinois.
Massey Jr F J (1951) The Kolmogorov-Smirnov test for goodness
of fit. Journal of the American statistical Association 46(253):68-78.
Melchers RE (1999) Structural Reliability Analysis and Prediction.
John Wiley & Son Ltd.
Michel C, Hannewald P, Lestuzzi P, Fäh D, Husen S (2016)
Probabilistic mechanics-based loss scenarios for school buildings in Basel
(Switzerland). Bulletin of Earthquake Engineering 15:1471-1496. Doi:10.1007/s10518-016-0025-2.
Milani G, Benasciutti D (2010) Homogenized limit analysis
of masonry structures with random input properties: polynomial response surface
approximation and Monte Carlo simulations. Structural Engineering and Mechanics
34(4):417-447.
MOHURD (2010) Code for seismic design of buildings (GB50011-2010).
Ministry of Housing and Urban-Rural Development of the People��s Republic of
China, Beijing. (in Chinese)
Na UJ, Chaudhuri SR, Shinozuka M (2008) Probabilistic assessment
for seismic performance of port structures. Soil Dynamics and Earthquake Engineering
28(2):147-158.
Pagnini L, Vicente R, Lagomarsino S, Varum H (2008) A mechanical
method for the vulnerability assessment of masonry buildings. 14th World Conference
on Earthquake Engineering, Beijing, China.
Parisi F, Augenti N (2012) Uncertainty in seismic capacity
of masonry buildings. Buildings 2(3):218-230.
Parisi F, Galasso C (2014) Probabilistic strength domains
of masonry walls reinforced with externally bonded composites. 2nd European
Conference on Earthquake Engineering and Seismology.
Poon D, Hsiao L, Zhu Y, Joseph L, Zuo S, Fu G, Ihtiyar O (2011)
Non-linear time history analysis for the performance based design of Shanghai
Tower. In: Structures Congress p. 541-551.
Porter KA, Beck JL, Shaikhutdinov RV (2002) Sensitivity of
building loss estimates to major uncertain variables. Earthquake Spectra 18(4):719-743.
Remo JW, Pinter N (2012) Hazus-MH earthquake modeling in the
central USA. Natural Hazards 63(2):1055�C1081.
Rossetto T, Gehl P, Minas S, Galasso C, Duffour P, Douglas
J, Cook O (2016) FRACAS: A capacity spectrum approach for seismic fragility
assessment including record-to-record variability. Engineering Structures
125:337-348.
Rota M, Penna A, Magenes G (2014) A framework for the seismic
assessment of existing masonry buildings accounting for different sources
of uncertainty. Earthquake Engineering & Structural Dynamics 43(7):1045-1066.
Rubinstein RY (1981) Simulation and the Monte Carlo Method.
Wiley, New York.
SAC (2009) Classification of Earthquake Damage to Buildings
and Special Structures (GB/T 24335-2009). Standardization Administration of
the People's Republic of China. (in Chinese)
Shi QX, Yi WZ (2000) Tentative studies on the aseismic behavior
and investigation of collapse resistant capacity of porous masonry walls.
Journal of Xi��an University of Architecture & Technology 32(3):271�C275.
(in Chinese)
Shin DH, Kim HJ (2014) Probabilistic assessment of structural
seismic performance influenced by the characteristics of hysteretic energy
dissipating devices. International Journal of Steel Structures 14(4):697-710.
Sun QZ, Yan WM, Zhou XY, Zhou HY (2006) Experimental study
on aseismic performance of bearing two-row-hole concrete block wall with constructional
column and horizontal steel bar. Construction Technology 35(6):93-95. (in
Chinese)
Tian
Y, Lu X, Lu XZ, Li MK, Guan H (2016) Quantifying the seismic resilience
of two tall buildings designed using Chinese and US Codes. Earthquakes
and Structures 11(6): 925-942. (accepted) DOI: 10.12989/eas.2016.11.6.925
Ural A, Doğang��n A, Sezen H, Angın Z (2012) Seismic
performance of masonry buildings during the 2007 Bala, Turkey earthquakes.
Natural Hazards 60(3):1013-1026.
Vamvatsikos D, Cornell CA (2006) Direct estimation of the
seismic demand and capacity of oscillators with multi-linear static pushovers
through IDA. Earthquake Engineering & Structural Dynamics 35(9):1097-1117.
Wang FC, Liu YX, Liu YL, Yang JC, Guo G, Guo ZS (2004) Experimental
research on the seismic behavior of the blind-hole porous brick walls. Brick
& Tile 5:7-11. (in Chinese)
Wang T, Zhang YQ, Chen X, Li WF (2014) Mechanical behavior
of masonry walls retrofitted with prefabricated reinforced concrete panels.
Engineering Mechanics 31(8):144-153. (in Chinese)
Wang ZG, Xue GY, Gao BL, Zhang JT (2003) Experimental research
on the seismic behavior of confined shale brick masonry walls. Journal of
Southeast University 33(5):638�C642. (in Chinese)
Weng XP (2010) Numerical simulation analysis and experimental
study on seismic behavior of cavity wall masonry. Dissertation, College of
Civil Engineering and Architecture, Zhejiang University, Hangzhou, China.
(in Chinese)
Wu H, Zhao SC, Xu H, Zhang PB, Wu G (2012a) Damage characteristic
analysis of transverse wall of brick concrete masonry school buildings with
different structural measures. Building Structure 42(S1):226�C230. (in Chinese)
Wu WB (2012b) Study on seismic performance of autoclaved fly
ash bricks. Dissertation, Institute of Engineering Mechanics, China Earthquake
Administration, Harbin, China. (in Chinese)
Xiao JZ, Huang JD, Yao Y (2012) Test on seismic behavior of
recycled concrete block walls. Journal of Building Structures 42(4):100�C109.
(in Chinese)
Xie LL,
Lu XZ, Guan H, Lu X (2015) Experimental study and numerical model calibration
for earthquake-induced collapse of RC frames with emphasis on key columns,
joints and overall structure. Journal of Earthquake Engineering 19(8):1320-1344.
Xiong
C, Lu XZ, Hori M, Guan H, Xu Z (2015) Building seismic response and visualization
using 3D urban polygonal modeling. Automation in Construction 55: 25-34. Xiong C, Lu
XZ, Guan H, Xu Z (2016) A nonlinear computational model for regional seismic
simulation of tall buildings. Bulletin of Earthquake Engineering 14(4):1047-1069.
Xiong
C, Lu XZ, Lin XC, Xu Z, Ye LP (2017) Parameter determination and damage
assessment for THA-based regional seismic damage prediction of multi-story
buildings. Journal of Earthquake Engineering 21(3) 461-485. Xu
Z, Lu XZ, Guan H, Han B, Ren AZ (2014) Seismic damage simulation in urban
areas based on a high-fidelity structural model and a physics engine.
Natural Hazards 71(3):1679-1693.
Xu
Z, Lu X, Law KH (2016) A computational framework for regional seismic
simulation of buildings with multiple fidelity models. Advances in Engineering
Software 99:100-110.
Yamashita T, Hori M, Kajiwara K (2011) Pet scale computation
for earthquake engineering. Computing in Science & Engineering 13(4):44-49.
Yan KF (1985) Experimental research on the seismic behavior
of the KP_1 perforated clay brick walls. Sichuan Building Science 1:34-39.
(in Chinese)
Yang DJ, Gao YF, Sun JB, Wang SX, Cheng QX (2000) Experimental
study on aseismic behavior of concrete block walls with construction-core
column system. Journal of Building Structures 21(4):22�C27. (in Chinese)
Yang WJ, Chen LQ, Zhu XQ (2008b) Experimental study on seismic
behavior of concrete perforated brick walls. Engineering Mechanics 25(9):126�C133.
(in Chinese)
Yang YX (2008a) Experimental study on seismic performance
of autoclaved fly ash-lime solid brick walls. Dissertation, School of Civil
Engineering, Chongqing University, Chongqing, China. (in Chinese)
Ye YH, Li LQ, Sun, WM, Gu Z, Cheng JG (2004) Experimental
study on seismic behaviors of hollow block wall filled with foaming concrete.
Earthquake Engineering and Engineering Vibration 24(5):154�C158. (in Chinese)
Yepes-Estrada C, Silva V, Rossetto T, D��Ayala D, Ioannou I,
Meslem A, Crowley H (2016) The Global Earthquake Model physical vulnerability
database. Earthquake Spectra 32(4):2567-2585.
Yi DH (1996) Non-parametric statistics: method and application.
Beijing: China Statistics Press. (in Chinese)
Yu JG (2003) Study on lateral bearing capacity and lateral
stiffness of prestressed brick walls. Dissertation, School of Civil Engineering,
Chongqing University, Chongqing, China. (in Chinese)
Zeng
X, Lu XZ, Yang TY, Xu Z (2016) Application of the FEMA-P58 methodology
for regional earthquake loss prediction. Natural Hazards 83(1):177-192.
Zhang H (2005) Experimental study on seismic and crack-resistance
behavior of composite concrete block masonry walls. Dissertation, College
of Civil Engineering, Nanjing University of Technology, Nanjing, China. (in
Chinese)
Zhang H (2007b) Experimental study on seismic behavior of
load bearing walls with opening built by fly ash-autoclaved bricks and fly
ash block walls restricted by constructional columns and topbeam. Dissertation,
College of Civil Science and Engineering, Yangzhou University, Yangzhou, China.
(in Chinese)
Zhang W (2007a) The finite element analysis of experimental
results of and research to shear capacity of CFRP strengthened masonry. Dissertation,
School of Civil Engineering and Architecture, Wuhan University of Technology,
Wuhan, China. (in Chinese)
Zhang YQ (2014) Seismic damage analyses of masonry structure
retrofitted by prefabricated reinforced concrete panels. Dissertation, Institute
of Engineering Mechanics, China Earthquake Administration, Harbin, China.
(in Chinese)
Zhang Z (2010) Experimental research a theoretical analysis
on seismic behavior of masonry strengthened by SGFRP. Dissertation, Wuhan
University of Technology, School of Civil Engineering and Architecture, Wuhan,
China. (in Chinese)
Zheng NN (2010) Research on seismic behavior of masonry structures
with fabricated tie-columns. Dissertation, School of Civil Engineering, Chongqing
University, Chongqing, China. (in Chinese)
Zhou HY (2004) Experimental study on seismic behavior of small
concrete hollow block walls restricted by constructional columns. Dissertation,
College of Architecture and Civil Engineering, Beijing University of Technology,
Beijing, China. (in Chinese)
Zhou XY, Li WJ, Yan WM, Guo MN, Zhou HY (2006) An experimental
study on the seismic behavior of small concrete block walls confined by tie
columns and beams. China Civil Engineering Journal 39(8):45-50. (in Chinese)
Zhou Y, Shi W, Han R (2012) Vibration test and analysis of
the fundamental period of multi-story masonry structures with large-bay. Engineering
Mechanics 29(11):197-204. (in Chinese)
Appendix A Typical parameters of reinforced
masonry test specimens considered in this study
|
Reference
|
Number of specimens
|
Typical parameters of specimens
|
|
Length (mm)
|
Height (mm)
|
Thickness (mm)
|
Size of tie columns (mm)
|
|
Liu et al., 1981
|
9
|
4500
|
2800
|
240
|
240
|
|
Yan, 1985
|
15
|
2140
|
1080
|
240
|
120
|
|
Shi and Yi, 2000
|
7
|
2320
|
1220
|
240
|
120
|
|
Yang et al., 2000
|
3
|
1400
|
1120
|
190
|
200
|
|
Wang et al., 2003
|
9
|
1920, 2220, 4520
|
1750
|
240
|
120
|
|
Yu, 2003
|
4
|
3000
|
1500
|
120
|
120
|
|
Wang et al., 2004
|
4
|
2550
|
1800
|
240
|
150
|
|
Ye et al., 2004
|
1
|
2800
|
2000
|
240
|
200
|
|
Zhou, 2004
|
6
|
4410
|
2700
|
190
|
210
|
|
Zhang, 2005
|
4
|
2800
|
2000
|
270
|
200
|
|
Huang, 2006
|
2
|
2380
|
1480
|
190
|
120
|
|
Sun et al., 2006
|
6
|
4410
|
2700
|
190
|
210
|
|
Zhou et al., 2006
|
2
|
4410
|
2700
|
190
|
210
|
|
Zhang, 2007a
|
3
|
2110, 2200
|
2180, 1500
|
240
|
120, 200
|
|
Zhang, 2007b
|
2
|
2720
|
1520
|
120
|
120
|
|
Gong, 2008
|
4
|
1830, 2730
|
2160, 1740
|
240
|
240
|
|
Hao et al., 2008
|
4
|
1830, 2730
|
2160, 1740
|
240
|
240
|
|
Yang, 2008a
|
1
|
2800
|
1400
|
240
|
120
|
|
Yang et al., 2008b
|
3
|
1480, 1730, 2230
|
1250
|
120
|
120
|
|
Fang, 2009
|
4
|
2800
|
1360
|
120
|
120
|
|
Han, 2009
|
4
|
2800
|
1650
|
240
|
120
|
|
Gu et al., 2010
|
8
|
666, 2000
|
413, 1240
|
80, 240
|
40, 120
|
|
Weng, 2010
|
2
|
4770
|
3230
|
250
|
250
|
|
Zhang, 2010
|
1
|
2050
|
1500
|
240
|
150
|
|
Zheng, 2010
|
7
|
3000
|
1500
|
240
|
240
|
|
Liu et al., 2011
|
4
|
2720
|
1580
|
120
|
120
|
|
Wu et al., 2012a
|
4
|
3300
|
1650
|
240
|
78, 120
|
|
Wu, 2012b
|
3
|
1500, 2000
|
1750
|
240
|
120
|
|
Xiao et al., 2012
|
3
|
3200
|
2200
|
220
|
200
|
|
Guo et al., 2014
|
3
|
2650
|
1900
|
240
|
200
|
|
Wang et al., 2014
|
1
|
2000
|
1860
|
240
|
120
|
|
Zhang, 2014
|
2
|
2000
|
1860
|
240
|
120
|
Appendix B Parameters obtained for
reinforced masonry test specimens considered in this study
|
Reference
|
ID
|
Wy
|
Wp
|
dp
|
ds
|
|
Liu et al., 1981
|
WZI-1
|
2.8275
|
1.2967
|
-
|
-
|
|
WZI-2
|
3.0066
|
1.1097
|
-
|
-
|
|
WZI-3
|
2.8747
|
1.1672
|
-
|
-
|
|
WZII-1
|
2.9987
|
1.0851
|
-
|
-
|
|
WZII-2
|
3.0944
|
1.1289
|
-
|
-
|
|
WZII-3
|
3.0465
|
1.0576
|
-
|
-
|
|
WZIII-1
|
2.4423
|
1.1143
|
-
|
-
|
|
WZIII-2
|
2.3585
|
1.1479
|
-
|
-
|
|
WZIII-3
|
2.3236
|
1.1021
|
-
|
-
|
|
Yan, 1985
|
A-1
|
-
|
-
|
0.0035
|
-
|
|
A-2
|
-
|
-
|
0.0015
|
-
|
|
A-3
|
-
|
-
|
0.0026
|
-
|
|
B-1
|
-
|
-
|
0.0023
|
-
|
|
B-2
|
-
|
-
|
0.0019
|
-
|
|
B-3
|
-
|
-
|
0.0020
|
-
|
|
B-4
|
-
|
-
|
0.0020
|
-
|
|
C-1
|
-
|
-
|
0.0019
|
-
|
|
C-2
|
-
|
-
|
0.0025
|
-
|
|
C-3
|
-
|
-
|
0.0025
|
-
|
|
C-4
|
-
|
-
|
0.0019
|
-
|
|
D-1
|
-
|
-
|
0.0020
|
-
|
|
D-2
|
-
|
-
|
0.0019
|
-
|
|
D-3
|
-
|
-
|
0.0021
|
-
|
|
D-4
|
-
|
-
|
0.0025
|
-
|
|
Shi and Yi, 2000
|
W7
|
3.4207
|
1.1628*
|
0.0065
|
0.0152
|
|
W8
|
3.0708
|
0.0055
|
0.0170
|
|
W9
|
3.5095
|
0.0038
|
0.0143
|
|
W10
|
3.3294
|
0.0093
|
0.0196
|
|
W11
|
3.0076
|
0.0096
|
0.0188
|
|
W12
|
2.8930
|
0.0046
|
0.0161
|
|
W13
|
4.0790
|
0.0054
|
0.0179
|
|
Yang et al., 2000
|
Z2-1
|
2.2011
|
2.0755
|
0.0050
|
0.0062
|
|
Z2-2
|
2.1596
|
2.1154
|
0.0037
|
0.0071
|
|
Z3-1
|
2.3257
|
2.0179
|
0.0044
|
0.0070
|
|
Wang et al., 2003
|
W1-t
|
2.0288
|
1.8130
|
0.0034
|
-
|
|
W1-m
|
1.9898
|
1.6273
|
0.0019
|
-
|
|
W1-b
|
2.0883
|
1.5086
|
0.0033
|
-
|
|
W2-t
|
2.1669
|
1.7027
|
0.0020
|
-
|
|
W2-m
|
2.4135
|
1.7273
|
0.0034
|
-
|
|
W2-b
|
2.1892
|
1.4599
|
0.0025
|
-
|
|
W3-t
|
2.3573
|
1.3944
|
0.0042
|
-
|
|
W3-m
|
1.9380
|
1.7772
|
0.0021
|
-
|
|
W3-b
|
1.9544
|
1.5771
|
0.0012
|
-
|
|
Yu, 2003
|
W-I
|
3.7781
|
1.4207
|
0.0088
|
-
|
|
W-II
|
3.9181
|
1.3707
|
0.0098
|
-
|
|
WH-I
|
4.4380
|
1.3333
|
0.0056
|
-
|
|
WH-II
|
4.1940
|
1.4306
|
0.0073
|
-
|
|
Wang et al., 2004
|
MK-1
|
2.8656
|
1.0807
|
0.0033
|
0.0089
|
|
MK-2
|
2.8907
|
1.1304
|
0.0027
|
0.0061
|
|
MK-3
|
2.6974
|
1.2000
|
0.0047
|
0.0078
|
|
MK-4
|
1.9920
|
1.5833
|
0.0052
|
0.0075
|
|
Ye et al., 2004
|
SW2
|
3.0766
|
1.1968
|
0.0017
|
0.0050
|
|
Zhou, 2004
|
A-1
|
1.8439
|
2.7953
|
0.0015
|
0.0034
|
|
A-2
|
2.1267
|
2.2667
|
0.0015
|
0.0025
|
|
A-3
|
1.4171
|
3.7337
|
0.0016
|
0.0021
|
|
A-4
|
2.3503
|
1.8199
|
0.0008
|
0.0021
|
|
A-5
|
2.3538
|
1.9746
|
0.0007
|
0.0032
|
|
A-6
|
2.3538
|
1.9135
|
0.0009
|
0.0023
|
|
Zhang, 2005
|
W-1
|
1.9529
|
1.5840
|
0.0036
|
0.0064
|
|
W-2
|
2.1012
|
1.5375
|
0.0018
|
0.0041
|
|
W-3
|
2.5296
|
1.8042
|
0.0016
|
0.0050
|
|
W-4
|
2.5830
|
1.7826
|
0.0014
|
0.0056
|
|
Huang, 2006
|
CMC-1
|
4.2835
|
1.4194
|
-
|
-
|
|
CMC-2
|
4.6267
|
1.2475
|
-
|
-
|
|
Sun et al., 2006
|
E-1
|
1.8225
|
2.4579
|
0.0008
|
1.822
|
|
E-2
|
1.8284
|
2.9180
|
0.0008
|
1.828
|
|
F-1
|
3.0506
|
1.8205
|
0.0016
|
3.051
|
|
F-2
|
2.4274
|
2.2051
|
0.0018
|
2.427
|
|
G-1
|
3.0352
|
1.6771
|
0.0011
|
3.035
|
|
G-2
|
3.0352
|
1.7740
|
0.0011
|
3.035
|
|
Zhou et al., 2006
|
W-1
|
-
|
1.6499
|
0.0006
|
-
|
|
W-4
|
-
|
1.4059
|
0.0028
|
-
|
|
Zhang, 2007a
|
W1
|
2.2558
|
1.6286
|
0.0029
|
-
|
|
W4
|
3.7276
|
1.1500
|
0.0051
|
-
|
|
W11
|
2.7010
|
1.4143
|
0.0023
|
-
|
|
Zhang, 2007b
|
WA-3
|
-
|
3.3375
|
0.0114
|
0.0144
|
|
WA-4
|
-
|
3.8619
|
0.0186
|
0.0220
|
|
Gong, 2008
|
WA-1
|
4.0302
|
1.4762
|
0.0068
|
0.0097
|
|
WA-2
|
4.1756
|
1.4069
|
0.0083
|
0.0126
|
|
WA-3
|
3.8397
|
1.5000
|
0.0081
|
0.0095
|
|
WA-4
|
4.0620
|
1.3810
|
0.0094
|
0.0119
|
|
Hao et al., 2008
|
WL1
|
4.0302
|
1.3810
|
0.0068
|
0.0104
|
|
WL2
|
3.7437
|
1.5692
|
0.0035
|
0.0062
|
|
WL3
|
3.8397
|
1.5625
|
0.0107
|
0.0131
|
|
WL4
|
3.7120
|
1.3810
|
0.0076
|
0.0119
|
|
Yang, 2008a
|
Q5
|
1.4807
|
2.0600
|
0.0053
|
0.0063
|
|
Yang et al., 2008b
|
W-1b
|
1.7569
|
2.3395
|
0.0085
|
0.0131
|
|
W-2b
|
1.7517
|
2.4249
|
0.0055
|
0.0102
|
|
W-3b
|
2.0738
|
2.3175
|
0.0054
|
0.0115
|
|
Fang, 2009
|
GP-0.6-1
|
2.3574
|
1.5416
|
0.0005
|
-
|
|
GP-0.3-1
|
2.4899
|
1.3942
|
0.0038
|
-
|
|
GP-0.3-2
|
2.4953
|
1.2692
|
0.0020
|
-
|
|
GD-0.6-1
|
1.1680
|
1.8968
|
0.0033
|
-
|
|
Han, 2009
|
FQZ-1
|
2.4913
|
1.3653
|
0.0004
|
-
|
|
FQZ-2
|
2.7654
|
1.3133
|
0.0013
|
0.0015
|
|
FQZ-3
|
3.3201
|
1.0451
|
0.0007
|
0.0030
|
|
FQZ-4
|
2.8531
|
1.2771
|
0.0009
|
0.0018
|
|
Gu et al., 2010
|
PD10-5-0.6C
|
4.6932
|
1.1367
|
0.0029
|
0.0051
|
|
PD10-10-0.3C
|
3.4254
|
1.3550
|
0.0043
|
0.0108
|
|
PD10-10-0.6C
|
4.5262
|
1.3829
|
0.0041
|
0.0140
|
|
PD10-10-0.9C
|
5.6517
|
1.2369
|
0.0035
|
0.0077
|
|
PD15-15-0.6C
|
5.8121
|
1.1118
|
0.0042
|
0.0155
|
|
PD15-15-0.9C
|
5.5556
|
1.1682
|
0.0037
|
0.0155
|
|
PM-0.3C
|
4.7068
|
1.3871
|
0.0043
|
0.0075
|
|
PM-0.6C
|
5.2397
|
1.3043
|
0.0085
|
0.0120
|
|
Weng, 2010
|
W-1
|
-
|
3.0000
|
0.0011
|
-
|
|
W-2
|
-
|
2.4000
|
0.0016
|
-
|
|
Zhang, 2010
|
W-1
|
-
|
-
|
0.0011
|
0.0039
|
|
Zheng, 2010
|
BCW-1
|
2.0498
|
1.7450
|
0.0017
|
0.0065
|
|
BCW-2
|
2.2208
|
1.4000
|
0.0016
|
0.0049
|
|
BC2W-1
|
1.2769
|
2.0464
|
0.0018
|
0.0054
|
|
BC2W-2
|
1.2980
|
1.5909
|
0.0016
|
0.0042
|
|
BC2W-3
|
1.6656
|
1.3700
|
0.0020
|
0.0099
|
|
BC2W-4
|
2.2076
|
1.6824
|
0.0021
|
0.0072
|
|
BC2W-5
|
1.6874
|
1.7297
|
0.0020
|
0.0060
|
|
Liu et al., 2011
|
WB-1
|
-
|
3.2461
|
0.0080
|
0.0166
|
|
WB-2
|
-
|
3.1937
|
0.0107
|
0.0131
|
|
WB-3
|
-
|
3.1623
|
0.0174
|
0.0185
|
|
WB-4
|
-
|
3.9083
|
0.0150
|
0.0173
|
|
Wu et al., 2012a
|
HQ2
|
2.0012
|
1.5969
|
0.0016
|
0.0100
|
|
HQ3
|
2.3499
|
1.5540
|
0.0017
|
0.0120
|
|
HQ4
|
3.0572
|
1.2482
|
0.0015
|
0.0102
|
|
HQ5
|
3.0572
|
1.4475
|
0.0015
|
0.0175
|
|
Wu, 2012b
|
LSGZ-01
|
2.7991
|
1.4044
|
0.0036
|
0.0053
|
|
ZYGZ-01
|
2.5177
|
1.2694
|
0.0027
|
0.0058
|
|
ZYGZ-02
|
1.9270
|
1.3667
|
0.0030
|
0.0089
|
|
Xiao et al., 2012
|
TJ-W-1
|
3.6664
|
1.4923
|
0.0026
|
0.0051
|
|
TJ-W-3
|
4.6799
|
1.4936
|
0.0026
|
0.0075
|
|
TJ-W-4
|
3.7058
|
1.6317
|
0.0029
|
0.0043
|
|
Guo et al., 2014
|
W-1
|
2.4650
|
1.7404
|
0.0044
|
0.0060
|
|
W-2
|
1.8429
|
2.4290
|
0.0050
|
0.0074
|
|
W-3
|
1.8182
|
2.5225
|
0.0050
|
0.0080
|
|
Wang et al., 2014
|
TW-2
|
-
|
-
|
0.0033
|
-
|
|
Zhang, 2014
|
TW-2
|
2.8318
|
2.0603
|
0.0083
|
-
|
|
LW-2
|
1.5588
|
3.3669
|
0.0165
|
-
|
*This value is based on the average value provided by Shi
and Yi (2000).
|